 Open Access Article
Creative Commons Attribution 3.0 Unported Licence
Oxygen grain-boundary diffusion in (La,Sr)FeO3−δ perovskite-oxides probed by molecular-dynamics simulations†
Alexander
Bonkowski
 a,
John A.
Kilner
 b and
Roger A.
De Souza
 *a
*a
aInstitute for Physical Chemistry, RWTH Aachen University, 52074 Aachen, Germany. E-mail: desouza@pc.rwth-aachen.de; Fax: +49 241 80 92128; Tel: +49 241 80 94739
bDepartment of Materials, Imperial College, London, London SW7 2AZ, UK
First published on 25th March 2024
Abstract
Faster grain-boundary diffusion of oxygen has been observed experimentally in polycrystalline samples of Fe-based perovskite oxides at low temperatures, but this behaviour is at present not well understood. In our study, the influence of grain boundaries on oxygen diffusion is studied by means of classical atomistic simulation techniques. Oxygen tracer diffusion coefficients are determined for monocrystalline and polycrystalline simulation cells of orthorhombic La0.9Sr0.1FeO3−δ and cubic La0.6Sr0.4FeO3−δ by molecular-dynamics simulations at temperatures in the range 1000 ≤ T/K ≤ 2000. In particular, the effects of different oxygen nonstoichiometries δ and of equilibrium (as opposed to random) defect distributions were examined. Our results indicate, that the disrupted structures of the grain boundaries hinder oxygen diffusion; that Sr accumulation within grain-boundary regions does not produce faster diffusion; but that faster grain-boundary diffusion is observed when δ is decreased substantially with a consequent decrease in the rate of lattice diffusion.
1 Introduction
Among oxides with high electronic and high ionic conductivity, perovskite-type oxides in the (La,Ba,Sr)(Fe,Co)O3−δ system constitute many of the best performing materials currently known.1–9 Oxide-ion conduction in these materials takes place by oxygen vacancies migrating through the perovskite lattice, and at elevated temperatures this process takes place at moderately fast to astonishingly fast rates depending on the composition. At lower temperatures, the rate of ion conduction diminishes because there are fewer vacancies (sample oxidation occurs) and because the vacancies are less mobile (migration is thermally activated).In addition to oxide ion transport within the perovskite lattice, there is the possibility of transport along grain boundaries. Indeed, for La0.6Sr0.4Fe0.8Co0.2O3−δ (LSCF6482) faster grain-boundary diffusion of oxygen has been observed, although only at lower temperatures (T < 775 K).10,11 At higher temperature, lattice diffusion dominates, as generally observed for (La,Ba,Sr)(Fe,Co)O3−δ compositions. The observation of fast grain-boundary diffusion of oxygen raises a number of questions. Since a general rule for oxides appears to be that ions that are relatively mobile within the lattice are slowed down by structural perturbations, such as grain boundaries,12,13 is there something special about boundaries in LSFC6482 materials that makes them buck this trend? Does faster diffusion occur along the structural cores of the grain boundaries, or does it occur in adjacent space charge zones, in which oxygen vacancies are accumulated? Is the vacancy accumulation linked to Sr accumulation?14,15 And why is faster diffusion not observed at higher temperatures?
In this study, taking two (La,Sr)FeO3 (LSF) compositions as model systems, we use Molecular Dynamics (MD) simulations to study oxygen diffusion in polycrystalline perovskite materials as a function of temperature. LSF represents the simplest of the (La,Ba,Sr)(Fe,Co)O3−δ materials, since it contains only two A-site cations (one necessarily being an aliovalent substituent) and one B-site cation. There are several experimental studies of oxygen diffusion in various LSF compositions,16–22 but simulation studies so far have been restricted to static calculations of oxygen vacancy migration barriers in the perovskite lattice.23–32 Long range diffusion of oxygen in (heavily substituted) LSF materials has not been simulated, and neither has the effect of grain boundaries on the rate of oxygen diffusion been examined. In this study, we compute using molecular-dynamics simulations oxygen tracer diffusion coefficients both within the perovskite lattice as well as within polycrystalline simulation cells. And rather than studying high-symmetry boundaries that are confined to a single plane, we consider curved, general boundaries. The study is structured in the following way. The simulation techniques and the analysis methods required for polycrystalline cells are described in Sec. 2. The results are divided into three subsections: oxygen diffusion in LSF lattices (3.1); compositional analysis of polycrystalline cells (3.2) and oxygen diffusion in polycrystalline cells (3.3). A discussion of the results is given in Sec. 4.
2 Methods
2.1 Force field
The interactions in our atomistic simulations are described with a short-range potential of the Buckingham form and a long-range coulombic term: | (1) |
2.2 MD simulations
All MD calculations were carried out in the LAMMPS (Large-scale Atomic/Molecular Massively Parallel Simulator) code,35,36 using the velocity Verlet algorithm,37 with periodic boundary conditions, an isothermal–isobaric (NpT) ensemble with a Nosé–Hoover thermostat and barostat38,39 (with damping times of tp = 1 ps, tT = 0.1 ps) at p = 1013.25 mbar, and a timestep of δt = 1 fs.Bulk cells were created by a 15 × 10 × 15 expansion of the orthorhombic Pnma unit cell and thus contained ca. 45![[thin space (1/6-em)]](https://www.rsc.org/images/entities/char_2009.gif) 000 ions. For each composition (LSF10 and LSF40), two cells were created by randomly replacing 10% and 40% of lanthanum ions with strontium ions, respectively. Oxygen vacancies were introduced, i.e. oxide ions were removed, until the total cell charge was zero.
000 ions. For each composition (LSF10 and LSF40), two cells were created by randomly replacing 10% and 40% of lanthanum ions with strontium ions, respectively. Oxygen vacancies were introduced, i.e. oxide ions were removed, until the total cell charge was zero.
2.3 Polycrystal creation
Polycrystalline cells containing 2, 5, 10 or 20 grains were constructed with the ATOMSK code.40 In each case, the grains were created in a cubic simulation cell with cell dimensions of 80 Å × 80 Å × 80 Å, and thus with ca. 40![[thin space (1/6-em)]](https://www.rsc.org/images/entities/char_2009.gif) 000 ions. For ion pairs at the boundaries separated by less than 1.5 Å, one ion was removed at random to avoid instabilities during the minimisation. Since this leads to A:B ≠ 1, cations at the grain boundary were removed until the numbers of A- and B-site ions were identical. Subsequently, strontium-containing cells were obtained by replacing at random the appropriate fraction of lanthanum ions with strontium ions. Oxide ions were removed at random to achieve a charge-neutral simulation cell.
000 ions. For ion pairs at the boundaries separated by less than 1.5 Å, one ion was removed at random to avoid instabilities during the minimisation. Since this leads to A:B ≠ 1, cations at the grain boundary were removed until the numbers of A- and B-site ions were identical. Subsequently, strontium-containing cells were obtained by replacing at random the appropriate fraction of lanthanum ions with strontium ions. Oxide ions were removed at random to achieve a charge-neutral simulation cell.
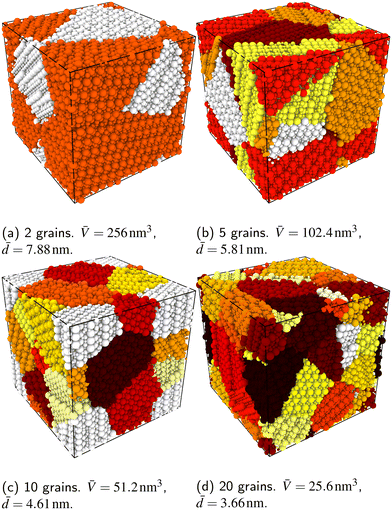
In order to capture some of the variability of grain-boundary structures, we used three different random seeds (meaning differently oriented grain centres, grain volumes, and  configurations) to create cells containing 2, 5, 10 or 20 grains, resulting in a total of 12 cells for each compound (LSF10 and LSF40). Representative simulation cells are shown in Fig. 1, together with the average grain volume
 ![[V with combining macron]](https://www.rsc.org/images/entities/i_char_0056_0304.gif) (the cell volume being 512 nm3) and the average grain diameters
(the cell volume being 512 nm3) and the average grain diameters ![[d with combining macron]](https://www.rsc.org/images/entities/i_char_0064_0304.gif) , assuming spherical grains.
, assuming spherical grains.
MD simulations of polycrystalline cells were limited to T ≤ 2000 K, since some cells appeared to undergo melting at higher temperatures. Polycrystalline cells were subject to equilibration for 2.0 ns at 2000 K. In the production run, the oxide ions' mean-squared displacement was monitored for 1.0 ns at 1200 ≤ T/K ≤ 2000.
2.4 MMC simulations
Since cation diffusion in perovskites is generally not amenable to MD simulations,41,42 on account of the high migration barriers and thus low ion jump rates, cations will not achieve equilibrium distributions on the timescale of an MD simulation. For real samples, high-temperature anneals for several hours at elevated temperatures lead to non-uniform cation concentrations on account of cation redistribution. In order to investigate the influence of equilibrium cation distributions on oxygen transport in polycrystalline cells, we used a Metropolis Monte Carlo43 (MMC) approach, as implemented in the LAMMPS code, to swap (quasi)particles from both the cation ( and La×La) and anion (O×O and
  ) sublattices to simulate the high temperature sintering. NB: through our use of general grain boundaries in three different simulation cells we are able to use cells with a distribution of grain boundaries, which is a better representation of a real system.44
In each MMC step two particles (ions or vacancies) were swapped with each other and the energy was calculated. The swaps were accepted according to the probability P = exp[−ΔE/(kBT)], where ΔE = Eafter − Ebefore is the energy difference before and after the swap. In static calculations, La×La were swapped with  and, simultaneously, O×O were swapped with
  with 100
![[thin space (1/6-em)]](https://www.rsc.org/images/entities/char_2009.gif) 000 attempts each after which the total energy was observed to be constant. A hybrid approach (MMC + MD)45 was not employed because the swapping of oxide ions and oxygen vacancies is then no longer possible (owing to the difficulties in identifying oxygen vacancies in MD simulations).
000 attempts each after which the total energy was observed to be constant. A hybrid approach (MMC + MD)45 was not employed because the swapping of oxide ions and oxygen vacancies is then no longer possible (owing to the difficulties in identifying oxygen vacancies in MD simulations).
2.5 Compositional analysis
As a consequence of using polycrystalline cells of the type shown in Fig. 1 in MD simulations, one is confronted with two problems when trying to determine the compositions of the grain-boundary and bulk phases:1. The grain boundary is not confined to a single geometric plane, which makes determining the composition normal to the grain boundary difficult.
2. Vacancies, being the absence of ions, are difficult to identify in MD simulations, on account of the ions' vibrations.
One possibility46,47 is to consider grain boundaries at their initial positions from the creation of the cell, rather than after the MD simulation, but we found this method to be unreliable, since ions at the boundaries relax substantially within the MD equilibration (altering the nature and the position of the interfaces). A superior possibility that has been applied to metallic systems is to use structural identifier methods, such as Common Neighbour Analysis (CNA)48–50 or Polyhedral Template Matching (PTM),51 to differentiate between bulk and grain-boundary regions.
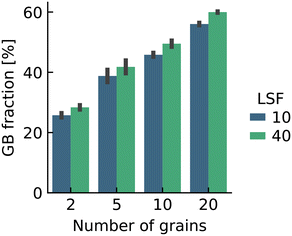
Here we were forced, owing to the highly defective and mobile oxide-ion sublattice to employ an indirect approach, namely differentiating grain-boundary from bulk regions based solely on the cations. Specifically, all anions were removed from the initial simulation cell (for instance, in this case: Fig. 1c). The cations (La, Sr, Fe) form a bcc sublattice, and deviations from this bcc sublattice are thus identified as grain-boundary regions. Here, we use the interval cutoff variant51 of the CNA as implemented in the OVITO package,52 since it doesn't require manually specifying a cutoff value. Results obtained from the other methods (not shown) were reasonably similar. Fig. 2 shows the result for the cell shown in Fig. 1(c). Based only on the cations, the average grain-boundary fraction (number of grain-boundary cations divided by total number of cations) was calculated. One would expect that the data for LSF10 and LSF40 to be identical, since the data were derived from the same initial polycrystalline cell, but as shown in Fig. 3, there are slight differences. We attribute the difference to the four-times-higher concentration of both  and
and  in LSF40, which leads to stronger structural perturbations of the bcc cation sublattice in the vicinity of the grain boundaries (in addition to the perturbation from the grain boundaries themselves) and thus to more cations being identified as belonging to this region. We show this plot because the difference between LSF10 and LSF40 indicates the limits of this analysis method.
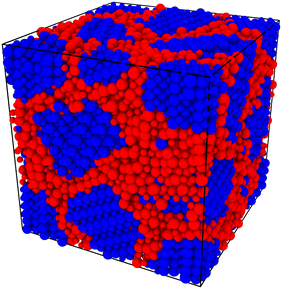 | ||
| Fig. 2 Polycrystalline cell with 10 grains (see Fig. 1c) after equilibration at 1800 K. Shown are only the cations (i.e. La, Sr, and Fe). The colour coding refers to the structure type identified by common-neighbour analysis of the cation sub-lattice, as implemented in the OVITO package.52 Blue ions are identified as residing in a bcc environment (and hence are bulk ions), whereas red ions do not have a bbc environment (and are therefore grain-boundary ions). | ||
After analysis of the cations' bcc sublattice, the anions can be considered again. It is possible to use a nearest-neighbour or cutoff criterion to assign the anions to bulk or grain-boundary cations, but this approach is not self-consistent, since some anions can be nearest neighbours (or can be within a cutoff) of both grain boundary and bulk cations, resulting in ambiguous assignment of labels. Therefore, our criterion was to count anions as grain-boundary particles if the majority of the five nearest-neighbouring cations is non-crystalline, and as bulk particles otherwise.
Another difficulty concerns vacancy concentrations. As noted above, while oxygen vacancies are considered as swappable particles in MMC calculations, they are not considered as particles in the MD simulations (in which a vacancy means that an ion is missing). In order to still extract oxygen-vacancy concentrations after MD simulations, the oxygen-vacancy fraction was calculated indirectly. To do so, the number of cations in the respective region was extracted and from this Ncations, the number of oxygen sites Nanions was obtained (3·Ncations = 2·Nanions). Subtracting the number of anions actually found with the chemical analysis in the respective region yields the number of vacancies (and thus the vacancy fraction). Corrections were applied to account for the non-planar structure of the grain boundaries by calculating the anion-to-cation ratio in the ideal initial structure (which deviates slightly from 2: 3 due to the way anions are assigned), where the vacancy content is known (LSF10: 1.66%; LSF40: 6.67%).
3 Results
3.1 LSF lattices
![[3 with combining macron]](https://www.rsc.org/images/entities/char_0033_0304.gif) c symmetry at T = (1228 ± 9) K and then to cubic Pm
c symmetry at T = (1228 ± 9) K and then to cubic Pm![[3 with combining macron]](https://www.rsc.org/images/entities/char_0033_0304.gif) m symmetry at T = (2140 ± 30) K.53 Upon substituting La with Sr, the transition temperatures are lowered substantially, according to both computational31 and experimental studies.53,54 In our MD simulations of LSF10 and LSF40, the orthorhombic structure transformed directly to the cubic phase. The transition temperatures were overestimated in both cases, although the trend towards lower transition temperatures with increasing Sr content is reproduced (see Fig. 4).
m symmetry at T = (2140 ± 30) K.53 Upon substituting La with Sr, the transition temperatures are lowered substantially, according to both computational31 and experimental studies.53,54 In our MD simulations of LSF10 and LSF40, the orthorhombic structure transformed directly to the cubic phase. The transition temperatures were overestimated in both cases, although the trend towards lower transition temperatures with increasing Sr content is reproduced (see Fig. 4).
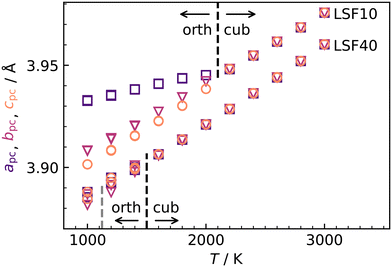 | ||
Fig. 4 Pseudocubic cell parameters a (purple squares), b (magenta triangles), and c (orange circles) obtained for LSF10 and LSF40 from MD simulations as a function of temperature T. At each temperature, two simulations with different random  distributions and different initial kinetic-energy distributions were carried out. The phase transitions from orthorhombic (a ≠ b ≠ c) to cubic (a = b = c) are indicated with black lines; the grey line indicates the experimental transition temperature for LSF40.54 distributions and different initial kinetic-energy distributions were carried out. The phase transitions from orthorhombic (a ≠ b ≠ c) to cubic (a = b = c) are indicated with black lines; the grey line indicates the experimental transition temperature for LSF40.54 | ||
Although the potentials are unable to reproduce the rhombohedral phase, this is not critical, since experimental data for oxygen diffusion refers to the temperature ranges for orthorhombic LSF10 and cubic LSF40 (1000 ≤ T/K ≤ 1373), i.e., phases that are reproduced in our simulations. In fact, the overestimation of transition temperatures allows tracer diffusion coefficients to be determined at elevated temperatures, where jump statistics are much better,55 and then to be extrapolated to lower temperatures.
 were obtained by monitoring the mean-squared displacement of the oxide ions, 〈r2O〉, as a function of time t (see Fig. S1†). If 〈r2O〉 evolves smoothly and linearly with t,
  can be obtained from the Einstein relation:
 | (2) |
 was calculated from the expression of Usler et al.55
In order to compare our results with literature data, we calculated from a tracer diffusion coefficient  the oxygen-vacancy diffusion coefficient Dv, since our MD simulations were performed at constant oxygen deficiency, whereas experiment refers to constant oxygen partial pressure, and thus varying oxygen deficiency.
 | (3) |
The oxygen-vacancy diffusivities obtained are plotted in Fig. 5a and b for LSF10 and LSF40. Both compositions exhibit a lower activation enthalpy of oxygen-vacancy migration for the (high-temperature) cubic phase than for the (lower-temperature) orthorhombic phase (see Table 1). Similar behaviour was recently observed for oxygen tracer diffusion in the orthorhombic and cubic phases of CaTiO3.57 In other words, at constant composition, oxygen-vacancy diffusion in perovskites is evidently faster in the higher symmetry phase.
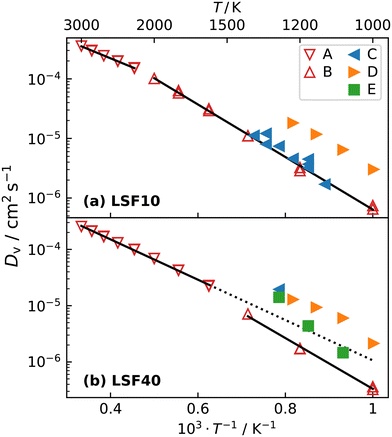 | ||
| Fig. 5 Oxygen-vacancy diffusion coefficients Dv as a function of inverse temperature for (a) LSF10 and (b) LSF40: A, this study (orthorhombic); B, this study (cubic); C,17 D,56 E.20 The high-temperature simulation data and the linear extrapolation represents diffusion in cubic LSF, whereas low-temperature data refers to orthorhombic LSF. The transition temperature in LSF40 is overestimated by the empirical potentials, hence, the linear extrapolation of the cubic data is given as a guide to the eye. Errors in the diffusion coefficients, calculated with the expression of Usler et al.,55 are smaller than the symbol size. The same figure comparing simulations with different oxygen vacancy concentrations can be found in Fig. S2.† | ||
| Composition | ΔHcubmig/eV | ΔHorthmig/eV |
|---|---|---|
| LSF10 | 0.60 ± 0.01 | 0.88 ± 0.02 |
| LSF40 | 0.71 ± 0.01 | 0.90 ± 0.04 |
Fig. 5 also compares our results with experimental data. The experimental Dv data for LSF10 corresponds to oxygen-vacancy diffusion in the orthorhombic lattice, and for LSF40, to oxygen-vacancy diffusion in the cubic lattice (dashed extrapolation in Fig. 5b). It is seen that, for dataset C,17 the agreement is excellent for both compositions; for dataset D56 there is good agreement in terms of activation enthalpies, but some differences in terms of absolute values; and for dataset E20 there are larger deviations—it seems to be an outlier. These conclusions are also evident in the summary of activation enthalpies for oxygen-vacancy migration given in Fig. 6.
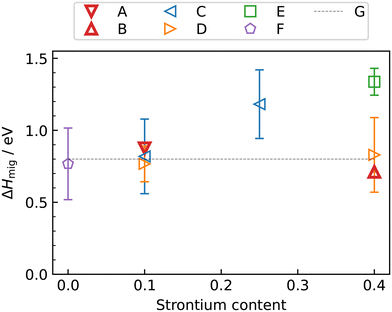 | ||
| Fig. 6 Activation enthalpy of oxygen-vacancy diffusion in La1−xSrxFeO3−δ as a function of strontium content x: A, this study (orthorhombic); B, this study (cubic); C,17 D,56 E,20 F,16 G.27 Note that the phase transition are temperature dependent and thus not all experimental data points always correspond to the same phase. | ||
3.2 Polycrystalline LSF
 and
and  were re-distributed at T = 2000 K in the MMC calculation; cations were not mobile in the subsequent MD simulations, but
  were).
 equilibrate.
Although a system with a uniform distribution of acceptors does not correspond to ceramic samples sintered at high temperatures, this set of data allows us to make some important points. Fig. 7 shows that the
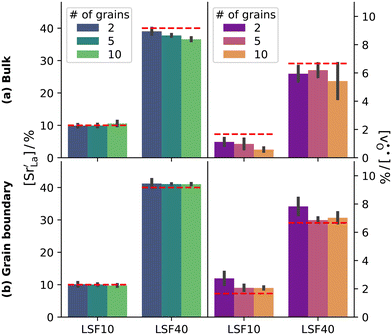
  fraction, averaged over the cells with 2, 5 or 10 boundaries, remains close to the initial values. This is essentially confirmation of the method, since there are no possibilities for cations to move, no cation vacancies were introduced into the cell, and cation-vacancy formation is characterised by prohibitively high energies, so that no cation defects form during the MD simulation. Small deviations from the nominal values indicate the limits of the method, with higher deviations for the more highly substituted LSF40 systems (cf.Fig. 3). In contrast, the oxygen sublattice does equilibrate during the MD run, and the
  concentration is found to be higher in the grain-boundary regions than in the bulk regions, indicating a segregation of the vacancies to the grain boundaries. By increasing the Sr content from LSF10 to LSF40, the relative accumulation is less substantial, while the absolute change is similar (e.g., ≈1% for 2-grain cells).
 equilibrated at high T,
  at all T.
In order to capture the Sr′La distribution after a high-temperature sintering step, we performed MMC simulations as described in Sec. 2.4, swapping
  and La×La as well as O×O and
  with MMC temperatures in the range of 1000 ≤ T/K ≤ 2000. The strong decrease in the system's energy to a constant value is shown in Fig. S3.†
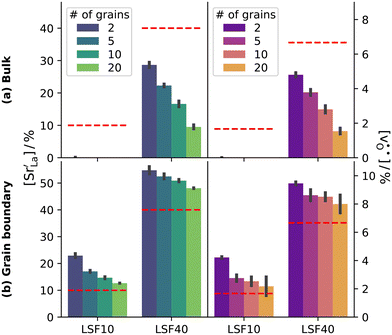
When comparing structures obtained from MMC calculations, in which only the MMC temperature was different, we find little to no difference in grain-boundary compositions. Since the MMC swapping temperature evidently does not have a substantial influence on the results (see also Fig. S4†), we will only use the cells that were subject to MMC swapping at the highest T.
The compositional analysis of the equilibrated simulation cells is shown in Fig. 8. The Sr content and the oxygen-vacancy content in the grain-boundary regions increase strongly, decreasing drastically in the bulk regions. The effects are so pronounced that the bulk of LSF10 has essentially neither  nor
nor  left. The drastic decreases are due to the rather small grain sizes in the simulation cells, which result in much higher ratios of grain boundary volume (see Fig. 3) to bulk volume than in a typical ceramic sample.
3.3 Oxygen diffusion in polycrystalline cells
For the present analysis of diffusion data, one should bear in mind that the diffusion coefficients obtained for polycrystalline cells refer to an effective diffusivity, i.e., some average of diffusion in the bulk phase and along and across grain boundaries. Depending on the relative rates of these three processes, a variety of scenarios are possible. For example, if diffusion along boundaries is faster than in the bulk and diffusion across boundaries is not hindered, then one would expect the effective diffusion coefficient to increase. This is not the only scenario, however, that may give rise to higher
  , so that one needs to be careful when making conclusions from effective diffusion data.
One can sort oxide ions, at the beginning of an MD run, into those in grain-boundary regions and those in the bulk regions (see Sec. 2.5). From the respective 〈r2O〉, one would be tempted to calculate tracer diffusion coefficients for the two regions. If, however, oxide ions leave their initial region during the course of the MD run, and diffuse most of the time in the other region, they still count as belonging to the initial region. Calculated diffusion coefficients are therefore not necessarily representative of the regions to which they are attributed. In order to avoid such problems, we stayed at the level of effective diffusion coefficients.
 equilibrate.
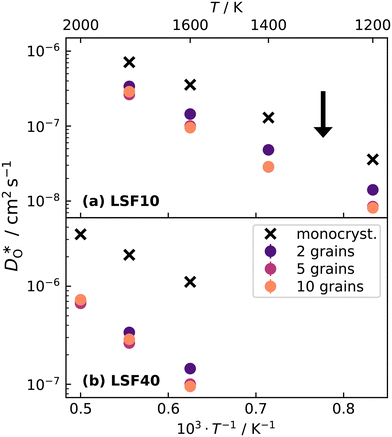
After thermal equilibration at 2000 K for 2 ns, each structure was subject to a 0.5 ns equilibration period followed by a 0.5 ns production run at the target temperature. Tracer diffusion data is plotted in Fig. 9.
Over the entire temperature range, oxygen diffusion is slower in the polycrystalline cells than in the monocrystalline cells. Moreover, as the total number of grains (and thus the density of grain boundaries) increases, the diffusivities decrease. This decrease indicates that grain boundaries hinder oxygen diffusion. In order to explain this behaviour, one requires, in the grain-boundary regions, that there are fewer oxygen vacancies, or that the oxygen vacancies have a lower diffusivity, or some combination thereof. In fact, the chemical analysis of Fig. 7 revealed that the concentration of oxygen vacancies is increased at the grain boundaries, leading to the conclusion that Dgbv has to be much lower than Dbv, at least for a random distribution of Sr. The boundaries evidently act as a structural perturbation as far as oxygen-vacancy diffusion is concerned, and one could argue tentatively that this arises from the lower symmetry of the grain-boundary regions relative to that of the bulk phase (cf. Sec. 3.1.2).
 equilibrated at high T,
  at all T.
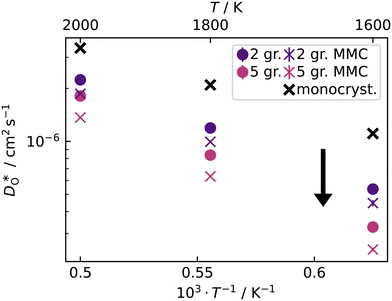
Fig. 10 compares oxygen tracer diffusion coefficients in polycrystalline LSF40 with and without prior MMC runs, i.e. equilibrium distributions of
  versus homogeneous distributions. Systems subjected to MMC minimisation exhibited lower values of
  , indicating that higher
  at the grain-boundaries has a detrimental effect on oxygen transport. Similar behaviour was observed for LSF10 (see Fig. S6†).
Since the grain-boundary regions in the cation equilibrated cells are even richer in oxygen vacancies (see Fig. 8) than in the homogeneous cell (see Fig. 7), clearly the oxygen-vacancy diffusivity is diminished by the presence of  . Indeed, the same behaviour is observed for the bulk phase: monocrystalline simulation cells of LSF display decreasing oxygen-vacancy diffusivity with increasing Sr substitution level (see Fig. S5†).
 concentration.
In the two previous sections, it was shown that (i) the grain boundaries themselves do not give rise to faster grain-boundary diffusion of oxygen and (ii) that increased amounts of Sr at the grain boundaries lead to a decrease rather than an increase in oxygen diffusivity. This is not consistent, however, with experiment. One significant difference between simulation and experiment is that the simulations cells have a constant concentration of vacancies (that exactly charge compensates the Sr substituent), whereas the experimental samples have variable oxygen-vacancy concentrations (corresponding to constant oxygen partial pressure). In particular, experimental samples undergo oxidation at lower temperatures, and at lower temperatures faster grain-boundary diffusion of oxygen is observed.10,11 To mimic sample oxidation in the simulation cells, we lowered the number of oxygen vacancies (and increased the Fe valence), keeping the other simulation parameters constant. Specifically, two new sets of calculations were carried out in which the concentrations of oxygen vacancies were only 10% or 2% of the original values. The excess charge was compensated by modifying the Fe3+ charge uniformly (LSF10: to Fe3.09+ or Fe3.098+, LSF40: to Fe3.36+ or Fe3.392+). Both single crystals and polycrystals were considered, in order to ascertain the differences displayed by the polycrystalline cells relative to the correct reference values (i.e. single-crystal cells). To reproduce the experimental situation as closely as possible, we kept the
  distribution that we obtained from MMC calculations with the full oxygen-vacancy amount and only reduced the number of oxygen vacancies, since the
  distribution that develops at sintering temperatures will not change at the low temperatures of sample oxidation.
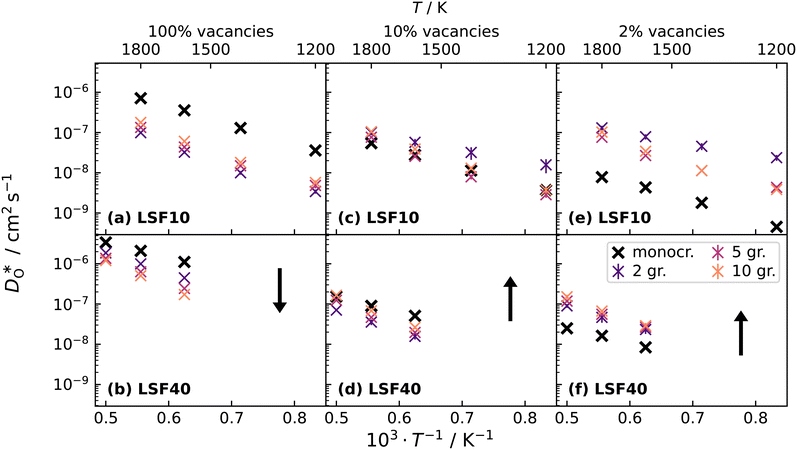
Oxygen diffusivities obtained from MD simulations are given in Fig. 11. In single-crystal cells, tracer diffusion coefficients decrease, relative to the 100% case, by about one order of magnitude for 10% and another half an order of magnitude for 2%, as expected for the relevant decreases in the oxygen-vacancy concentrations. The decreases are not, however, exactly a factor of 10 and a further factor of 5, since there are not only major changes in the oxygen-vacancy concentrations, but also minor changes in the oxygen-vacancy diffusivities, which we attribute to increases in Fe valence or increases in oxide-ion concentration (cf. Fig. S2†).
In contrast, this behaviour is not seen for the polycrystalline cells on going from 100% of the  -balancing vacancies to 10% or 2% vacancies. In LSF40, the variation in isothermal diffusion coefficient with grain-boundary density is now reversed. An increase in grain-boundary density leads to an increase of
  , indicating that faster grain-boundary diffusion is observed when the bulk concentration of oxygen vacancies is low. For LSF10, two effects are observed that are not present in LSF40. First, the reversal of the variation in isothermal diffusion coefficient with grain-boundary density is present at the full vacancy concentration, rather than only at lower vacancy concentration as for LSF40. This is a consequence of oxygen vacancies being almost fully depleted from the bulk regions after the MMC runs (see Fig. 8); thus, the reversal occurs already at the highest vacancy concentration. Second, in the cases 10% and 2% vacancies, the cells with 2 grains deviate from the trend by showing higher-than-expected tracer diffusion coefficients. From trajectories of the molecular dynamics run, we identified bulk transport in regions far away from the grain boundaries. While only very few oxygen vacancies are available there (most are present at the grain boundaries), they exhibit high diffusivities as these regions are nominally free of Sr; thus, the lower activation enthalpy (0.52 eV vs. 0.6 eV) and higher oxygen diffusivity of lanthanum ferrite is sampled (cf. Fig. S5†).
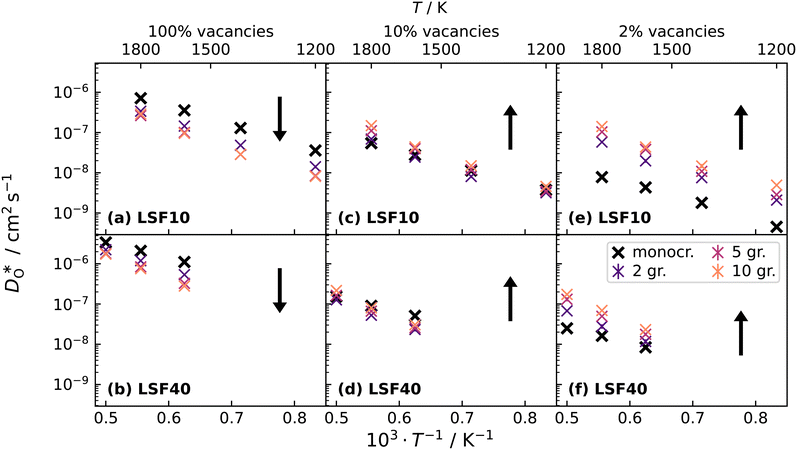
Lastly, we investigate to what extent the general behaviour observed in Fig. 11 is due to increased  at the grain boundaries. To this end, an additional set of simulations was carried out with a homogeneous
  distribution. The results are shown in Fig. 12. The
  values in LSF40 are mostly unchanged due to the smaller relative changes in
  content in grain boundary regions (see Fig. 8), confirming that increased
  accumulation does not play a significant role in the observed behaviour. In LSF10, however, the two effects mentioned above are not observed, i.e. the reversal of the variation in isothermal diffusion coefficient with grain boundary density is not present in case (a) with a full vacancy concentration, and the cells with 2 grains do not deviate from the trend.
To emphasise the main result, we plot in Fig. 13 oxygen tracer diffusion coefficients calculated for T = 1800 K versus oxygen-vacancy concentration for both compositions. In these double-logarithmic plots, we find that  for the monocrystalline cells decreases, as expected, almost linearly with
  for the polycrystalline cells, however, is essentially constant for LSF10 for all
  and for LSF40 at the two lowest
  . This suggests that
  within the grain-boundary regions in our simulations are more or less invariant of the bulk level. The plots also emphasise the need to regard short-circuit diffusion as faster, rather than fast. For LSF10, the rate of oxygen diffusion in the polycrystalline cells hardly changes. What does change is its relation to the diffusion rate in the bulk value. One last point is that care must be exercised in interpreting such data. The bulk composition in the monocrystalline cells is not the bulk composition in the polycrystalline cells, owing to the small grain size and the strong
  segregation to the grain boundaries.
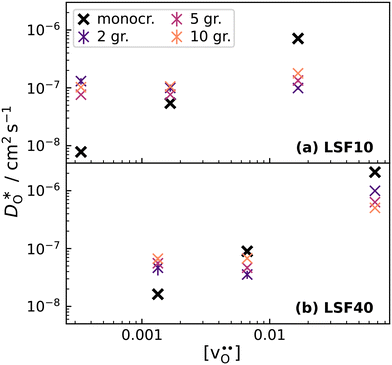 | ||
Fig. 13 Oxygen tracer diffusion coefficients in polycrystalline LSF at T = 1800 K, extracted from Fig. 11, as a function of  . . | ||
4 Discussion
The main result of this computational study is that faster grain-boundary diffusion of oxygen in polycrystalline LSF materials is only observed when bulk diffusion of oxygen is relatively slow. This agrees very well with experimental studies10,11 of oxygen diffusion in polycrystalline LSCF6482, in which faster grain-boundary diffusion was detected at low temperatures, where bulk diffusion is substantially diminished on account of sample oxidation.Looking beyond the (La,Ba,Sr)(Fe,Co)O3−δ system, we find that the main result also agrees well with the observation of faster grain-boundary diffusion of oxygen in the (La,Sr)MnO3+δ perovskites.58–61 Compared with (La,Ba,Sr)(Fe,Co)O3−δ perovskites, (La,Sr)MnO3+δ is an oxygen hyperstoichiometric material, with the excess oxygen arising from the presence of cation vacancies. These defects depress the concentration of oxygen vacancies through a Schottky equilibrium,62–67 and they also diminish the oxygen-vacancy diffusivity.33 As a consequence, bulk diffusion of oxygen in (La,Sr)MnO3+δ is orders of magnitude lower than in (La,Ba,Sr)(Fe,Co)O3−δ compositions, and faster grain-boundary diffusion of oxygen is observed, not just at lower temperatures, but also at much higher temperatures.
Of the defining questions in the Introduction, one remains unanswered. It concerns the possible presence and role of space-charge zones. On the one hand, the activation enthalpies measured experimentally for bulk and grain-boundary diffusion in LSCF6482 ref. (11) (and also for grain boundaries58 and dislocations61 in (La,Sr)MnO3+δ) are the same within experimental error. This behaviour is consistent with faster diffusion along space-charge zones at the grain boundaries.15,68 On the other hand, our MD simulations yield activation enthalpies of diffusion that are higher for the polycrystals than for the single crystals (see Fig. S8†). This is consistent with the idea that the boundaries constitute structural perturbations, for which the activation enthalpy of migration is higher than in the bulk. And faster diffusion then arises fom the higher concentration of oxygen vacancies. (A lower activation enthalpy of oxygen diffusion in LaMnO3 has also been predicted from DFT calculations,14 but these predictions do not take cation vacancies into account.) It is, however, questionable if space-charge zones were rendered properly in our simulations, since the bulk phases often were completely devoid of defects, and space-charge zones are regions of modified bulk defect concentrations. The chemical analysis of Sec. 2.5 is unable to provide any information, since it is not sufficiently sensitive to small local deviations in charge neutrality. We conclude that the simulations reproduce the experimental results qualitatively, but quantitative agreement requires a new, extensive set of simulations. In particular, simulations with much larger grains are required, so that bulk defect concentrations are recovered within the bulk phase. We estimate that simulation cells with at least 106 ions are necessary. And in these cells, given the importance of the degree of oxygen nonstoichiometry, experimental values of δ(T) should be used.
5 Conclusions
In this study, polycrystalline (La,Sr)FeO3−δ was investigated by means of molecular dynamics simulations with the aim of improving our understanding of the role of grain boundaries in oxygen transport. The major findings are as follows:• Owing to the complexity of polycrystalline simulation cells, extracting information about the grain-boundary composition is not straightforward. A compositional analysis protocol was developed to differentiate between bulk and grain-boundary regions and to quantify acceptor-substituent and oxygen-vacancy concentrations in the respective regions.
• Oxygen tracer diffusion coefficients in stoichiometric polycrystalline cells are lower than in the corresponding monocrystalline cells, and they decrease with increasing grain-boundary density, confirming a blocking effect of grain boundaries.
• The increased concentration of the acceptor substituent  at the grain boundaries (as a consequence of high-T annealing) has a detrimental effect on oxygen transport, as it further decreases the oxygen-vacancy diffusivity.
• The observed low-temperature behaviour is reproduced by the simulations when the oxygen-vacancy concentration is reduced from fully compensating the acceptor substituent to a much lower level, for which bulk diffusion is drastically diminished. In this case, the grain boundaries remain oxygen-vacancy rich and thus are the only place where oxygen-vacancy diffusion can occur. Caution is required in transferring all results to experiments, however, because of the extremely small grain size in the simulation cells.
Author contributions
Alexander Bonkowski: methodology, formal analysis, investigation, data curation, writing – original draft preparation, writing – review and editing, visualisation. John A. Kilner: conceptualisation, funding acquisition, writing – review and editing. Roger A. De Souza: conceptualisation, funding acquisition, project administration, supervision, writing – original draft preparation, writing – review and editing.Conflicts of interest
There are no conflicts to declare.Acknowledgements
Simulations were performed with computing resources granted by RWTH Aachen University under project rwth0773. The authors gratefully acknowledge the computing time provided to them at the NHR Center NHR4CES at RWTH Aachen University (project number p0020234). This is funded by the Federal Ministry of Education and Research, and the state governments participating on the basis of the resolutions of the GWK for national high performance computing at universities (https://www.nhr-verein.de/unsere-partner). This project has received funding from the European Union's Horizon 2020 research and innovation programme under grant agreement No. 101017709 (EPISTORE).Notes and references
- O. Yamamoto, Solid State Ionics, 1987, 22, 241–246 CrossRef CAS
.
- B. Steele, J. Power Sources, 1994, 49, 1–14 CrossRef CAS
.
- J. C. Boivin and G. Mairesse, Chem. Mater., 1998, 10, 2870–2888 CrossRef CAS
.
- J. Kilner, Solid State Ionics, 2000, 129, 13–23 CrossRef CAS
.
- T. Norby, J. Mater. Chem., 2001, 11, 11–18 RSC
.
- J. B. Goodenough, Annu. Rev. Mater. Res., 2003, 33, 91–128 CrossRef CAS
.
- E. V. Tsipis and V. V. Kharton, J. Solid State Electrochem., 2008, 12, 1367–1391 CrossRef CAS
.
- A. Orera and P. R. Slater, Chem. Mater., 2010, 22, 675–690 CrossRef CAS
.
- J. A. Kilner and M. Burriel, Annu. Rev. Mater. Res., 2014, 44, 365–393 CrossRef CAS
.
- S. J. Benson, R. J. Chanter and J. A. Kilner, Proceedings of the Third International Symposium on Ionic and Mixed Conducting Ceramics, Paris, France, 1997 Search PubMed.
- V. Thoréton, M. Niania, J. Druce, H. Tellez and J. A. Kilner, J. Electrochem. Soc., 2022, 169, 044513 CrossRef
.
- V. Metlenko, A. H. H. Ramadan, F. Gunkel, H. Du, H. Schraknepper, S. Hoffmann-Eifert, R. Dittmann, R. Waser and R. A. De Souza, Nanoscale, 2014, 6, 12864–12876 RSC
.
- R. A. De Souza, J. Mater. Chem. A, 2017, 5, 20334–20350 RSC
.
- J. M. Polfus, B. Yildiz and H. L. Tuller, Phys. Chem. Chem. Phys., 2018, 20, 19142–19150 RSC
.
- J. P. Parras, G. Feldmann and R. A. De Souza, J. Am. Ceram. Soc., 2021, 104, 5946–5954 CrossRef CAS
.
- T. Ishigaki, S. Yamauchi, J. Mizusaki, K. Fueki, H. Naito and T. Adachi, J. Solid State Chem., 1984, 55, 50–53 CrossRef CAS
.
- T. Ishigaki, S. Yamauchi, K. Kishio, J. Mizusaki and K. Fueki, J. Solid State Chem., 1988, 73, 179–187 CrossRef CAS
.
- J. Mizusaki, I. Yasuda, J. Shimoyama, S. Yamauchi and K. Fueki, J. Electrochem. Soc., 1993, 140, 467–471 CrossRef CAS
.
- D. Bayraktar, S. Diethelm, P. Holtappels, T. Graule and J. Van Herle, J. Solid State Electrochem., 2006, 10, 589–596 CrossRef CAS
.
- M. Søgaard, P. Vang Hendriksen and M. Mogensen, J. Solid State Chem., 2007, 180, 1489–1503 CrossRef
.
- H. Kishimoto, N. Sakai, T. Horita, K. Yamaji, M. Brito and H. Yokokawa, Solid State Ionics, 2007, 178, 1317–1325 CrossRef CAS
.
- I. Wærnhus, T. Grande and K. Wiik, Top. Catal., 2011, 54, 1009–1015 CrossRef
.
- M. Islam, M. Cherry and C. Catlow, J. Solid State Chem., 1996, 124, 230–237 CrossRef CAS
.
- A. Jones and M. S. Islam, J. Phys. Chem. C, 2008, 112, 4455–4462 CrossRef CAS
.
- A. M. Ritzmann, A. B. Muñoz-García, M. Pavone, J. A. Keith and E. A. Carter, Chem. Mater., 2013, 25, 3011–3019 CrossRef CAS
.
- A. M. Ritzmann, A. B. Muñoz-García, M. Pavone, J. A. Keith and E. A. Carter, MRS Commun., 2013, 3, 161–166 CrossRef CAS
.
- Y. A. Mastrikov, R. Merkle, E. A. Kotomin, M. M. Kuklja and J. Maier, Phys. Chem. Chem. Phys., 2013, 15, 911–918 RSC
.
- F. H. Taylor, J. Buckeridge and C. R. A. Catlow, Chem. Mater., 2016, 28, 8210–8220 CrossRef CAS
.
- J. A. Santana, J. T. Krogel, P. R. C. Kent and F. A. Reboredo, J. Chem. Phys., 2017, 147, 034701 CrossRef PubMed
.
- T. Das, J. D. Nicholas and Y. Qi, ECS Trans., 2017, 78, 2807–2814 CrossRef CAS
.
- T. Das, J. D. Nicholas and Y. Qi, Phys. Chem. Chem. Phys., 2020, 22, 9723–9733 RSC
.
- Y.-S. Zheng, M. Zhang, Q. Li, Y.-A. Zhu, Z.-J. Sui, D. Chen and X.-G. Zhou, J. Phys. Chem. C, 2019, 123, 275–290 CrossRef CAS
.
- J. M. Börgers and R. A. De Souza, Phys. Chem. Chem. Phys., 2020, 22, 14329–14339 RSC
.
- M. Cherry, M. Islam and C. Catlow, J. Solid State Chem., 1995, 118, 125–132 CrossRef CAS
.
- S. Plimpton, J. Comput. Phys., 1995, 117, 1–19 CrossRef CAS
.
- A. P. Thompson, H. M. Aktulga, R. Berger, D. S. Bolintineanu, W. M. Brown, P. S. Crozier, P. J. in't Veld, A. Kohlmeyer, S. G. Moore, T. D. Nguyen, R. Shan, M. J. Stevens, J. Tranchida, C. Trott and S. J. Plimpton, Comput. Phys. Commun., 2022, 271, 108171 CrossRef CAS
.
- L. Verlet, Phys. Rev., 1967, 159, 98–103 CrossRef CAS
.
- S. Nosé, J. Chem. Phys., 1984, 81, 511–519 CrossRef
.
- W. G. Hoover, Phys. Rev. A: At., Mol., Opt. Phys., 1985, 31, 1695–1697 CrossRef PubMed
.
- P. Hirel, Comput. Phys. Commun., 2015, 197, 212–219 CrossRef CAS
.
- H. Zhang, A. H. H. Ramadan and R. A. De Souza, J. Mater. Chem. A, 2018, 6, 9116–9123 RSC
.
- H. J. Heelweg and R. A. De Souza, Phys. Rev. Mater., 2021, 5, 013804 CrossRef CAS
.
- N. Metropolis, A. W. Rosenbluth, M. N. Rosenbluth, A. H. Teller and E. Teller, J. Chem. Phys., 1953, 21, 1087–1092 CrossRef CAS
.
- M. Wagih and C. A. Schuh, Acta Mater., 2019, 181, 228–237 CrossRef CAS
.
- J. A. Purton, Phys. Chem. Chem. Phys., 2019, 21, 9802–9809 RSC
.
- K. Govers and M. Verwerft, J. Nucl. Mater., 2013, 438, 134–143 CrossRef CAS
.
- J. A. Dawson, P. Canepa, M. J. Clarke, T. Famprikis, D. Ghosh and M. S. Islam, Chem. Mater., 2019, 31, 5296–5304 CrossRef CAS
.
- J. D. Honeycutt and H. C. Andersen, J. Phys. Chem., 1987, 91, 4950–4963 CrossRef CAS
.
- D. Faken and H. Jónsson, Comput. Mater. Sci., 1994, 2, 279–286 CrossRef CAS
.
- A. Stukowski, Modell. Simul. Mater. Sci. Eng., 2012, 20, 045021 CrossRef
.
- P. M. Larsen, S. Schmidt and J. Schiøtz, Modell. Simul. Mater. Sci. Eng., 2016, 24, 055007 CrossRef
.
- A. Stukowski, Modell. Simul. Mater. Sci. Eng., 2010, 18, 015012 CrossRef
.
- S. M. Selbach, J. R. Tolchard, A. Fossdal and T. Grande, J. Solid State Chem., 2012, 196, 249–254 CrossRef CAS
.
- A. Fossdal, M. Menon, I. Waernhus, K. Wiik, M.-A. Einarsrud and T. Grande, J. Am. Ceram. Soc., 2005, 87, 1952–1958 CrossRef
.
- A. L. Usler, D. Kemp, A. Bonkowski and R. A. De Souza, J. Comput. Chem., 2023, 44, 1347–1359 CrossRef CAS PubMed
.
- J. E. ten Elshof, M. H. R. Lankhorst and H. J. M. Bouwmeester, J. Electrochem. Soc., 1997, 144, 1060–1067 CrossRef
.
- E. Robens, R. Rauschen, J. Kaub, J. P. Parras, D. Kemp, C. L. Freeman and R. A. De Souza, J. Mater. Chem. A, 2022, 10, 2388–2397 RSC
.
- R. De Souza, J. Kilner and J. Walker, Mater. Lett., 2000, 43, 43–52 CrossRef CAS
.
- E. Navickas, T. M. Huber, Y. Chen, W. Hetaba, G. Holzlechner, G. Rupp, M. Stöger-Pollach, G. Friedbacher, H. Hutter, B. Yildiz and J. Fleig, Phys. Chem. Chem. Phys., 2015, 17, 7659–7669 RSC
.
- A. M. Saranya, D. Pla, A. Morata, A. Cavallaro, J. Canales-Vázquez, J. A. Kilner, M. Burriel and A. Tarancón, Adv. Energy Mater., 2015, 5, 1500377 CrossRef
.
- J. M. Börgers, J. Kler, K. Ran, E. Larenz, T. E. Weirich, R. Dittmann and R. A. De Souza, Adv. Funct. Mater., 2021, 2105647 CrossRef
.
- B. Tofield and W. Scott, J. Solid State Chem., 1974, 10, 183–194 CrossRef CAS
.
- J. Mizusaki, H. Tagawa, K. Naraya and T. Sasamoto, Solid State Ionics, 1991, 49, 111–118 CrossRef CAS
.
- J. Mizusaki, N. Mori, H. Takai, Y. Yonemura, H. Minamiue, H. Tagawa, M. Dokiya, H. Inaba, K. Naraya, T. Sasamoto and T. Hashimoto, Solid State Ionics, 2000, 129, 163–177 CrossRef CAS
.
- F. W. Poulsen, Solid State Ionics, 2000, 129, 145–162 CrossRef CAS
.
- D. S. Mebane, Y. Liu and M. Liu, Solid State Ionics, 2008, 178, 1950–1957 CrossRef CAS
.
- Y.-L. Lee and D. Morgan, Phys. Chem. Chem. Phys., 2012, 14, 290–302 RSC
.
- J. P. Parras and R. A. De Souza, Acta Mater., 2020, 195, 383–391 CrossRef CAS
.
Footnote |
| † Electronic supplementary information (ESI) available. See DOI: https://doi.org/10.1039/d3lf00263b |
| This journal is © The Royal Society of Chemistry 2024 |

