 Open Access Article
Creative Commons Attribution 3.0 Unported Licence
Structuring biogenic synthesis of rare phase LaMn2O5 using the Bauhinia variegata (Kachnar) flower extract for highly sensitive, long range electrochemical detection of bisphenol-A, an endocrine disruptor†
Ankur
Srivastava
,
Kshitij RB
Singh
 ,
Mrituanjay D.
Pandey
 * and
Jay
Singh
 *
*
Department of Chemistry, Institute of Science, Banaras Hindu University, Varanasi-221005, Uttar Pradesh, India. E-mail: mdpandey.chem@bhu.ac.in; jaysingh.chem@bhu.ac.in; Tel: +91-9871766453
First published on 23rd November 2023
Abstract
This work presents the in situ biogenic synthesis of rare phase nanostructure LaMn2O5 by the hydrothermal method, using the Bauhinia variegata (Kachnar) extract to prevent the discharge of hazardous and toxic waste elements into the environment. In this study, the compound exhibits strong Mn-3p and O-2p interactions, closely associated with vacant La-4f orbitals resulting in strong covalent bonding. Moreover, the synergetic effect of the f–d block metals effectively facilitates electron transfer. In this work, biologically derived, rare phase LaMn2O5 was also fabricated as a bioelectrode and developed into an electrochemical sensor. The estimated biosensor was assessed across a wide range of analyte concentrations for detecting the plastic monomer and endocrine disruptor bisphenol-A (BPA). A three-step linear response was observed, spanning from 0.001 μM to 0.1 μM, 1.0 μM to 40 μM and 40 μM to 1000.0 μM with a limit of detection (LOD) value of 2.85 × 10⁻³ μM and negligible interference. The sensitivity was obtained to be 3.67 mA μM−1 cm−2. Cyclic voltammetry (CV), pH, and scan rate studies were also performed for the prepared nanomaterials. From the scan rate study, the diffusion coefficient (D), charge transfer rate (Ks), and surface concentration (γ) were calculated which were found to be appreciable. The synthesized rare phase nanostructure LaMn2O5 exhibited a response time of 30 seconds, 60 days long stability, and 13 times reusability. This study reveals the biogenic synthesis of rare phase nanostructure LaMn2O5. This innovative method has the potential to harness natural resources for the synthesis of distinct nanomaterials. The rare phase nanostructure LaMn2O5 appears to be highly susceptible, in the long-range detection of BPA.
1. Introduction
Manganese is the second most abundant transition metal on the Earth's crust and has been utilized as a vital element in steel production, glass making, and desulfurization since the mid-19th century. It is an essential micronutrient for the survival of many organisms living on the Earth's surface.1,2 Moreover, the potentials of the manganese oxides have been utilized in various field like, optical, electrical, and as a contrast agent for magnetic resonance imaging.3 The other derivatives of manganese oxides like Mn2O3 and Mn3O4 have been employed in supercapacitors due to their physiochemical stability, non-toxic nature, and flexibility.4 Manganese oxides have also been utilized in electrochemical biosensing5 and energy storage.6However, the combination of lanthanides has been reported with the s-block and d-block elements, such as potassium7 and gold metal,8 and fabricated for the electrochemical detection of dopamine. Previous literature also explored the use of lanthanide–manganese-based nanomaterials in various fields. Nickel and iron-doped lanthanum manganese oxide has been utilized for biohydrogen production9 and lanthanum has been utilized with Mn-ferrite for magnetic study.10 Tao Chen et al. reported carbon SmMn2O5 nanomaterials for the catalytic oxidation of nitric oxide11 and Z. Y. Zhao et al. reported dysprosium-based manganese oxide, DyMn2O5, for electric polarization, magnetic field, and temperature function purposes.12 Pressure-dependent X-ray diffraction studies have been carried out for RMn2O5 (R = Gd, Pr, and Sm).13 In this way Yan Chen et al. reported the study of the magnetic properties of RMn2O5 (R = La, Pr, Nd, Tb, Bi).14 Moreover, lanthanum-doped manganese dioxide has shown potential for breast cancer therapy15 but there are limited research articles available for biosensing applications based on this nanostructure. However, if we focused on the synthesis procedure, nonetheless, most of the previous works have employed chemical routes which produce toxic and hazardous chemicals and create unhealthy environments. A biogenic route is a safe way to avoid toxic and harmful chemicals, reagents,16 capping agents, and surfactants.17 In this way the we found that Bauhinia variegata (Kachnar) contains 24 types of terpenoids and sesquiterpenoids such as α-pinene, β-pinene, δ-cadinine and γ-elemene, which can be utilized in the reaction as a reducing agent and capping agent.18
This work reports the synthesis of biogenic rare-phase nanostructure LaMn2O5 using the in situ hydrothermal method, where the Bauhinia variegata (Kachnar) extract was employed as a reducing agent, capping agent, and surfactant. To the best of our knowledge and based on reported literature, no research work is available on the one-step biogenic synthesis of LaMn2O5 materials and its enzymatic fabrication in the form of a Tyr/LaMn2O5/ITO bioelectrode. This electrode functions as a biosensor for the long-range detection of endocrine disruptor bisphenol-A (2,2-bis(4-hydroxyphenyl)propane) (BPA), which was first reported in 1891 by Dianin,19 responsible for the growth of cancerous cells in mammals. The proposed electrochemical biosensor serves as an optimistic window for the fabrication of a low-cost, easy-to-handle, efficient, and sensitive electrode for BPA detection. The highly selective electrochemical estimation was carried out for the long-range detection of BPA, in the detection range of 0.001–1000 μM including three linear range intervals. Appreciable linear regression coefficients (R2) were obtained (0.9757, 0.9923, and 0.9781). The sensor was found to have 60 days long stability, 30 seconds quick response time, high sensitivity, and an effective limit of detection (LOD) value, which has great potential to be developed as an electrochemical device in the future.
2. Experimental
2.1. Materials and method
Potassium hexacyanoferrate(III) (K3[Fe(CN)6]; MW: 329.25 g mol−1; product cat no: 1.93667.0521), potassium hexacyanoferrate(II) trihydrate (K4[Fe(CN)6]·3H2O; MW: 422.39 g mol−1; product cat no. 1.93686.0521), sodium chloride (NaCl; MW: 58.44 g mol−1; product cat no. S9888), ammonia liquor (NH3; MW: 17.03 g mol−1; CAS no. Q16225) were obtained from Qualigens, Thermo Fisher Scientific. Whatman filter paper grade-1 was obtained from Sigma-Aldrich. Monosodium phosphate (NaH2PO4; MW: 119.98 g mol−1; CAS no. 7558-80-7) and disodium phosphate (Na2HPO4·H2O; MW: 177.99 g mol−1; CAS no. 10028-24-7)were procured from Himedia. Lanthanum nitrate hexahydrate was procured from SRL and manganese nitrate tetrahydrate from Sigma Aldrich. Bisphenol-A (C15H16O2; MW: 228.29 g mol−1; CAS no. 80-05-7) was obtained from Sigma-Aldrich. Uric acid (C5H4N4O3; MW: 168.1103 g mol−1; CAS no. 69-93-2) from Sigma Aldrich. Urea (CON2H4; MW: 60.06 g mol−1; CAS no. 57-13-6), DL-lactic acid (C3H6O3; MW: 90.08 g mol−1, CAS no. 50-21-5) was from Merck. Glutamic acid (C5H9NO4; MW: 147.13 g mol−1; CAS no. 56-86-0) was from Sigma Aldrich. Glucose (C6H12O6; MW: 180.15 g mol−1; CAS no. 50-99-7) was from SDFCL. L-Ascorbic acid (C6H8O6; MW: 176.12 g mol−1; CAS no. 50-81-7) was from Sigma Aldrich. Resorcinol (C6H4(OH)2; MW: 110.11 g mol−1; CAS no. 108-46-3) was from Fisher Scientific. 2-Aminophenol (C6H7NO; MW: 109.13 g mol−1; CAS no. 95-55-6), 4-aminophenol (MW: 109.13 g mol−1; CAS no. 123-30-8) were from Avra Synthesis Pvt. Ltd. Hydroquinone (C6H4(OH)2; MW: 110.11 g mol−1: CAS no. 123-31-9) was from Fisher Scientific. 2-Nitrophenol (C6H5NO3; MW: 139.11 g mol−1; CAS no. 88-75-5) was from Sigma-Aldrich. Bauhinia variegata (Kachnar) was obtained from the garden of the department. All the chemicals used in the experiments were of analytical grade and used without further purification. The ITO sheets having a surface resistivity of 20 Ω sq−1 were obtained from Sigma-Aldrich. Hydrogen peroxide (MW: 34 nmol−1; product cat no. 1.93007.0521). Milli-Q water (18 U resistivity; Millipore, USA) was used in all the experimental works.2.2. Preparation of the Bauhinia variegata (Kachnar) extract
To prepare the Kachnar extract, 20 mg of flowers were thoroughly washed with double distilled water and then air dried for two days. The dried flowers were added to 180 mL of water, maintaining the ratio of 10![[thin space (1/6-em)]](https://www.rsc.org/images/entities/char_2009.gif) :
:![[thin space (1/6-em)]](https://www.rsc.org/images/entities/char_2009.gif) 90 in a total volume of 200 mL of water. The mixture was boiled at 60 °C for 30 minutes and subsequently filtered using Whatman filter paper. Finally, the filtered solution was allowed to cool for approximately 35 minutes and stored for further reaction.
90 in a total volume of 200 mL of water. The mixture was boiled at 60 °C for 30 minutes and subsequently filtered using Whatman filter paper. Finally, the filtered solution was allowed to cool for approximately 35 minutes and stored for further reaction.
2.3. Preparation of the rare phase LaMn2O5 nanostructure
To synthesize the rare phase nanostructure LaMn2O5 a 20 mL solution of 0.1 M La(NO3)·6H2O (pH = 5) was mixed with a 20 mL solution of 0.05 M Mn(SO4). H2O (pH = 6). Further, a 5 M NaOH solution was added to make the solution basic and the pH was adjusted to approximately 12. Subsequently, 20 mL of the previously prepared Bauhinia variegata (Kachnar) extract was added to the above solution, transferred to the Teflon hydrothermal autoclave, placed inside the muffle furnace, and heated to 180 °C for 24 hours. After the reaction was complete, it was allowed to cool and the compound was washed 3–4 times with Milli-Q water and a 20% water–ethanol mixture. The compound was collected by centrifugation at 10![[thin space (1/6-em)]](https://www.rsc.org/images/entities/char_2009.gif) 000 rpm and dried in a vacuum oven at 60 °C until further characterization. The reaction involved in this process is shown in eqn (1):
000 rpm and dried in a vacuum oven at 60 °C until further characterization. The reaction involved in this process is shown in eqn (1): | (1) |
2.4. Fabrication of the Tyr/LaMn2O5/ITO bioelectrode
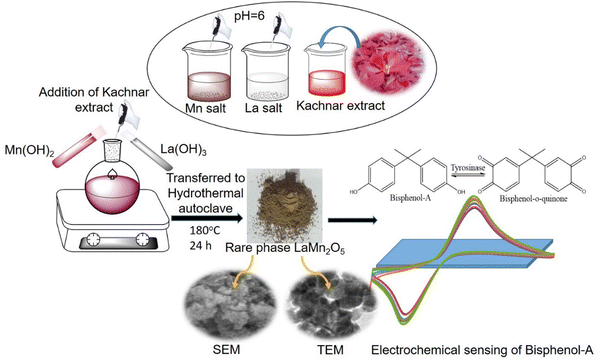
The prepared electrode was fabricated using the drop-casting method and converted into a bioelectrode. To do this, a solution of tyrosinase enzyme from Agaricus bisporus with an activity of 1000 U mg−1 was used. The solution had a concentration of 1 mg mL−1 of PBS solution, pH 6.5. Further, 10 μL of the tyrosinase enzyme solution was allowed to uniformly spread onto the ITO surface (surface area of 0.25 cm2), which was then placed at 4 °Covernight to ensure proper binding of the enzyme on the ITO surface. Fig. 1 shows a schematic representation of the preparation of rare phase nanostructure LaMn2O5.3. Results and discussion
3.1. Structural characterization
 | (2) |
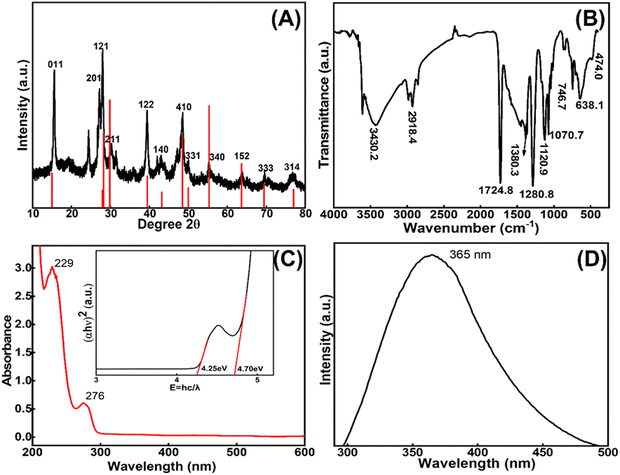
![[double bond, length as m-dash]](https://www.rsc.org/images/entities/char_e001.gif) O, Mn–O–Mn, and La–O bonds (Fig. 2(C)). The UV graph plot between (αhν)2 and E = hc/λ revealed two binding energy values at 4.25 and 4.70 eV, as shown in Fig. 2(C, inset). These values indicate the presence of two different bonding environments in LaMn2O5. Additionally, to reveal the fluorescence properties of the compound emission spectra were recorded using a Horriba Fluoromax spectrophotometer. A strong peak observed at 365 nm suggests that the rare phase LaMn2O5 compound is highly fluorescent as depicted in Fig. 2(D).
O, Mn–O–Mn, and La–O bonds (Fig. 2(C)). The UV graph plot between (αhν)2 and E = hc/λ revealed two binding energy values at 4.25 and 4.70 eV, as shown in Fig. 2(C, inset). These values indicate the presence of two different bonding environments in LaMn2O5. Additionally, to reveal the fluorescence properties of the compound emission spectra were recorded using a Horriba Fluoromax spectrophotometer. A strong peak observed at 365 nm suggests that the rare phase LaMn2O5 compound is highly fluorescent as depicted in Fig. 2(D).
3.2. Morphological analysis
| Rms-Rq (nm) | R a (nm) | Max. area peak height (nm) | |
|---|---|---|---|
| LaMn2O5/ITO | 4.39 | 3.39 | 19.65 |
| Tyr/LaMnO5/ITO | 0.336 | 0.260 | 1.70 |
It was observed that the Rms-Rq, Ra and maximum area peak height values were found to be higher for enzyme deposited compounds as compared to compounds without enzyme deposition. This is because the enzymatic functional group may provide higher roughness and height, which is an indication of appreciable interaction between the materials and enzymes (Fig. 4(A and B)). Moreover, the average roughness (Ra) was found to be about 12 times higher than that of the enzymatic compound, indicating an increased surface area of the electrode. Moreover, the morphological arrangement for LaMn2O5/ITO was found to be uniform with spherical-shaped particles. The morphological arrangements for the Tyr/La2MnO5/ITO bioelectrode are shown in Fig. 4(C and D).
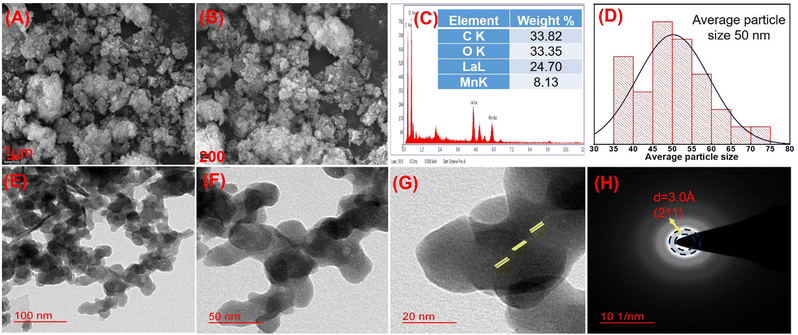
Transmittance electron microscopy (TEM) also revealed the morphology of the materials analyzed (FEI Company of USA (S.E.A.) PTE, LTD, model name: Tecnai G220 TWIN). In the TEM image, spherical morphology appeared at scales of 100 and 50 nm, as shown in Fig. 5(E and F). From the TEM images it was also observed that the lanthanum and manganese particles were intermixed with each other in such a way as to form uniformly distributed arrangements. The HR-TEM images in Fig. 5(G) show the fringes corresponding to the (211) hkl plane and the SAED pattern in Fig. 5H shows the crystalline nature of the compound, with a d-spacing of 3.0 Å, which is also associated with the (211) plane corresponding to powder XRD data.
4. Electrochemical study
4.1. pH optimization
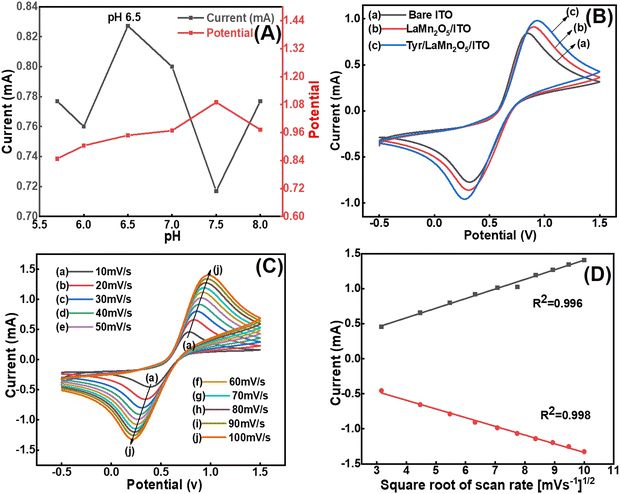
The appropriate current response for cyclic voltammety (CV) can be obtained at a specific pH for a particular compound. The graph of the pH study is shown between the oxidative peak current (Ipa) vs. pH and potential vs. pH in Fig. 6(A). To analyse the optimum pH, the CV response of the Tyr/LaMn2O5/ITO bioelectrode was optimized at various pH values (5.7–8.0). The optimum Ipa value was found to be 0.8273 mA at pH 6.5, which was obtained in a 50 mM phosphate buffer saline (PBS) solution with 0.9% NaCl and 5 mM [Fe(CN)6]3−/4−, and the scan rate was 50 mV s−1. The pH graph reveals that the optimum and minimum Ipa values at pH 6.5 and 7.5 were found to be 0.8273 and 0.7170 mA respectively. It is clear from the pH graph that the Ipa values and their corresponding potentials were observed selectively at pH values 5.7, 6.0, 6.5, 7.0, 7.5, and 8.0. Moreover, the Ipa response was found to be maximum at pH 6.5, and therefore, this pH was used throughout the experiments.4.2. Cyclic voltammetric (CV) study
CV was performed for the rare phase Tyr/LaMn2O5/ITO bioelectrode for the electrochemical estimation of the prepared electrode as compared to the bare electrode. The Ipa value for bare ITO was taken as a reference and was 0.8382 mA, considered as 100%; the Ipa for the LaMnO5/ITO bioelectrode was 0.9098 mA, which was found to be 8.54% higher than that of bare ITO. However, after immobilization of the tyrosinase enzyme, the Ipa increased to 0.9794 mA which was found to be 16.84% higher as compared to bare ITO (Fig. 6(B)). The differential pulse voltammetry response of the electrodes demonstrated similar findings in PBS solution compared to CV (Fig. S1, ESI†).The CV study reveals that as the complexity of the electrodes increases a slight increase in the potential compared to ITO was observed. This shift is due to the slight hindrance between the electrode and [Fe(CN)6]3−/4−.27 The two important factors responsible for producing electrical conductivity are enzymatic and metallic behaviour. The Cu metal of the tyrosinase enzyme functions as a catalyst and increases the oxido-reductive process during the reaction where the active centre of the dinuclear copper present in the tyrosinase enzyme catalyses the conversion of phenol to orthoquinone.28
4.3. Scan rate and kinetics study
The rare phase nanostructure LaMn2O5 was used to analyze interfacial kinetics at different scan rates varying from 10 to 100 mV s−1 with the prepared Tyr/LaMn2O5/ITO bioelectrode (Fig. 6(C)). The linearly increasing and decreasing patterns of Ipa and Ipc values were obtained by increasing the scan rate. Further, the study reveals that the shift in the Ipa value towards a more positive and Ipc towards a more negative value was observed, which is suggested to be a quasi-reversible process in the redox behaviour. Moreover, from the plot of the current vs. square root of the scan rate [mV s−1]1/2, Fig. 6(D), an apparent linear increment in the Ipa and Ipc values was observed with a linear regression coefficient (R2) value of 0.99 for both the anodic and cathodic peaks respectively.Moreover, the charge transfer rate constant (Ks) value obtained by the surface modification of the prepared rare phase Tyr/LaMn2O5/ITO bioelectrode was calculated using eqn (3),
| Ks = mnFν/RT | (3) |
![[thin space (1/6-em)]](https://www.rsc.org/images/entities/char_2009.gif) 485 C mol−1); R is the gas constant (8.314 J mol−1K−1); m is the separation of the peak-to-peak (V); n =1 is the number of electrons transferred during the reaction 1; T is the room temperature (300 K); and ν is the scan rate (50 mV s−1). Ks was found to be 1.23 s−1, which shows the appreciable catalytic activity of the prepared materials. The potential shift [(ΔEp= Epa(anodic peak) − Epc(cathodic peak))] value provided the linear relationship obtained with respect to the scan rate and shows that the reaction performed between the tyrosinase and Tyr/LaMn2O5/ITO electrode was a diffusion-controlled process. Further, the value of the diffusion coefficient was found for the Tyr/LaMn2O5/ITO bioelectrode applying the Randles–Sevcik equation (eqn (4)):
485 C mol−1); R is the gas constant (8.314 J mol−1K−1); m is the separation of the peak-to-peak (V); n =1 is the number of electrons transferred during the reaction 1; T is the room temperature (300 K); and ν is the scan rate (50 mV s−1). Ks was found to be 1.23 s−1, which shows the appreciable catalytic activity of the prepared materials. The potential shift [(ΔEp= Epa(anodic peak) − Epc(cathodic peak))] value provided the linear relationship obtained with respect to the scan rate and shows that the reaction performed between the tyrosinase and Tyr/LaMn2O5/ITO electrode was a diffusion-controlled process. Further, the value of the diffusion coefficient was found for the Tyr/LaMn2O5/ITO bioelectrode applying the Randles–Sevcik equation (eqn (4)):| Ip = (2.69 × 10⁵)n3/2AD1/2Cν1/2 | (4) |
| Ip = n2F2γAV/4RT | (5) |
4.4. Electrochemical response study of the fabricated Tyr/LaMn2O5/ITO bioelectrode for bisphenol detection
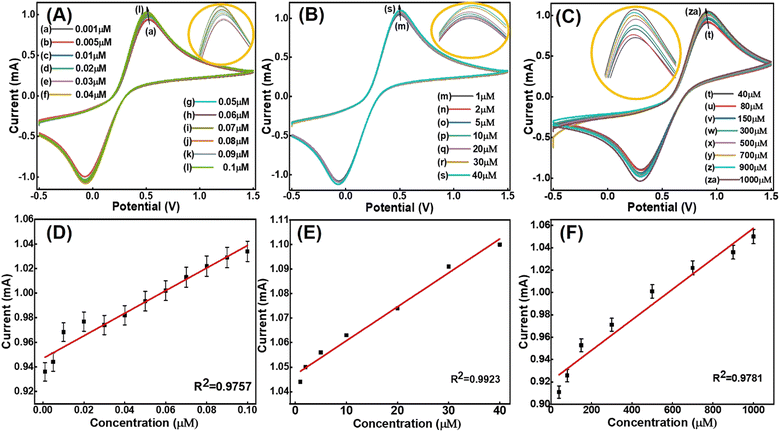
The sensing behaviour of the fabricated bioelectrode is related to its electrochemical oxidation capability with the target analyte. For this purpose, the rare earth metals lanthanum and manganese were utilized. The combination of a completely vacant f orbital containing lanthanum and a filled d orbital containing manganese provided a good electrochemical response. The inherent material properties of rare phase nanostructure LaMn2O5 provide high conductivity and the fabricated tyrosinase enzyme reinforces the electrocatalytic activity of BPA.29Long-range electrochemical detection of BPA was carried out using the CV technique. The Tyr/LaMn2O5/ITO bioelectrode was analysed in a PBS solution with a scan rate of 50 mV s−1. A three-sensing curve was obtained with the long-range analyte from 0.001 μM to 1000 μM (Fig. 8(A–C)). A three-calibration curve was obtained in these experiments for concentrations ranging from 0.001 μM to 1000 μM, as shown in Fig. 7(D–F). The linear regression equations are
| Ip (mA) = 9.1 × 10⁻¹ + C (μM) + 0.94 (R2 = 0.9757) [0.001–0.1 μM] | (6) |
| Ip (mA) = 1.39 × 10⁻³ + C (μM) + 0.92 (R2 = 0.9923) [1–40 μM] | (7) |
| Ip (mA) = 1.36 × 10⁻⁴ + C (μM) + 0.92 (R2 = 0.9781) [40–1000 μM] | (8) |
| Ip (mA) = 0.96 + C (μM) + 0.94 (R2 = 0.9994), [0.001–0.1 μM] | (9) |
| S. no. | Electrode | Method | Linearity (μM) | LOD (μM) | Ref. |
|---|---|---|---|---|---|
| 1 | MIPs MNPs/CTAB/CPE | CV | 0.6–100 | 0.1 | 31 |
| 2 | GOMWCNT-βCD/SPE | LSV | 0.05–30 | 6 × 10⁻³ | 32 |
| 3 | 1T&2H-MoS2/CNTs-NH2 | CV | 0.01–70 | 8.6 × 10⁻³ | 33 |
| 4 | Fe–Cu-BTC/AuNPs/GCE | DPV | 0.1–18 | 18 × 10−3 | 34 |
| 5 | CB/f-MWCNTs | CV | 0.1–130 | 0.08 | 35 |
| 6 | SWCNT/GCE | CV | 10–100 | 7.3 | 36 |
| 7 | NFO/SPCE | DPV | 0.02–12.5 | 6 × 10⁻³ | 37 |
| 8 | Tyr/LaMn2O5/ITO | CV | 0.001–1000 | 2.85 × 10⁻³ | Present work |
4.5. Selectivity of the fabricated Tyr/LaMn2O5/ITO bioelectrode or the effect of interference
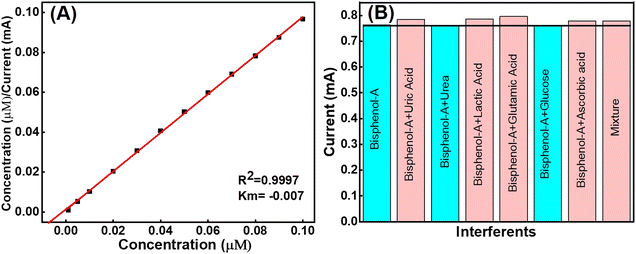
The selectivity of the rare Tyr/LaMn2O5/ITO bioelectrode was optimized to determine the effect of analytes with several interferents present in the human blood samples. For this, the CV was analyzed in the same PBS solution where uric acid (UA), urea, lactic acid (LA), glutamic acid (GA), glucose (Glu), ascorbic acid (AA) and the mixture (Mix) were taken as interferents. The study revealed that no interferents significantly interrupted the standard BPA analyte (Fig. 8(B)). The %RSD values for different analytes are shown in Table 3.| BPA with interfering substance (20 μM each) | Cathodic peak current (Ip; mA) | % RSD |
|---|---|---|
| BPA | 0.7629 | Standard |
| BPA-UA | 0.7840 | 2.76 |
| BPA-urea | 0.7622 | −0.10 |
| BPA-LA | 0.7863 | 3.06 |
| BPA-GA | 0.7959 | 4.32 |
| BPA-Glu | 0.7616 | −0.18 |
| BPA-AA | 0.7770 | 1.84 |
| BPA-Mix | 0.7785 | 2 |
Moreover, the selectivity analysis was carried out using a phenolic group containing compounds like 2-aminophenol, 2-nitrophenol, 4-aminophenol, and hydroquinone, resorcinol (Fig. S2 in ESI†). In this experiment, the concentration of each interferent solution was 50 μM and the concentration of BPA was 100 μM. The % RSD values for different analytes are given in Table S1 (ESI†).
The obtained results indicate very low to negligible interferents with various analytes because the enzyme tyrosinase provided more selectivity to the prepared compound. Thus, the prepared Tyr/LaMn2O5/ITO bioelectrode is found to be effective and selective for bisphenol-A.
4.6. Response time, reusability and stability of the fabricated Tyr/LaMn2O5/ITO bioelectrode
A response time study was carried out to determine the time period at which the electrode performed at high efficiency which was analysed from the CV measurement and experiments were performed in the PBS solution. The CV was performed from 0 to 40 second time intervals and it was observed that the oxidative current response was found to increase up to 10 seconds and then slightly decreased up to 20 seconds. However, on increasing the time interval, the optimum current was obtained at 30 seconds as shown in Fig. 9(A). Further, the current response was found to decrease with increasing time interval. Thus 30 seconds was found to be a more appropriate response time for the prepared electrode and was used throughout the experiments.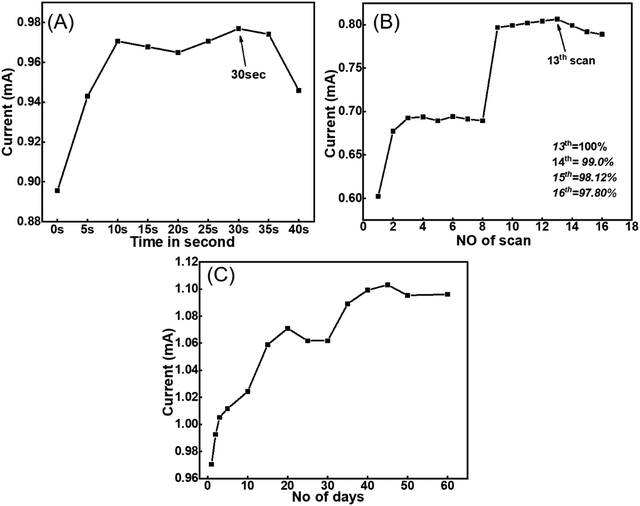 | ||
| Fig. 9 (A) The response time and (B) the reusability of the prepared Tyr/LaMn2O5/ITO bioelectrode. (C) The stability graph obtained for the rare phase Tyr/LaMn2O5/ITO bioelectrode. | ||
The reusability of the electrode was evaluated to determine the maximum possibility of repeating the electrode which was obtained in a similar phosphate buffer. CV was performed 16 times where at the 13th scan, the Ipa value was found to be optimum, considered as 100%. Further, at the 14th, 15th and 16th scans, the Ipa values were found to decrease to 99.0%, 98.12% and 97.80% respectively. Thus, the reusability of the prepared electrode was 13 days (Fig. 9(B)).
The stability of the prepared electrode was determined to obtain the current response for the maximum number of days. The CV was performed in PBS solution at the same scan rate for 0 to 60 days. The anodic peak current value was found to increase up to 20 days and then decrease up to 30 days. Further, the Ipa value was found to increase and remained constant for up to 60 days, as shown in Fig. 9(C). Thus, the prepared electrode was stable for 60 days.
5. Conclusion
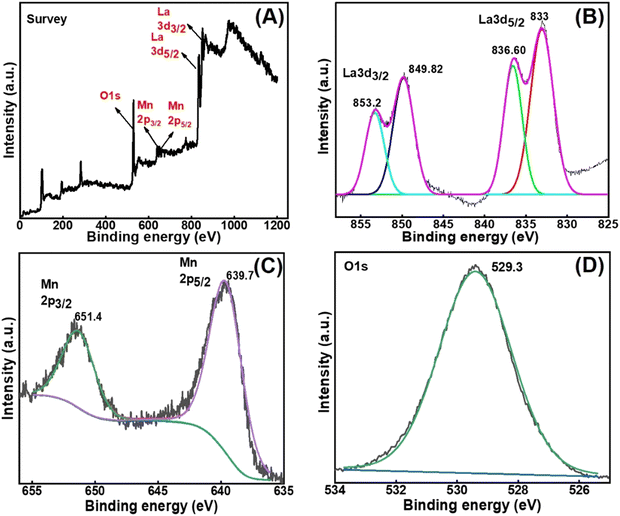
We have successfully synthesized the rare phase nanostructure LaMn2O5 using a biogenic method, with the Kachnar extract as a reducing agent. XRD provided the hkl values and an average crystallite size of approximately 14.45 nm. The FT-IR spectroscopy confirmed the characteristic peaks of La–O and Mn–O bonds, elemental oxidation states and electronic environments, which were further supported by XPS analysis. The optical spectra obtained were similar to those previously reported for the absorbance and emission spectra. AFM analysis revealed a uniform spherical morphology of the compounds. Morphological arrangements were obtained from SEM and TEM analyses and corresponded well with the AFM results. The HR-TEM images showed three distinct arrangements representing the different phases of the prepared compounds, as supported by the obtained fringes. The SEAD images confirmed the crystalline nature of the prepared rare phase nanostructure LaMn2O5, with an average particle size of approximately 50 nm. We also detected BPA, an endocrine disruptor, using the cyclic voltammetric method in the long concentration range of 0.001 μM to 1000 μM, spanning three distinct concentration ranges from 0.001 μM to 0.1 μM, 1.0 μM to 40 μM, and 40 μM to 1000 μM with R2 values of 0.9757, 0.9923, and 0.9781 respectively. The compound demonstrated a sensitivity of 3.67 mA μM−1 cm−2, and the LOD value was found to be 2.85 × 10⁻³ μM. The compound exhibited high selectivity for BPA with a negligible % RSD value for interferents. An excellent response time of 30 seconds was achieved, and the compound showed reusability for approximately 13 days with long-term stability for 60 days. Overall, we found that the biologically synthesized rare phase nanostructure LaMn2O5 is a good sensor for BPA detection and has great potential for device development in the future.Author contributions
A. S.: data curation, investigation, visualization, writing – original draft. K. R. B. S.: data curation, validation, visualization, writing – original draft. J. S. and M. D. P.: conceptualization, validation, project administration, supervision, writing – review & editing of the original draft.Conflicts of interest
The authors declare that they have no known competing financial interests or personal relationships that could have appeared to influence the work reported in this paper.Acknowledgements
This work received no specific grant from public, commercial, or not-for-profit funding agencies. The authors, A. S. and K. R. B. S., would like to express their gratitude to Banaras Hindu University (BHU), Varanasi, for providing the necessary facilities to conduct the research work. Additionally, the authors acknowledge the SATHI facility, located at Banaras Hindu University's CDC building, for providing XPS and TEM analysis. Furthermore, J. S. and M. D. P. would like to acknowledge BHU for providing a seed grant and incentive grant respectively under the MoE Govt India, Institute of Eminence (IoE) scheme 6031.References
- S. K. Ghosh, ACS Omega, 2020, 5, 25493–25504 CrossRef CAS.
- G. Charalampides and K. I. Vatalis, J. Geosci. Environ. Prot., 2015, 03, 66–73 Search PubMed.
- M. Mauri, V. Collico, L. Morelli, P. Das, I. García, J. Penaranda Avila, M. Bellini, R. Rotem, M. Truffi, F. Corsi, R. Simonutti, L. M. Liz-Marzán, M. Colombo and D. Prosperi, ACS Appl. Nano Mater., 2020, 3, 3787–3797 CrossRef CAS.
- Y.-H. Son, P. T. M. Bui, H.-R. Lee, M. S. Akhtar, D. K. Shah and O.-B. Yang, Coatings, 2019, 9, 631 CrossRef.
- Q. He, G. Li, X. Liu, J. Liu, P. Deng and D. Chen, Catalysts, 2018, 8, 323 CrossRef.
- C. M. Julien and A. Mauger, Nanomaterials, 2017, 7, 396 CrossRef PubMed.
- A. Srivastava, G. Mishra, K. R. Singh, J. Singh, R. Pandey and M. D. Pandey, Luminescence, 2023, 38(7), 1347–1357 CrossRef CAS.
- A. Srivastava, G. Mishra, J. Singh and M. D. Pandey, Mater. Lett., 2022, 308, 131231 CrossRef CAS.
- J. Ji, Z. Cai and L. Shen, Fuel, 2024, 357, 129974 CrossRef CAS.
- J. A. Chavarría-Rubio, D. A. Cortés-Hernández, A. M. Garay-Tapia and G. F. Hurtado-López, J. Magn. Magn. Mater., 2022, 553, 169253 CrossRef.
- T. Chen, X. Wang, S. Ma, X. Ma, Y. Zhang, L. Luo and Z. Yuan, Solid State Sci., 2020, 108, 106425 CrossRef CAS.
- Z. Y. Zhao, M. F. Liu, X. Li, L. Lin, Z. B. Yan, S. Dong and J.-M. Liu, Sci. Rep., 2014, 4, 3984 CrossRef CAS PubMed.
- W. Peng, V. Balédent, M.-B. Lepetit, A. Vaunat, E. Rebolini, M. Greenblatt and P. Foury-Leylekian, Acta Crystallogr., Sect. B: Struct. Sci., Cryst. Eng. Mater., 2019, 75, 687–696 CrossRef CAS.
- Y. Chen, H. Yuan, G. Tian, G. Zhang and S. Feng, J. Solid State Chem., 2007, 180, 1340–1346 CrossRef CAS.
- L. Ming, L. Song, J. Xu, R. Wang, J. Shi, M. Chen and Y. Zhang, ACS Appl. Mater. Interfaces, 2021, 13, 35444–35455 CrossRef CAS PubMed.
- S. Ahmed, M. Ahmad, B. L. Swami and S. Ikram, J. Adv. Res., 2016, 7, 17–28 CrossRef CAS.
- A. K. Sidhu, N. Verma and P. Kaushal, Front. Nanotechnol., 2022, 3, 801620 CrossRef.
- D. Sahoo, A. Ahmad, J. Ahmad and S. Tandon, J. Essent. Oil Bear. Plants, 2013, 16, 636–640 CrossRef CAS.
- L. N. Vandenberg, M. V. Maffini, C. Sonnenschein, B. S. Rubin and A. M. Soto, Endocr. Rev., 2009, 30, 75–95 CrossRef CAS.
- Z. Chen, R.-J. Xiao, C. Ma, Y.-B. Qin, H.-L. Shi, Z.-W. Wang, Y.-J. Song, Z. Wang, H.-F. Tian, H.-X. Yang and J.-Q. Li, Front. Phys., 2012, 7, 429–434 CrossRef.
- J. Singh, K. R. Singh, M. Kumar, R. Verma, R. Verma, P. Malik, S. Srivastava, R. P. Singh and D. Kumar, Mater. Adv., 2021, 2, 6665–6675 RSC.
- A. K. M. A. Ullah, M. M. Haque, M. Akter, A. Hossain, A. N. Tamanna, M. M. Hosen, A. K. M. F. Kibria, M. N. I. Khan and M. K. A. Khan, Mater. Res. Express, 2020, 7, 015088 CrossRef CAS.
- M. Ghiasi and A. Malekzadeh, Superlattices Microstruct., 2015, 77, 295–304 CrossRef CAS.
- S. Wu, M. Xie, Q. Zhang, L. Zhong, M. Chen and Z. Huang, Molecules, 2017, 22, 1117 CrossRef PubMed.
- J. Zhou, L. Shi, Q. Liu, H. Zhang, X. Liu, F. Han, Z. Guo, X. Lu and J. Wang, Part. Part. Syst. Charact., 2020, 37, 2000143 CrossRef CAS.
- X. Huang, P. Niu, M. Li, H. Liao and X. Shang, J. Wuhan Univ. Technol. Sci. Ed., 2018, 33, 23–29 CrossRef CAS.
- N. Jaiswal, C. M. Pandey, A. Soni, I. Tiwari, M. Rosillo-Lopez, C. G. Salzmann, B. D. Malhotra and G. Sumana, Sens. Actuators, B, 2018, 275, 312–321 CrossRef CAS.
- F. Ye, C. Feng, N. Fu, H. Wu, J. Jiang and S. Han, Appl. Surf. Sci., 2015, 357, 1251–1259 CrossRef CAS.
- A. Alsbaiee, B. J. Smith, L. Xiao, Y. Ling, D. E. Helbling and W. R. Dichtel, Nature, 2016, 529, 190–194 CrossRef CAS.
- Y. Matoba, S. Kihara, N. Bando, H. Yoshitsu, M. Sakaguchi, K. Kayama, S. Yanagisawa, T. Ogura and M. Sugiyama, PLoS Biol., 2018, 16, e3000077 CrossRef PubMed.
- L. Zhu, Y. Cao and G. Cao, Biosens. Bioelectron., 2014, 54, 258–261 CrossRef CAS PubMed.
- A. U. Alam and M. J. Deen, Anal. Chem., 2020, 92, 5532–5539 CrossRef CAS.
- L. Zhang, H. Tao, C. Ji, Q. Wu, X. Wang and Y. Wu, New J. Chem., 2022, 46, 8203–8214 RSC.
- M. B. Nguyen, N. H. Anh, V. Thi Thu, P. Thi Hai Yen, P. Hong Phong, L. Quoc Hung, N. T. T. Ngan, T. Q. Hai and V. Thi Thu Ha, RSC Adv., 2022, 12, 33825–33834 RSC.
- A. Thamilselvan, V. Rajagopal and V. Suryanarayanan, J. Alloys Compd., 2019, 786, 698–706 CrossRef CAS.
- P. Kanagavalli and S. Senthil Kumar, Electroanalysis, 2018, 30, 445–452 CrossRef CAS.
- G. Kesavan, N. Nataraj, S.-M. Chen and L.-H. Lin, New J. Chem., 2020, 44, 7698–7707 RSC.
Footnote |
| † Electronic supplementary information (ESI) available. See DOI: https://doi.org/10.1039/d3ma00790a |
| This journal is © The Royal Society of Chemistry 2024 |

