 Open Access Article
Direct observation of guanine photo-oxidation from new potential anticancer drugs via ultrafast electron transfer†
Alessio
Cesaretti
 a,
Giulia
Pantella
a,
Gianmarco
Reali
a,
Giuseppe
Consiglio
a,
Giulia
Pantella
a,
Gianmarco
Reali
a,
Giuseppe
Consiglio
 b,
Cosimo G.
Fortuna
b,
Fausto
Elisei
b,
Cosimo G.
Fortuna
b,
Fausto
Elisei
 a,
Anna
Spalletti
 a and
Benedetta
Carlotti
 *a
*a
aDepartment of Chemistry, Biology and Biotechnology and “Centro di Eccellenza Materiali Innovativi Nanostrutturati” (CEMIN), University of Perugia, Via Elce di Sotto 8, Perugia 06123, Italy. E-mail: benedetta.carlotti@unipg.it
bDepartment of Chemical Sciences, University of Catania, viale Andrea Doria 6, Catania 95125, Italy
First published on 27th August 2024
Abstract
In this study, we report an insight into the mechanism of interaction of three methyl-pyridinium derivatives with DNA and RNA, which intrigues us since the complexation is accompanied by a quite uncommon fluorescence quenching. A molecular mechanistic understanding was gained through the investigation of the photobehavior of these compounds in the presence of single nucleotides (ATP, CTP, GTP, and TTP) via advanced ultrafast spectroscopies. Our broadband fluorescence up-conversion results clearly highlighted the occurrence of a specific interaction with GTP, identified to be, through the femtosecond transient absorption experiments, an ultrafast electron transfer from guanine to methyl-pyridinium. Guanine photo-oxidation was directly observed in this work and interpreted to be at the root of photoinduced DNA and particularly RNA damage, and thus responsible for the toxicity exhibited by these new potential anticancer drugs toward tumor cells.
Introduction
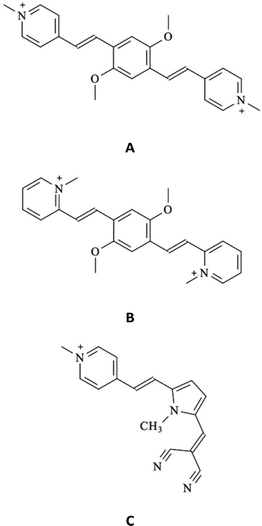
Understanding the mechanism and dynamics of photoinduced DNA and RNA damage is of crucial importance for the development of DNA-directed and RNA-directed phototherapies.1,2 Indeed, photosensitized DNA damage is a potentially important mechanism for photodynamic therapy (PDT), a low-invasive treatment for cancer and other skin diseases, particularly under low-oxygen conditions. In general, the most common PDT mechanism of light-induced damage of biomolecules proceeds through the generation of reactive oxygen species, such as a singlet oxygen, via energy transfer from a photosensitizer to molecular oxygen (type II mechanism).3 However, photoinduced electron transfer from biomolecules to photoexcited drugs (type I mechanism) is another important pathway that may lead to cell death.4–6 Guanine is the easiest to oxidize among the nucleic acid bases and therefore it is generally the principal target of DNA/RNA-directed therapeutic approaches.7–9 This specific interaction with guanine was proved to be at the root of the phototoxicity of several anticancer drugs, such as psoralen,10 doxorubicin,11 daunorubicin,12 and cis-platinum.13,14 The guanine radical cation is thought to be the initial intermediate in the oxidative cleavage of DNA. The extent of photosensitized nucleic acid oxidative stress is thus determined by the yield and rate of the electron transfer involving guanine. The ability to access the precise dynamics of this process and thus achieve a molecular mechanistic understanding of the drug–nucleic acid interaction greatly advanced through the use of time-resolved spectroscopies.7,15–18 The ultrafast dynamics of photoinduced charge transfer have also been thoroughly characterized in adenine and guanine-based dinucleotides and oligomers.19–21Our research interest in the last decade was devoted to investigating the capability of several methyl-pyridinium and methyl-quinolinium derivatives to strongly bind DNA using ultraviolet-visible absorption and fluorescence spectroscopies. These compounds often showed significant antiproliferative effects when internalized in tumor cells. Generally, a large fluorescence enhancement was observed upon DNA complexation, either via intercalation or groove binding.22–25 This photobehavior is consistent with reduced non-radiative deactivation to the ground state caused by the more restricted and rigid microenvironment of the nucleic acid complex compared to the free dye in solution.23,24 However, a few exceptions to this conventional behavior were observed and reported in some previous works of ours.26,27 In particular, the methyl pyridinium derivatives A, B, and C (whose molecular structures are shown in Chart 1) exhibited an apparent less common fluorescence quenching upon interaction not only with ct-DNA but also with t-RNA, as detailed in Fig. 1 and Fig. S1 (ESI†) for compounds A and B, respectively. The significant interaction of these molecules with RNA is particularly intriguing as the development of new RNA-targeted strategies for cancer treatment has become a hot topic in present research.28 Compounds A and B are push–pull molecules featuring symmetrical acceptor–donor–acceptor structures, which were proved, in a previous study, to undergo significant photoinduced intramolecular charge transfer and to show large two-photon absorption cross-sections coupled with high fluorescence quantum yields.29 These features, and particularly their possible biphotonic excitation, by allowing highly focused localization and improved penetration of the infrared radiation, make them potentially appealing as new fluorescent probes for bioimaging and also therapeutic applications.30 In the present investigation, we employed state-of-the-art ultrafast spectroscopies such as femtosecond transient absorption and broadband fluorescence up-conversion to unveil the molecular mechanism leading to the peculiar fluorescence quenching of these methyl pyridinium derivatives in the presence of DNA and RNA. In particular, the photobehaviour of compounds A–C was investigated in the presence of the nucleic acid building blocks (ATP, CTP, GTP, and TTP nucleotides) through advanced time-resolved spectroscopies to uncover the role played by specific interactions with the single nitrogenous bases.
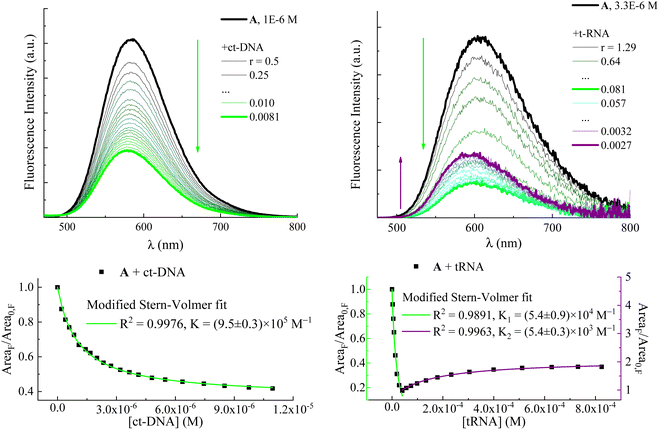 | ||
| Fig. 1 Upper panels: fluorimetric titrations of compound A with ct-DNA (left, taken from ref. 27) and t-RNA (right, taken from ref. 30). r is the ratio between drug and nucleic acid concentrations: r = [A]/[ct-DNA] or [tRNA]. Fluorescence intensity is corrected for the fraction of absorbed light. Arrows indicate the trend of the fluorescence intensity with decreasing r: green arrows show fluorescence quenching with increasing [ct-DNA] or [tRNA]; the purple arrow shows the subsequent fluorescence enhancement at high [tRNA]. Lower panels: fluorescence intensity in terms of emission spectrum areas of A as a function of ct-DNA and tRNA concentrations and its fitting according to a modified Stern–Volmer equation (eqn (1)). | ||
Results and discussion
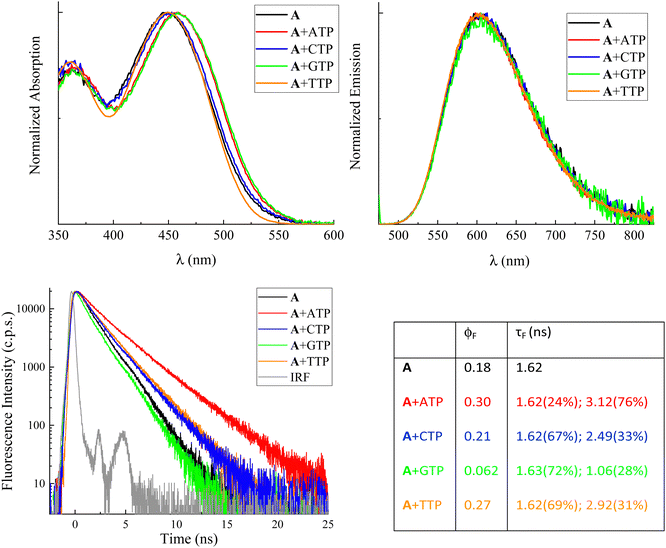
Fig. 2 shows the normalized steady-state absorption and emission spectra of compound A, alone in buffered aqueous solution at pH 7 and in the presence of a ca. 5 mM concentration of the four nucleotides. For the absorption spectra, very similar profiles were observed in the presence of CTP and TTP (blue and orange traces, respectively) relative to the one revealed for the free methyl-pyridinium dye (black trace). On the other hand, red-shifted absorption bands were recorded in the presence of ATP (red trace) and particularly GTP (green trace) compared to free compound A (black trace). For the emission spectra, no significant spectral shifts were revealed for the fluorophore in the presence of nucleotides relative to the free fluorophore in solution. The obtained results in terms of absorption and emission maxima are reported in Table S1 (ESI†) together with the values computed from these data for the Stokes shifts. It is noteworthy that the Stokes shifts for free compound A (5670 cm−1) and compound A in the presence of CTP (5520 cm−1) and TTP (5670 cm−1) are fairly similar while being significantly decreased in the presence of ATP (5280 cm−1) and GTP (5180 cm−1). Analogous effects of the nucleotides on the spectral properties were detected for the other compounds under investigation, B (Fig. S2 and Table S1, ESI†) and C (Fig. S9 and Table S7, ESI†). Our overall spectral results suggest that a stronger interaction takes place for compounds A–C with purine (adenine and guanine) relative to pyrimidine (cytosine and thymine) nitrogenous bases. When comparing the absorption and fluorescence excitation spectra, a rather good overlap was found for the free compounds A–C (see Fig. S3, S5 and S10, ESI†). However, it is noteworthy that in the case of the dyes in the presence of GTP blue-shifted excitation was recorded relative to the absorption band of the complexed dye. This may be due to the formation of a poorly emitting or non-emitting ground state complex with this nucleotide (static quenching).The fluorescence properties of compounds A–C alone and in the presence of the four nucleotides (quantum yields ϕF and lifetimes τF) are reported in Fig. 2 and Tables S4 and S8 (ESI†), respectively. The fluorescence quantum yields of the free A and B in solution are remarkable (18% and 43%, respectively) while being significantly lower for compound C (0.0065). This finding is in agreement with the results of a previous study,26 where trans–cis photoisomerization and intersystem crossing were found to play a certain role in the S1 excited-state deactivation of compound C. It is of utmost interest to discuss in detail the effect of the four nucleotides on the fluorescence efficiencies of the investigated dyes. In general, the fluorescence of the investigated methyl pyridinium derivatives resulted to be unaffected or enhanced in the presence of the ATP, CTP and TTP nucleotides. For instance, the fluorescence efficiency was found to be 30%, 21%, and 27% for compound A in the presence of ATP, CTP and TTP, respectively, relative to the 18% radiative quantum yield observed for the free fluorophore in solution. These findings are consistent with the nucleotide complexation somehow inhibiting the non-radiative deactivation of the compounds, particularly in the case of ATP which exhibits a stronger interaction with the investigated dyes relative to the pyrimidine-based nucleotides. Very interestingly, a completely opposite fluorescence behavior was revealed for all three methyl pyridinium derivatives in the presence of GTP. For the GTP-complexed dyes, a significant fluorescence quenching was observed relative to the free dyes in solution (e.g. fluorescence quantum yields of 6.2% for compound A, 17% for compound B and 0.46% for compound C in the presence of GTP). The complexation with GTP may therefore lead to a specific interaction between the dyes and the guanine base, opening up a new decay pathway competitive to the fluorescence.
In order to prove that the changes in the photophysical properties of the dyes in the presence of nucleotides were actually due to a proper complexation between the two partners, spectrophotometric and fluorimetric titrations were performed by adding increasing amounts of ATP and GTP nucleotides to a solution containing the dye at a micromolar concentration (Fig. 3 and Fig. S4, S7, S8, S11 and S12, ESI†). GTP was chosen for its peculiar quenching response, while ATP was taken as the representative of all the nucleotides causing fluorescence enhancement because of its greater effects. Evidence of the complexation emerged from the progressive spectral modifications recorded at each addition. In particular, absorption spectra underwent a bathochromic shift together with a slight hypochromic effect, more apparent in the case of GTP (Fig. S4, S7 and S11, ESI†). As anticipated for the measurements carried out at a maximum 5 mM concentration, emission exhibited two opposite behaviors: ATP caused a progressive enhancement of the fluorescence capability of the dyes, while the unique complexation with GTP was responsible for their reduced emission (Fig. 3 and Fig. S8, S12 and Tables S2, S3, S5, S6 and S9, ESI†). Our data thus suggest that this specific interaction with guanine is the reason underlying the fluorescence quenching of the dyes also when interacting with both ct-DNA and t-RNA (see Fig. 1 and Fig. S1 (ESI†) for A and B, respectively).26,27
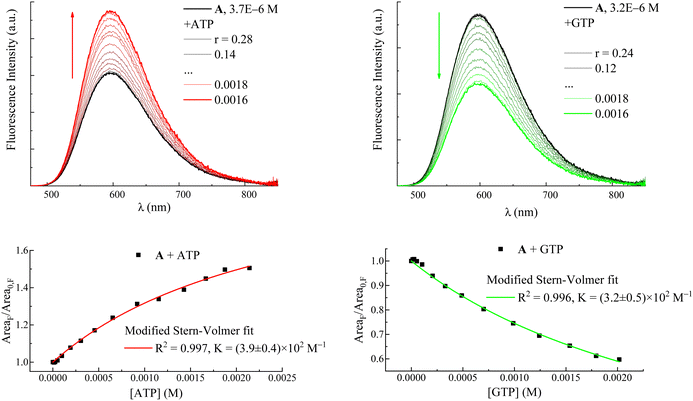 | ||
| Fig. 3 Upper panels: fluorimetric titrations of compound A with ATP (left) and GTP (right). r is the ratio between the drug and nucleotide concentrations: r = [A]/[ATP] or [GTP]. Fluorescence intensity is corrected for the fraction of absorbed light. Arrows indicate the trend of the fluorescence intensity with decreasing r: the red arrow shows the fluorescence enhancement due to increasing [ATP]; the green arrow shows the fluorescence quenching with increasing [GTP]. Lower panels: fluorescence intensity in terms of emission spectrum areas of A as a function of ATP and GTP concentrations and its fitting according to a modified Stern–Volmer equation (eqn (1)). | ||
Fluorimetric titration data allowed values to be calculated for the association constants (K in Table 1 and eqn (1)) between the dyes and the nucleotides ATP and GTP according to a modified Stern–Volmer equation (eqn (1)):
 | (1) |
Information about the fluorescence lifetimes was obtained through nanosecond time-correlated single-photon counting (TC-SPC) spectroscopy for compounds A and B (Fig. 2 and Fig. S6 and Table S4, ESI†) and through femtosecond fluorescence up-conversion (FUC) spectroscopy for compound C (Table S8, ESI†). The short lifetimes of the latter, shorter than the temporal resolution of TC-SPC, are consistent with its lower emission quantum yields. The fluorescence kinetics recorded by TC-SPC for compounds A and B (Fig. 2 and Fig. S6 (ESI†), respectively) generally show a slower decay in the presence of ATP, CTP, and TTP (red, blue and orange traces) and a faster decay in the presence of GTP (green trace) relative to the free compound (black trace). In the case of the free compound A (Fig. 2), the fitting of the fluorescence kinetics revealed a 1.62 ns lifetime. In the presence of nucleotides, the best fitting was achieved by using a biexponential decay function with one component matching the lifetime of the free dye in all cases. The second decay lifetime was found to be longer for the ATP, CTP and TTP complexed dyes (3.12 ns, 2.49 ns and 2.92 ns, respectively) relative to the free dye. Interestingly, only for the GTP-complexed compound A, a second decay time of 1.06 ns, shorter than the lifetime of the free molecule, was observed. The biexponential decay of the fluorescence kinetics of A in the presence of the nucleotides, with the unaffected lifetime of the free dye, is another piece of evidence pointing to the formation of ground state complexes and to the static quenching mechanism of the dye emission induced by GTP. The changes in the excited-state lifetime of A were also monitored during the titrations with ATP and GTP (Tables S2 and S3, ESI†). The average lifetime was found to progressively lengthen as the amount of ATP grew bigger, while it became shorter with increasing GTP concentrations. As a matter of fact, a bi-exponential function was used to better fit the decay kinetics when the contribution of the ATP- or GTP-complexed A became more important and the relative weight percentage of the decay component associated with this complex gradually enhanced, as well.
For the free compound B (Table S4, ESI†), a longer lifetime (2.98 ns) was revealed relative to compound A in line with its larger fluorescence quantum yield. Generally, longer fluorescence lifetimes were revealed from the monoexponential fitting of B in the presence of ATP, CTP, and TTP (3.71 ns, 3.22 ns, and 3.26 ns). The monoexponential decay observed for B also in the presence of the nucleotides may be due to similar lifetimes for the free and complexed dyes. For the GTP-complexed compound B, bi-exponential fitting was used revealing together with the free dye lifetime a shorter decay time close to the TC-SPC resolution (0.45 ns) associated with the quenched complex. Titrations allowed the gradual lengthening or shortening of the average excited-state lifetime of B with the increasing concentrations of ATP or GTP, respectively, to be followed, proving the peculiar effects caused by the complexation of B with the two different nucleotides (Tables S5 and S6, ESI†).
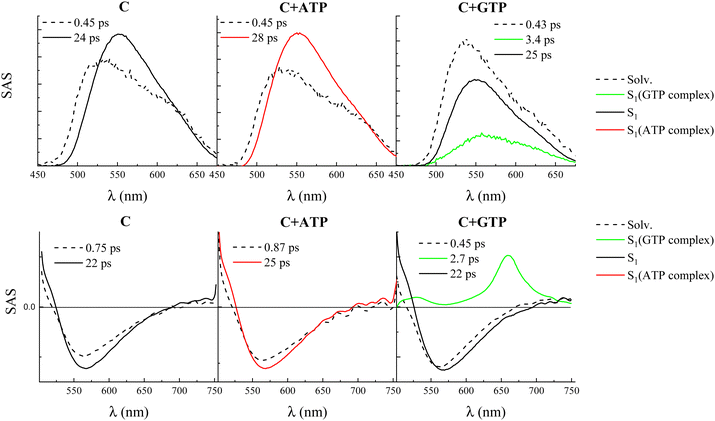
Broadband FUC measurements with femtosecond temporal resolution were performed to gain information about the ultrafast excited state deactivation of compound C, free and in the presence of the four nucleotides. The data collected in these experiments are shown in detail in Fig. S18 (ESI†), with the main findings resulting from the fitting collected in Table S14 (ESI†) and Fig. 4. The time-resolved emission spectra (panel B of the graphs in Fig. S18, ESI†) are centered around 550 nm and showed a certain increase in fluorescence intensity and red-shift at early delays after excitation, followed by a decrease of the emission which was completed in ca. 100 ps. The fluorescence kinetics recorded at shorter wavelengths (ca. 520 nm) revealed a fast decay while those acquired at longer wavelengths (ca. 550 nm) revealed a fast rise. These decay–rise dynamics are consistent with the red shift at early times of the emission spectra due to solvent relaxation around the photoexcited molecule. Indeed, the global fitting of these data revealed the presence of two exponential components for compound C free in solution as well as in the presence of ATP, CTP, and TTP (panel C of the graphs in Fig. S18 (ESI†) and Fig. 4). The first component, characterized by a lifetime of ca. 450 fs, was assigned to solvent relaxation. The second component, characterized by a lifetime of ca. 20 ps and by a slightly red-shifted species associated spectrum (SAS) resulting from the target analysis, was associated with the decay of the relaxed S1 state. A slightly longer lifetime was revealed for the ATP-complexed compound C (28 ps) relative to the free dye (24 ps), in line with the slight increase in the fluorescence quantum yield observed upon complexation with this nucleotide. However, both free and ATP-, CTP-, and TTP-complexed compound C are characterized by rather similar S1 lifetimes. On the other hand, a different photobehavior was found for the GTP-complexed compound C. The global fitting of the data revealed the presence of a three-exponential decay: the first component (430 fs) was relative to solvation and the third component (25 ps) was assigned to the decay of the S1 state of the free dye. However, the second component characterized by a lifetime of 3.4 ps was ascribed to the S1 decay of the complexed compound C, which only in this case resulted to be quenched relative to the free molecule, validating the reduced emission capability of the C–GTP complex.
Further insight into the nature of the observed transient species was gained through femtosecond transient absorption (TA) measurements, whose results in the case of compound C free in solution and in the presence of the four nucleotides are reported in Fig. S19 (ESI†) and Fig. 4. The TA spectra for compound C, free and in the presence of ATP, CTP, and TTP show positive signals of excited state absorption (ESA) below 520 nm and a broad negative band due to the stimulated emission (SE) centered around 570 nm. Decay kinetics were recorded in correspondence with the ESA and rise kinetics at the SE peak. The global fitting of these data revealed the presence of two exponential components, whose lifetimes and SAS are in good agreement with the FUC results, assigned to solvent relaxation and the relaxed S1 state, respectively (Table S14 (ESI†) and Fig. 4). However, for the GTP-complexed compound C, the transient absorption spectra exhibited an additional ESA peak centered at 660 nm and were found to decay within ca. 5 ps after photoexcitation. In this case, the global fitting revealed the presence of three exponential components, with the component characterized by a lifetime of 2.7 ps and by this peculiar ESA band peaked at 660 nm with a less intense absorption at 525 nm, being associated with the quenched S1 state of the complex between C and GTP (Fig. 4). It is noteworthy that this characteristic ESA signal was also observed in previous studies where the photobehavior of compound C was investigated by femtosecond TA in the presence of DNA.26
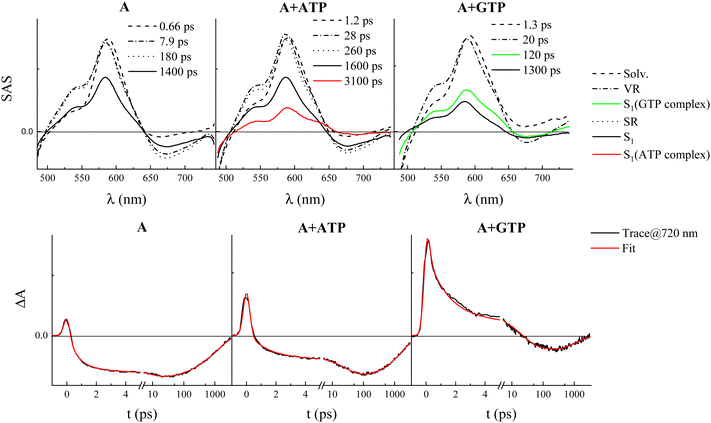
The femtosecond FUC data for compound A are shown in detail in Fig. S13 (ESI†). The time-resolved emission spectra undergo a significant red-shift with time at early delays after excitation, with the final spectra being centered above 600 nm in agreement with its steady-state fluorescence. The global fitting revealed the presence of four exponential components for the free dye (Tables S10 and S11, ESI†): the first component of 820 fs characterized by the most blue-shifted SAS was assigned to the decay of the locally excited S1 state (S1,LE) taking place together with solvent relaxation; the second and third components of 7.8 and 210 ps were assigned to vibrational cooling and structural relaxation; the fourth component of 1.4 ns is relative to the decay of the fully relaxed S1 state characterized by an intramolecular charge transfer (ICT) character for this push–pull system (S1,ICT).29 When compound A was investigated in the presence of ATP, CTP, and TTP, five exponential components resulted from the fitting, with the additional component describing the S1 state of the complex characterized by a longer lifetime in line with the TC-SPC experiments and by a slightly blue-shifted spectrum relative to the free dye. This small difference is not apparent in the steady-state emission spectra where the emission of the free dye and the complex is likely convoluted. A slight increase in the solvent and vibrational relaxation times for the complexes relative to the free fluorophore was also observed. For the GTP-complexed A, the fitting revealed four exponential components with the 210 ps transient probably associated with the decay of the S1 state of the complex in agreement with the additional short component revealed by TC-SPC. Similar results were obtained from the FUC study of compound B (Fig. S15, ESI†), with the most significant difference being the observation of four exponential components in all cases due to the impossibility of temporally discriminating the free and complexed dyes because of the similarity of their lifetimes consistently with the TC-SPC results (Tables S12 and S13, ESI†). For the B–GTP complex, a short decay time had already been disclosed by TC-SPC. Hence, the 19 ps component retrieved from the global fitting of the FUC measurements was thought to be due to the decay of the complex S1. Indeed, this second component lifetime was found to be significantly different from those attributed to vibrational cooling and obtained for compound B alone and in the presence of the other nucleotides (6–8 ps).
Ultrafast TA experiments were also carried out for both compounds A and B, alone and in the presence of the four nucleotides (Fig. S14 and S16 (ESI†), respectively). The transient spectra exhibited negative signals due to ground state bleaching (GSB) below 500 nm, positive ESA centered around 600 nm, and negative SE bands above 650 nm. The SE intensity is higher for compound A relative to B and significantly decreased in the presence of GTP, in agreement with the fluorescence quenching induced by this nucleotide. The transient species and the lifetimes revealed by the global fitting of these data are in remarkable agreement with those obtained from FUC (see Tables S11 and S13, ESI†). The transient to be assigned to the complex of A with nucleotides features a characteristic ESA signal that appears as a shoulder around 640 nm in the SAS of either the long-living transient in the case of ATP, TTP, and CTP or the 120-ps-species revealed in the presence of GTP (Fig. 5 and Fig. S14, ESI†). This finding corroborates the assignments of the FUC transients and again confirms the peculiar quenching effect of GTP when complexed with A (Table S11, ESI†).
Furthermore, it is noteworthy that, for both A and B, an additional and non-negligible ESA around 720 nm was observed in the SAS assigned to the S1 of the complex with GTP, which was not detected in the SAS associated with the complexes with the other nucleotides (see Fig. 5 and Fig. S17 (ESI†) for A and B, respectively). The decay of this enhanced ESA is clearly visible in the decay kinetics at about 720 nm only in the presence of GTP and occurs in ca. 120 ps for A-GTP (Fig. 5) and 11 ps for B-GTP (Fig. S17, ESI†).
Our steady-state and time-resolved spectroscopic results clearly show that a specific interaction is taking place for these methyl-pyridinium derivatives with GTP, which is also responsible for their fluorescence quenching upon DNA- and RNA-binding. An excitation energy transfer interaction between compounds A–C and the nucleotides would not be consistent with our experimental data, as no spectral overlap is observed between the A–C emission and the nucleotide absorption. Moreover, the absorption and emission spectra of the four nucleotides are fairly similar to each other and thus the hypothesis of an energy transfer would not justify the unique interaction with GTP.31 For the hypothesis of interaction via photoinduced electron transfer from the nucleotides to the positively charged methyl-pyridinium, it is necessary to consider its thermodynamic feasibility by evaluating the associated free energy variation according to the following equation:
 | (2) |
From the results obtained for the ΔG° reported in Table 2, it is apparent that the photoinduced electron transfer from ATP, CTP, and TTP to methyl pyridinium is thermodynamically disfavored (ΔG° > 0) while being thermodynamically allowed from GTP (ΔG° < 0). It is noteworthy that the obtained values follow a trend among the three compounds for the electron transfer from GTP  (−0.15 eV) <
  (−0.10 eV) <
  (−0.02 eV), which is consistent with the lifetime of the complex obtained through the ultrafast measurements: τC-GTP (2.7 ps) < τB-GTP (11 ps) < τA-GTP (120 ps). The more allowed the photoinduced electron transfer from GTP to the fluorophore is, the faster the excited state deactivation of the complex. Moreover, it is very interesting that the peculiar ESA centered at 660 nm (for C) and at 720 nm (for A and B), observed during the femtosecond TA experiments for the complexes of these compounds with GTP, falls in the same spectral region of the absorption of the neutral form of methyl-pyridinium after photoreduction as described in literature studies.35 This assignment was further supported by a laser flash photolysis experiment with nanosecond temporal resolution, where compound C was investigated alone and in the presence of 0.1 M N,N-diethylaniline (DEA, a well-known electron donor characterized by a low reduction potential of 0.76 V)36 in acetonitrile. While no significant transient absorption signal was detected for the solution of free compound C, a transient species peaked at 650 nm was revealed for C in the presence of DEA characterized by a spectral shape resembling very closely the bathochromic band of SAS assigned to the C–GTP complex (see Fig. S20 (ESI†) and Fig. 4), confirming the occurrence of photoinduced electron transfer. On the other hand, the less intense ESA at 525 nm resulting from the femtosecond TA data analysis in the SAS of the C-GTP complex (Fig. 4) may be possibly associated with the absorption of the guanine radical cation, in agreement with literature reports.37,38
Conclusions
In conclusion, with this study, we report the direct observation of ultrafast photoinduced electron transfer from guanine triphosphate to methyl pyridinium-based dyes through femtosecond transient-absorption and broadband fluorescence up-conversion spectroscopies. The obtained results give a molecular explanation and a mechanistic insight into the less common fluorescence quenching observed for these fluorophores upon binding DNA and RNA. Moreover, their ability to induce photo-oxidation of guanine may be at the root of the toxicity exhibited by these compounds toward tumor cells. This possibly involves photoinduced RNA damage, particularly in the case of compound A, which was found to be localized in the RNA-rich endoplasmic reticulum.30 These molecules are therefore highly promising as new potential anticancer drugs for RNA-targeted phototherapies.Author contributions
AC and BC: conceptualization, data curation, investigation, methodology, supervision, and writing – original draft. GP and GR: data curation, investigation, and writing – review and editing. GC: data curation, investigation, methodology, and writing – review and editing. CGF, FE and AS: funding acquisition, validation, and writing – review and editing.Data availability
The data that support the findings of this study are openly available.Conflicts of interest
There are no conflicts to declare.Acknowledgements
This work has been funded by the European Union – NextGenerationEU under the Italian Ministry of University and Research (MUR) National Innovation Ecosystem grant ECS00000041 VITALITY. We acknowledge Università degli Studi di Perugia and MUR for support within the project Vitality. BC acknowledges MUR financial support under the PRIN 2022 program, grant no. 2022RRFJC4.Notes and references
- C. Wan, T. Fiebig, S. O. Kelley, C. R. Treadway, J. K. Barton and A. H. Zewail, Proc. Natl. Acad. Sci., 1999, 96, 6014–6019 CrossRef CAS PubMed.
- C. Wan, T. Fiebig, O. Schiemann, J. K. Barton and A. H. Zewail, Proc. Natl. Acad. Sci., 2000, 97, 14052–14055 CrossRef CAS PubMed.
- J. G. Croissant, S. Picard, D. Aggad, M. Klausen, C. Mauriello Jimenez, M. Maynadier, O. Mongin, G. Clermont, E. Genin, X. Cattoën, M. Wong Chi Man, L. Raehm, M. Garcia, M. Gary-Bobo, M. Blanchard-Desce and J.-O. Durand, J. Mater. Chem. B, 2016, 4, 5567–5574 RSC.
- P. Kovacic and L. P. G. Wakelin1, Anti-Cancer Drug Des., 2001, 16, 175–184 CAS.
- K. Hirakawa, K. Ota, J. Hirayama, S. Oikawa and S. Kawanishi, Chem. Res. Toxicol., 2014, 27, 649–655 Search PubMed.
- T. Fiebig, C. Wan, S. O. Kelley, J. K. Barton and A. H. Zewail, Proc. Natl. Acad. Sci., 1999, 96, 1187–1192 CrossRef CAS.
- J. P. Hall, F. E. Poynton, P. M. Keane, S. P. Gurung, J. A. Brazier, D. J. Cardin, G. Winter, T. Gunnlaugsson, I. V. Sazanovich, M. Towrie, C. J. Cardin, J. M. Kelly and S. J. Quinn, Nat. Chem., 2015, 7, 961–967 CrossRef CAS PubMed.
- Y. Wang, S. Liu, Z. Lin, Y. Fan, Y. Wang and X. Peng, Org. Lett., 2016, 18, 2544–2547 CrossRef CAS.
- M. A. Harris, A. K. Mishra, R. M. Young, K. E. Brown, M. R. Wasielewski and F. D. Lewis, J. Am. Chem. Soc., 2016, 138, 5491–5494 CrossRef CAS PubMed.
- S. Paul and A. Samanta, J. Phys. Chem. B, 2018, 122, 2277–2286 CrossRef CAS.
- P. Changenet-Barret, T. Gustavsson, D. Markovitsi and I. Manet, Chem. Phys. Chem., 2016, 17, 1264–1272 CrossRef CAS.
- X. Qu, C. Wan, H.-C. Becker, D. Zhong and A. H. Zewail, Proc. Natl. Acad. Sci., 2001, 98, 14212–14217 CrossRef CAS.
- S. Choi, R. B. Cooley, A. Voutchkova, C. H. Leung, L. Vastag and D. E. Knowles, J. Am. Chem. Soc., 2005, 127, 1773–1781 CrossRef CAS.
- Q.-B. Lu, S. Kalantari and C.-R. Wang, Mol. Pharmaceutics, 2007, 4, 624–628 CrossRef CAS.
- N. Renaud, M. A. Harris, A. P. N. Singh, Y. A. Berlin, M. A. Ratner, M. R. Wasielewski, F. D. Lewis and F. C. Grozema, Nat. Chem., 2016, 8, 1015–1021 CrossRef CAS PubMed.
- J. Nguyen, Y. Ma, T. Luo, R. G. Bristow, D. A. Jaffray and Q.-B. Lu, Proc. Natl. Acad. Sci., 2011, 108, 11778–11783 CrossRef CAS PubMed.
- A. Karatay, S. Kurbanoglu, G. Sevinc, E. A. Yildiz, M. Hayvali, S. A. Ozkan and A. Elmali, J. Mol. Struct., 2022, 1262, 133071 CrossRef CAS.
- A. Barbafina, L. Latterini, B. Carlotti and F. Elisei, J. Phys. Chem. A, 2010, 114, 5980–5984 CrossRef CAS PubMed.
- R. Borrego-Varillas, G. Cerullo and D. Markovitsi, J. Phys. Chem. Lett., 2019, 10, 1639–1643 CrossRef CAS.
- V. Petropoulos, L. Uboldi, M. Maiuri, G. Cerullo, L. Martinez-Fernandez, E. Balanikas and D. Markovitsi, J. Phys. Chem. Lett., 2023, 14, 10219–10224 CrossRef CAS PubMed.
- C. Su, C. T. Middleton and B. Kohler, J. Phys. Chem. B, 2012, 116, 10266–10274 CrossRef CAS.
- A. Mazzoli, B. Carlotti, C. G. Fortuna and A. Spalletti, Photochem. Photobiol. Sci., 2011, 10, 973–979 CrossRef CAS PubMed.
- A. Mazzoli, B. Carlotti, C. Bonaccorso, C. G. Fortuna, U. Mazzucato, G. Miolo and A. Spalletti, Photochem. Photobiol. Sci., 2011, 10, 1830–1836 CrossRef CAS PubMed.
- A. Mazzoli, A. Spalletti, B. Carlotti, C. Emiliani, C. G. Fortuna, L. Urbanelli, L. Tarpani and R. Germani, J. Phys. Chem. B, 2015, 119, 1483–1495 CrossRef CAS PubMed.
- P. H. Doan, D. R. G. Pitter, A. Kocher, J. N. Wilson and T. I. Goodson, J. Am. Chem. Soc., 2015, 137, 9198–9201 CrossRef CAS.
- A. Mazzoli, B. Carlotti, G. Consiglio, C. G. Fortuna, G. Miolo and A. Spalletti, Photochem. Photobiol. Sci., 2014, 13, 939–950 CrossRef CAS PubMed.
- V. Botti, A. Cesaretti, Ž. Ban, I. Crnolatac, G. Consiglio, F. Elisei and I. Piantanida, Org. Biomol. Chem., 2019, 17, 8243–8258 RSC.
- M. Yang and J. S. Schneekloth, Trends Pharmacol. Sci., 2019, 40, 447–448 CrossRef CAS.
- L. Mencaroni, C. Bonaccorso, V. Botti, B. Carlotti, G. Consiglio, F. Elisei, C. G. Fortuna, A. Spalletti and A. Cesaretti, Dyes Pigm., 2021, 194, 109620 CrossRef CAS.
- A. Cesaretti, L. Mencaroni, C. Bonaccorso, V. Botti, E. Calzoni, B. Carlotti, C. G. Fortuna, N. Montegiove, A. Spalletti and F. Elisei, Molecules, 2022, 27, 3713 CrossRef CAS PubMed.
- J. Peon and A. H. Zewail, Chem. Phys. Lett., 2001, 348, 255–262 CrossRef CAS.
- S. Steenken and S. V. Jovanovic, J. Am. Chem. Soc., 1997, 119, 617–618 CrossRef CAS.
- C. E. Crespo-Hernández, D. M. Close, L. Gorb and J. Leszczynski, J. Phys. Chem. B, 2007, 111, 5386–5395 CrossRef.
- C. W. Kazakoff, R. T. B. Rye and O. S. Tee, Can. J. Chem., 1989, 67, 183–186 CrossRef CAS.
- J. Peon, X. Tan, J. D. Hoerner, C. Xia, Y. F. Luk and B. Kohler, J. Phys. Chem. A, 2001, 105, 5768–5777 CrossRef CAS.
- M. Montalti, A. Credi, L. Prodi and M. T. Gandolfi, Handbook of Photochemistry, CRC Press, 2006 Search PubMed.
- E. Balanikas, A. Banyasz, T. Douki, G. Baldacchino and D. Markovitsi, Acc. Chem. Res., 2020, 53, 1511–1519 CrossRef CAS PubMed.
- E. Balanikas, A. Banyasz, G. Baldacchino and D. Markovitsi, Photochem. Photobiol., 2022, 98, 523–531 CrossRef CAS PubMed.
Footnote |
| † Electronic supplementary information (ESI) available: Experimental section. Additional results: steady-state absorption and fluorescence properties; time-correlated single photon counting kinetics and lifetimes; femtosecond transient absorption and fluorescence up-conversion data. See DOI: https://doi.org/10.1039/d4ma00428k |
| This journal is © The Royal Society of Chemistry 2024 |

![[thin space (1/6-em)]](https://www.rsc.org/images/entities/char_2009.gif)
