DOI:
10.1039/D4MA00440J
(Paper)
Mater. Adv., 2024,
5, 8684-8700
A facile auto-combustion pathway for creating Mn- and Fe-doped TiO2 nanostructures and their photocatalytic activity
Received
27th April 2024
, Accepted 24th May 2024
First published on 25th May 2024
Abstract
Using a combination of two fuels, an auto-combustion method was used to synthesize pure TiO2 and doped TiO2 with different concentrations of iron(III) (Fe) and manganese(II) (Mn) (1, 3, 5, and 7 mol%). The as-prepared materials were characterized using different techniques, including thermogravimetric analysis (TGA), X-ray diffraction (XRD), Fourier transform infrared spectroscopy (FT-IR), field emission scanning electron microscopy (FE-SEM), and high-resolution transmission electron microscopy (HR-TEM). The XRD results showed that both pure TiO2 and all doped TiO2 samples had the anatase phase, indicating the crystalline nature of all the as-prepared nanomaterials. Crystal violet decolorization under UV irradiation was used to assess the photocatalytic activity of the prepared samples. The findings showed that, compared to other dopant concentrations, TiO2 with a dopant concentration of 5% Fe and 7% Mn showed the highest degradation rates (95.93% and 96.3%, respectively) at 100 and 70 min, with pseudo-first order rate constants of k = 2.91 × 10⁻² and 4.8 × 10⁻² min−1, respectively. It was found that superoxide radicals and hydroxyl radicals were the main reactive species responsible for dye degradation.
1. Introduction
The mysteries and advantages of bulk materials have been unveiled via nanotechnology.1 In an effort to satisfy market demands, scientists have been working feverishly to develop ideal nanomaterials ever since the nanoscale phase first emerged. The rapid growth of businesses that currently utilize a lot of water on Earth leads to water scarcity brought about by wastewater generation, and this practice puts human health, the environment, and animals in peril. The water quality required for acceptable domestic and commercial applications is negatively impacted by dyes, which are considered major pollutants. Many industries release them into the air, such as those that make textiles, paints, paper, cosmetics, medications, etc. Dyes tend to accumulate due to their complex chemical composition, making them more resistant to biodegradation. This might have very harmful effects, such as an increase in the demand for chemical and biological oxygen.2–4 Due to their exceedingly bright color, variable pH, and high chemical oxygen demand, these effluents have a significant negative impact on both aquatic life systems and human health. The most prevalent effluents that the textile and printing industries release into water bodies are dyes.5 Due to their complex aromatic structure and resistance to heat, light, and chemicals, these dyes degrade over very long periods. Therefore, it is crucial to remove these dangerous dyes from water.6 As a result, several researchers have focused a significant portion of their work on treating wastewater from the textile industry before disposal.7 Dyes are currently produced in large quantities and widely utilized across a variety of industries, one of which is the crystal violet dye, which is depicted in Fig. 1 as a model for application. Crystal violet (CV), also known as C.I. Basic Violet 3, is a synthetic dye commonly used in various industries, including textile, printing, and healthcare.8 However, the release of CV into the environment can have detrimental effects due to its toxicity and carcinogenic properties.9 Therefore, finding effective methods to degrade and remove CV from wastewater is highly important.
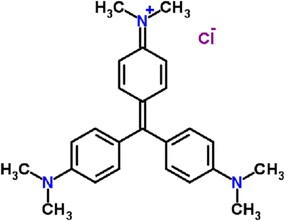 |
| | Fig. 1 Chemical structure of crystal violet as a model for photocatalytic degradation. | |
Different chemical, biological, and physical techniques, such as chemical oxidation,10 reverse osmosis,11 filtration,12 membrane processes,13 solvent extraction,14 adsorption,15 electrochemical and ultrasonication techniques, biological treatment, precipitation, and coagulation,16 have been proposed for the removal of pollutants from wastewater. However, all these techniques have shortcomings, including post-remediation because of sludge production and the removal of adsorbents. In addition, experimental evidence has shown that dyes can be removed using biological and physical purging techniques.17 Therefore, developing a practical way to manage water contamination caused by dyes has become an important and pressing problem.
Advanced oxidation processes (AOPs) have received great interest in recent years as complementary methods to conventional water treatment strategies.18 In addition the advanced oxidation processes have an advantage over other techniques since the various radicals produced, such as superoxide radicals (O2−˙) and hydroxyl radicals (OH˙), which are frequently utilized for photoreduction, break down the dyes into harmless chemicals.19 Among these AOPs, heterogeneous photocatalysis has been considered the most effective and economical methodology for wastewater purification and environmental protection over the past few decades.20 By transforming extremely dangerous pollutants into degradable molecules using light irradiation and appropriate semiconductors, photocatalysis can remove environmental toxins from the environment.21 Numerous metal and metallic oxide-based semiconductors, including TiO2,22 MnO2,23 SnO2,24 Al2O3,25 ZrO2,26 ZnWO4,27 and Bi2Mo3O12,28 have been developed with regulated band gaps to enhance charge separation and harvest visible light irradiation. Because of its nontoxicity, low cost, chemical inertness, and photochemical stability, the binary metal oxide semiconductor TiO2 has proven to be the most suitable and appealing material.29 Although TiO2 has a crystalline structure that increases the number of effective and efficient active surface areas, it has several drawbacks, such as the inability to absorb light in the visible region (380 nm), a wide bandgap energy (3.2 eV), and a tendency for electron–hole recombination, which prevent its practical use.30 Recently, several techniques have been investigated to address some of these drawbacks and hence increase the photocatalytic activity of TiO2 for the treatment of textile effluents, including metal doping31 (e.g., iron (Fe),32 manganese (Mn),33 copper (Cu),34 aluminum (Al),35 chromium (Cr),36 silver (Ag),37 palladium (Pd),38etc.), non-metal doping (e.g., nitrogen (N),39 fluorine (F),40 boron (B),41etc.) and co-doping with metals/metals (Fe–Co,30 Fe–Pr,42 and V–Mo43). There have been several documented techniques for making doped TiO2, including hydrothermal,44 microwave heating,45 sol–gel,46 precipitation,47 and solution combustion methods.48,49 In some studies, the photocatalytic performance of some dyes, including amaranth,50 crystal violet,51,52 methyl orange,53,54 and methylene blue,55 was examined.
Our previous study56 on the photocatalytic efficiency of lanthanum cation-doped TiO2 demonstrated that doping TiO2 with La cations significantly enhances its photocatalytic efficiency, leading to effective degradation of the pollutant under UV light.
In contrast, the current work investigates the photocatalytic degradation of crystal violet dye using TiO2 doped with manganese and iron. These alternative dopants influence the photocatalytic activity and degradation mechanism of TiO2, as these dopants exist among the transition elements (d block) that have electronic configuration and characteristic properties different from those of La (F block). By comparing the performance and efficiency of La-doped TiO2 with those of Mn- and Fe-doped TiO2, we aim to identify key differences and potential improvements in photocatalytic performance. Notably, the introduction of manganese and iron may alter the electronic properties and light absorption characteristics of TiO2, potentially leading to enhanced degradation rates and broader applicability in environmental remediation. Pure TiO2 and doped TiO2 with different concentrations of Mn2+ and Fe3+ are produced via a combustion technique. The solution combustion process offers several advantages, including cost-effectiveness, rapid synthesis and homogeneous product production.57,58 The materials have been characterized using a variety of spectroscopic techniques and thermal investigations. The ability of the nanoparticles to remove the CV dye from the aqueous phase was investigated.
2. Materials and methods
2.1. Materials
From Advent Chembio Pvt. Ltd, India, titanium(IV) isopropoxide (TTIP) was acquired. The supplier of nitric acid (65%), citric acid, and manganese(II) acetate tetrahydrate was Lanxess India. Oxford Lab Fine Chem LLP provided the crystal violet dye, the Adwic Company supplied urea, and Qualikems Fine Chem Pvt. Ltd, India supplied iron(III) nitrate nonahydrate.
2.2. Methods
2.2.1. Synthesis of TiO2 and (Mn, Fe)-doped TiO2 nanoparticles.
The auto-combustion approach was used to create TiO2 nanoparticles utilizing titanium(IV) isopropoxide (Ti(OCH(CH3)2)4) as the titania precursor and a mixture of urea and citric acid as the fuel. After 6.1 mL of titanium isopropoxide and 30 mL of distilled water were rapidly stirred for one hour, titanyl hydroxide (TiO(OH)2) was produced. By combining the turbid white solution (titanyl hydroxide) with 15 mL of HNO3, titanyl nitrate (TiO(NO3)2) was produced. After that, 2.13 g, 11.1 mmol citric acid, and 33.2 mmol urea aqueous solutions were combined with titanyl nitrate, and the mixture was agitated for 5 min. The mixture of titanyl nitrate and fuel for the combustion process is based on the presumption that the equivalence ratio C should be unity (i.e., C = (F/O) = 1) to increase the released energy from the combustion process for each reaction, where O is the total oxidizing valence of the oxidizer (i.e., titanyl nitrate) and F is the total reducing valence of the reducer (the fuel) (i.e., a combination of urea and citric acid).59 The fuel oxidizer mixture was placed on a hot plate at 135 °C with stirring until the resin had formed, at which point it was heated at 350 °C to produce ash. To obtain pure and crystalline TiO2 nanoparticles, the resultant ash was calcined at 650 °C for 2 h. To prepare TiO2 doped with Mn and Fe, separately, known concentrations (1, 3, 5, and 7 mol%) of manganese(II) acetate tetrahydrate and iron(III) nitrate nonahydrate were successively added to the titanyl nitrate solution. Then, the same procedures for producing pure TiO2 were carried out until powder (ash) was obtained. Mn–TiO2 and Fe–TiO2 nanoparticles were created from this ash by manually grinding it and calcining it at 600 °C for 2 h. Fig. 2 shows the proposed steps for preparing pure and doped TiO2.
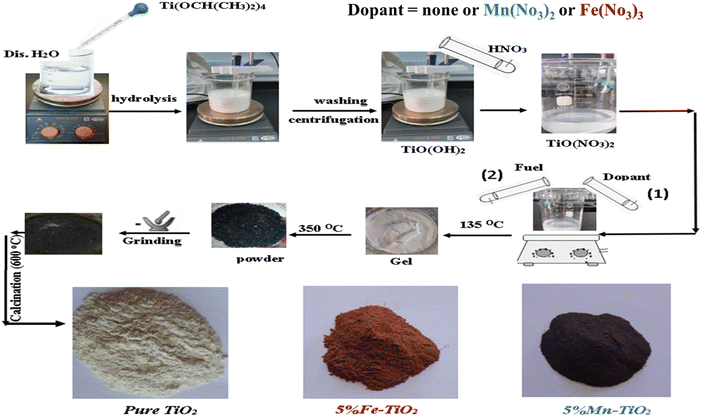 |
| | Fig. 2 Schematic proposed diagram for preparation of pure and doped TiO2. | |
2.2.2. Preparation of Mn2O3 and Fe2O3 nanoparticles.
Aqueous solutions of iron(III) nitrate nonahydrate (8.07 g) and manganese(II) nitrate were mixed with the fuel (homogeneous solutions of urea (2 g, 33.2 mmol) and citric acid (2.13 g, 11.1 mmol)). To obtain manganese(II) nitrate, an aqueous solution of manganese(II) acetate tetrahydrate (4.9 g) was treated with sodium hydroxide to adjust the pH and then treated with nitric acid. The oxidizer–reducer mixtures of manganese nitrate and iron nitrate with the fuel were heated at 135 °C to obtain a gel, which was subsequently heated to 350 °C to produce ash. The obtained powder was manually ground and calcined at 600 °C for 2 h to obtain Mn2O3 and Fe2O3 nanoparticles.
2.3. Characterization
The as-prepared samples were subjected to a range of analytical tests, including thermogravimetric analysis (TG-DTA) (SDT Q600 V20.9 Build 20), X-ray diffraction (XRD) (patterns were recorded on a Bruker, D8 Discover, Germany using Cu-Kα radiation (λ = 1.5406 Å), a voltage of 40 kV and a current of 40 mA with a 2 theta scanning range of 10–80º), Fourier transform infrared (FT-IR) spectroscopy (Bomem; model MB157S) from 4000 to 400 cm−1 at room temperature, UV-vis spectroscopy (Jasco, model V670) to ascertain the dye concentration in the 400–700 nm range, high-resolution transmission electron microscopy (HR-TEM, JEM-2100) at an accelerating voltage of 200 kV by dispersing the samples in water on a copper grid, and field emission scanning electron microscopy (FE-SEM, JEOL JSM-6500F).
2.4. Photodegradation evaluation
Using homemade apparatus (Fig. 3) composed of a 250 mL quartz beaker, three 20-watt G13T8 UV-C mercury lamps with a maximum wavelength of 254 nm, and a multistirrer (300 rpm), the degradation of the crystal violet dye was utilized to test the photocatalytic activity of the as-prepared samples. 50 mL of crystal violet aqueous solution (20 mg L−1) was mixed with different amounts of the as-prepared nanocrystalline photocatalysts (25 mg, 35 mg, 50 mg, and 75 mg). To achieve the adsorption–desorption equilibrium between the dye and the photocatalyst, the mixture was magnetically agitated for one hour before illumination. The nanophotocatalyst and dye solutions were separated by centrifuging 5 mL of the suspension at 5000 rpm for 3 min at intervals of 10 min during the photocatalytic process. Spectrophotometric detection at λmax = 584 nm revealed the concentration of the dye in the supernatant.
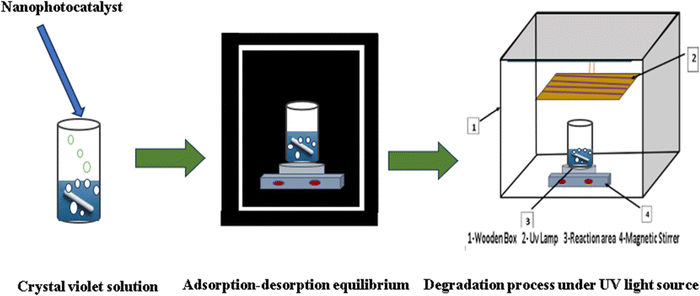 |
| | Fig. 3 The schematic shape of the experimental setup for the photocatalytic degradation reaction. | |
Eqn (1) was used to estimate the degradation efficiency.
| |  | (1) |
where
C0 is the initial concentration and
C is the concentration at time
t.
A series of scavenging tests were carried out to gain a thorough understanding of the active species responsible for the CV degradation process. In comparison to the initial CV concentration (50 mg of the photocatalyst and 50 mL of CV solution (20 mg L−1)), the scavengers were added at a 20 times molar concentration. Ascorbic acid (AA) as an ˙O2− scavenger,60 EDTA–2Na as an h+ scavenger,61 and methyl alcohol (MA) as an ˙OH scavenger62 were independently introduced in an illustrative degradation process.
3. Results and discussion
3.1. XRD study
The XRD patterns of pure TiO2 and doped TiO2 with various concentrations of Fe and Mn (1, 3, 5, and 7 mol%) are shown in Fig. 4A and B, respectively, which demonstrate that both pure TiO2 and all doped TiO2 samples with different concentrations Fe and Mn are crystalline. According to Fig. 4A, the two most common polymorphs of TiO2, namely, anatase (JCPDS: 01-071-1167) and rutile (JCPDS: 01-076-0318), are present in different proportions, but the anatase phase is dominant, as it constitutes 74% of the total diffraction peaks in Fe–TiO2 and approximately 95% in Mn–TiO2, as only one peak of 3% Mn–TiO2(101) appears for the rutile phase. With the lattice parameters a = b = 3.7892 Å, c = 9.537 Å and α = β = γ = 90°, all the diffraction peaks of the samples can be correlated to the anatase tetragonal TiO2 phase. The distinctive diffraction peaks of the anatase form of pure TiO2 are observed at 2θ = 25.39°, 37.6°, 47.9°, 53.7°, 54.9°, and 62.5°, respectively. According to the XRD pattern of Fe–TiO2, the rutile phase is less abundant in the undoped sample, as indicated by the appearance of only two extremely weak peaks at 2θ = 27.4° (110) and 36° (101), which intensify with increasing Fe content. The reason why the anatase phase appears earlier in Fe–TiO2 than in pure TiO2 may be because the low charge cations (i.e., <+4) can act as anatase-to-rutile transition promoters.63
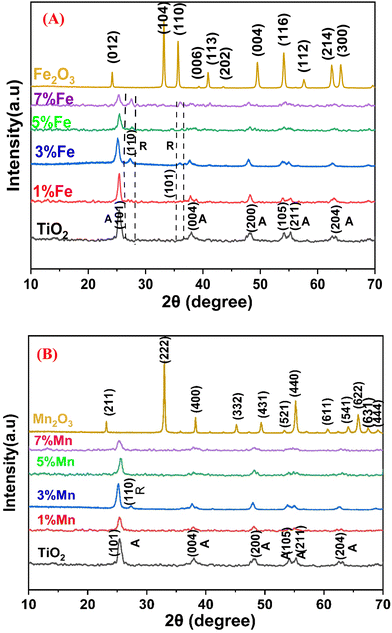 |
| | Fig. 4 XRD patterns of (A) pure oxides (TiO2 and Fe2O3) and doped TiO2 with changing concentrations (1, 3, 5, and 7 mol%) of Fe3+ cations and (B) pure oxides (TiO2 and Mn2O3) and doped TiO2 with different concentrations (1, 3, 5, and 7 mol%) of Mn2+ cations and TiO2 pattern56 trace previously published in reference (sm/ymri/04239411) and reproduced with permission from Taylor & Francis. | |
According to the calcination temperature, electronegativity, crystal structure, and atomic size that determine the substitution position, the dopant can generally act as an interstitial or substitutional impurity in the TiO2 crystal lattice.64 Due to the difference in the ionic radius between the dopant cations (Fe3+ and Mn2+) and the host cation (Ti4+), the crystallite sizes of the doped TiO2 (Table 1) increased with increasing dopant concentration, which may be attributed to the expansion of the crystal lattice of TiO2 resulting from the substitutional doping of the dopants. As shown in Fig. 4 and Table 2, the (101) diffraction peak of the doped TiO2 that is displaced to a lower angle at a lower concentration shifted to a higher angle at higher concentrations, while the d value gradually increased with increasing dopant concentration and then decreased, which is consistent with Bragg's relation (eqn (1)), where d is the interplanar distance, θ is the degree of diffraction, and λ is the wavelength of the incident ray. This can be explained by the initial formation of a substitutional solid solution, which has been linked to an increase in the anatase cell volume at low dopant contents followed by a decrease in the cell volume at higher dopant contents. This expansion of the unit cell is caused by the inability of extra dopant ions to enter the TiO2 lattice, forcing them into interstitial sites.65 To determine the lattice parameters of the undoped and doped TiO2 nanocrystals, the peaks corresponding to the (004) and (200) crystal planes of the anatase phase were chosen. The samples' unit cell volume and lattice parameters were determined by applying Bragg's law and eqn (2), where (hkl) are the Miller indices and a, b, and c are the lattice parameters (in a tetragonal system, a = b ≠ c). The estimated data (Table 3) show that the estimated lattice parameters and unit cell volume of the doped TiO2 nanoparticles differ significantly from those of the undoped sample due to the introduction of Fe3+ and Mn2+ ions into the TiO2 lattice, which causes local distortion of the crystal structure.
Table 1 Crystallite sizes of pure TiO2 and doped TiO2
| S. no. |
Dopant concentration (%) |
Dopant/crystallite size (nm) |
Dopant/crystallite size (nm) |
| 1 |
0 |
None/11.06 |
None/11.06 |
| 2 |
1 |
Mn/11.78 |
Fe/12.41 |
| 3 |
3 |
Mn/14.4 |
Fe/18.32 |
| 4 |
5 |
Mn/18.81 |
Fe/19.8 |
| 5 |
7 |
Mn/28.26 |
Fe/29.43 |
Table 2 Interplanar distances and diffraction peak angle values of pure and doped TiO2
| Photocatalyst |
Plane |
d-spacing (Å) |
Diffraction angle (θ) |
| TiO2 |
(101) |
3.4963 |
25.398 |
| 1% Fe–TiO2 |
(101) |
3.5038 |
25.389 |
| 3% Fe–TiO2 |
(101) |
3.5382 |
25.099 |
| 5% Fe–TiO2 |
(101) |
3.5059 |
25.38 |
| 7% Fe–TiO2 |
(101) |
3.5155 |
25.298 |
| 1% Mn–TiO2 |
(101) |
3.5098 |
25.389 |
| 3% Mn–TiO2 |
(101) |
3.5382 |
25.2 |
| 5% Mn–TiO2 |
(101) |
3.5081 |
25.57 |
| 7% Mn–TiO2 |
(101) |
3.5155 |
25.29 |
Table 3 Lattice parameters and cell volume of different samples estimated from XRD data
| Sample |
a (Å) |
c (Å) |
Cell volume (Å3) |
| TiO2 |
3.7762 |
9.2469 |
131.8638 |
| 1% Fe–TiO2 |
3.7812 |
9.2656 |
132.4793 |
| 3% Fe–TiO2 |
3.7900 |
9.3180 |
133.8489 |
| 5% Fe–TiO2 |
3.7740 |
9.2008 |
131.0490 |
| 7% Fe–TiO2 |
3.7897 |
9.2433 |
132.7543 |
| 1% Mn–TiO2 |
3.7769 |
9.2600 |
132.0981 |
| 3% Mn–TiO2 |
3.7899 |
9.3163 |
133.8157 |
| 5% Mn–TiO2 |
3.7663 |
9.2581 |
131.3294 |
| 7% Mn–TiO2 |
3.7688 |
9.2134 |
130.8716 |
When the doping concentration increases, the intensity of the diffraction peaks generally decreases significantly, signifying a loss of crystallinity because of lattice distortion. Strain is introduced into the system when dopant ions are added to the TiO2 periodic crystal lattice. This causes the lattice periodicity to change and the crystal symmetry to decrease.9 As seen from the XRD patterns, when the concentration increased, the diffraction peak width increased, indicating a systematic decrease in the grain size. The decrease in crystallinity that occurs with Fe and Mn doping can be explained by the difference in ionic charge between Ti4+ and the dopants (Mn2+ and Fe3+).66
Eqn (4) provides the Debye–Scherrer equation, which is used to determine the average crystallite size of the photocatalysts under the as-prepared conditions. The terms “crystal size” (D), “shape factor” (k), “diffraction angle” (θ), and “full width at half-maximum height” (β) refer to the dimensions of the crystal. The results are displayed in Table 1.
| | 2d![[thin space (1/6-em)]](https://www.rsc.org/images/entities/char_2009.gif) sin sin![[thin space (1/6-em)]](https://www.rsc.org/images/entities/char_2009.gif) θ = λ θ = λ | (2) |
| |  | (3) |
| |  | (4) |
The XRD pattern of the iron oxide product is depicted in Fig. 4A, and this pattern is clearly associated with the pure Fe2O3 phase with rhombohedral structure (space group R![[3 with combining macron]](https://www.rsc.org/images/entities/char_0033_0304.gif) C (167), lattice constants a = 5.038 and c = 13.776, JCPDS card: 01-073-3825). The Debye–Scherrer equation was used to calculate the average crystallite size of the produced Fe2O3 nanoparticles, which was found to be approximately 48.96 nm.
C (167), lattice constants a = 5.038 and c = 13.776, JCPDS card: 01-073-3825). The Debye–Scherrer equation was used to calculate the average crystallite size of the produced Fe2O3 nanoparticles, which was found to be approximately 48.96 nm.
In Fig. 4B, the XRD pattern of the manganese(III) oxide product shows the cubic structure of the pure Mn2O3 phase (space group Ia![[3 with combining macron]](https://www.rsc.org/images/entities/char_0033_0304.gif) (206), lattice constant a = 9.414, and JCPDS card: 01-071-0636). The average crystallite size of the produced Mn2O3 nanoparticles was calculated using the Debye–Scherrer equation and was found to be approximately 45.57 nm.
(206), lattice constant a = 9.414, and JCPDS card: 01-071-0636). The average crystallite size of the produced Mn2O3 nanoparticles was calculated using the Debye–Scherrer equation and was found to be approximately 45.57 nm.
3.2. Thermal analysis
According to the thermogravimetric analysis (TGA) curve on the left side of the y-axis, the weight loss of the samples is presented for the thermal assessment of pure TiO2, 5% Mn–TiO2, and 5% Fe–TiO2 in Fig. 5A–C, respectively. The weight loss process consisted of three steps for all the samples. In particular, the evaporation of adsorbed water and ethanol is what predominantly contributes to the loss in the first phase, which for all samples occurs generally between 0 and 250 °C.67 It is possible that burning organic materials at 250 °C to 500 °C will result in the second phase of weight reduction. The third stage of weight loss, which lasts between 500 °C and 700 °C, is caused by the gel's dehydroxylation.68
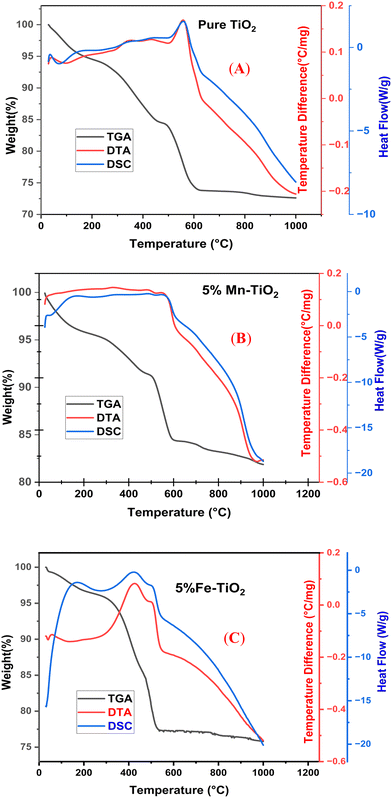 |
| | Fig. 5 TG-DTA-DSC curves of (A) pure TiO256 (previously published in reference: sm/ymri/04239411 and reproduced with permission from Taylor & Francis), (B) 5% Mn–TiO2, and (C) 5% Fe–TiO2. | |
The desorption of ethanol and water is represented by a significant decrease in the peak (endothermic peak) on the differential thermal analysis (DTA) curve at approximately 100 °C for pure TiO2 (Fig. 5A). At approximately 560 °C, heat release was predominantly caused by the decomposition of organic matter by burning. The change of TiO2 from its amorphous phase to its crystalline anatase phase, which occurred between approximately 500 °C and 650 °C, may have contributed to the apparent decrease that occurred during this time.69 A phase change from anatase to rutile can be observed starting at 500 °C in the exothermic peak of the pure TiO2 DTA curve. At approximately 550 °C, the exothermic maximum appears for Mn–TiO2. This clearly demonstrates that Mn doping hinders the phase change.70 According to the differential scanning thermogram (DSC curve), there are two main endothermic reactions, where solvent evaporation causes the first step to begin at approximately 100 °C for all samples.71 Due to the anatase to rutile conversion of the samples, all stages begin at nearly 620 °C.72 Significantly, the findings of thermal analysis indicate that calcination processes performed at 650 °C and 600 °C are adequate to produce pure and doped TiO2, respectively.
3.3. Optical activity
An important factor in the photocatalytic degradation of dyes is the band gap energy (Eg) of the nanophotocatalyst, which depends on the optical absorption coefficient and type of electronic transition of the catalyst.73 As shown in Fig. 6A and B, the band gap of pure TiO2 and TiO2 doped with Fe3+ and Mn2+ at various concentrations was measured using diffuse reflection spectroscopy (DRS), and the band gap was estimated using the Kubelka–Munk technique (eqn (5)). Table 4 contains the calculated band gap values of doped and pristine TiO2.| |  | (5) |
where F(R) is the Kubelka–Munk function, A is the energy-independent constant, hν is the input photon energy, Eg is the energy band gap, and n = 1/2 for a direct band gap and n = 2 for an indirect band gap. It is clearly observed that the band gap of doped TiO2 was narrower than that of pure TiO2, and the band gap of Fe–TiO2 decreased with increasing Fe content, as shown in the inset of Fig. 6A, which is consistent with the literature.74,75 It is possible to attribute the decreasing band gap of doped TiO2 compared to that of pure TiO2 to an electronic transition from the dopant's valence band (Fe3+/Fe4+) to the conduction band of TiO2.74
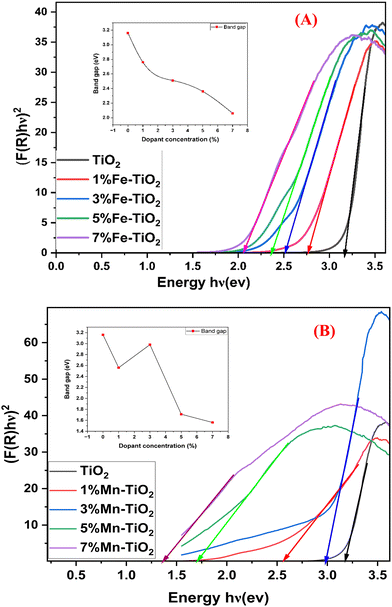 |
| | Fig. 6 Band gaps of (A) pure TiO2 and doped-TiO2 with different percentages (1, 3, 5, and 7 mol%) of Mn2+ and (B) pure TiO2 and doped-TiO2 with different percentages (1, 3, 5, and 7 mol%) of Fe3+. | |
Table 4 Band gap values of pure TiO2 and TiO2 doped with Fe and Mn
| S. no. |
Dopant concentration (%) |
Dopant/band gap (eV) |
Dopant/band gap (eV) |
| 1 |
0 |
None/3.16 |
None/3.16 |
| 2 |
1 |
Mn/2.56 |
Fe/2.76 |
| 3 |
3 |
Mn/2.98 |
Fe/2.51 |
| 4 |
5 |
Mn/1.71 |
Fe/2.36 |
| 5 |
7 |
Mn/1.56 |
Fe/2.06 |
Fig. 7 shows the absorbance spectra of undoped TiO2 and TiO2 doped with different concentrations of Fe3+ and Mn2+. While the absorption edge of the doped TiO2 sample is redshifted and the light absorption is considerably enhanced in the range from 360 to 600 nm with increasing dopant concentration, the absorption edge of the undoped TiO2 sample increases steeply at approximately 357 nm. Accordingly, the material's apparent loss in crystallinity, as verified by XRD, can be primarily responsible for the increase in absorbance that is observed with dopant concentration. The primary impact of dopant concentration is evidently a redshift of the absorption edge, which accounts for the decrease in the bandgap. The change in the electrical structure of TiO2 as a result of Fe and Mn doping may be the cause of this redshift in the Eg.76
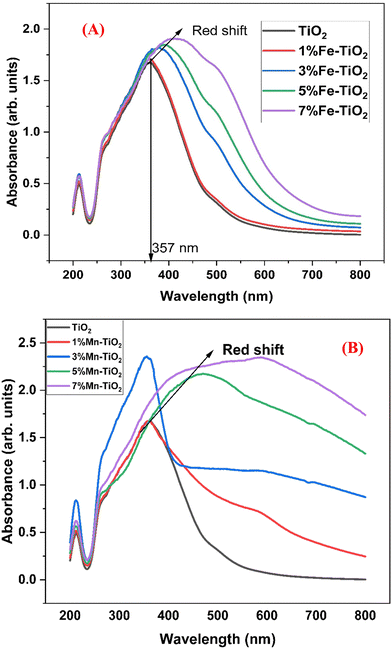 |
| | Fig. 7 Absorbance spectra of (A) pure TiO2 and doped TiO2 with different amounts of Fe3+ and (B) pure TiO2 and doped TiO2 with different amounts of Mn2+. | |
3.4. FT-IR study
The large peak below 1000 cm−1, especially at 502.6 cm−1 in this study, was predominantly caused by Ti–O–Ti vibration,77 as shown in Fig. 8(A and B), which shows the FTIR spectra of TiO2 and doped TiO2 with varying amounts of Mn and Fe. The Ti–O–Mn and Ti–O–Fe bands of the Mn–TiO2 and Fe–TiO2 nanoparticles may have formed as a result of the band right shift at 416 cm−1. Fig. 8C shows that the Mn–O bond vibration generates three distinct peaks at approximately 485, 568, and 664 cm−1, supporting the synthesis of MnO,78 which is consistent with the XRD results. The FT-IR spectrum of Fe2O3 is shown in Fig. 8(D). The peaks at 429 cm−1 and 517 cm−1 are attributed to the vibration of the Fe–O bond.79
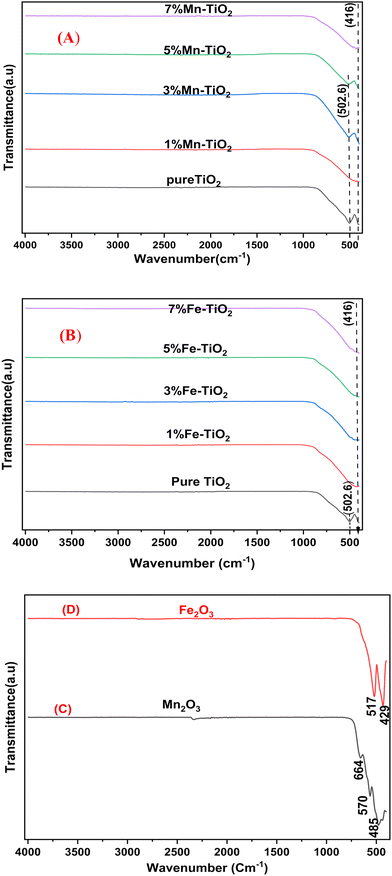 |
| | Fig. 8 FT-IR spectra of (A) pure TiO2 and Mn–TiO2 with varying concentrations (1, 3, 5, and 7 mol%) of Mn2+, (B) pure TiO2 and Fe-TiO2 with varying concentrations (1, 3, 5, and 7 mol%) of Fe3+, (C) Mn2O3 calcinated at 600 °C for 2 h, and (D) Fe2O3 calcinated at 600 °C for 2 h. | |
3.5. Morphology study
3.5.1. Field emission scanning electron microscopy (FE-SEM) and energy dispersive X-ray (EDX) results.
For both pure TiO2 and doped TiO2 (5% Fe–TiO2 and 7% Mn–TiO2), FE-SEM-EDX was employed to characterize the form and distribution of the particles. Fig. 8A–F shows FE-SEM images of both pure and doped TiO2. The images show the crystalline nature of the two varieties of TiO2 (doped and undoped), the high interparticle adhesion, and the spherical form of the pure TiO2 particles. The porosity of the synthesized doped products is shown in high-magnification FE-SEM images (Fig. 9D and F). Additionally, all the prepared samples had uneven shapes and were composed of aggregates of spherical and nonspherical nanoparticles.
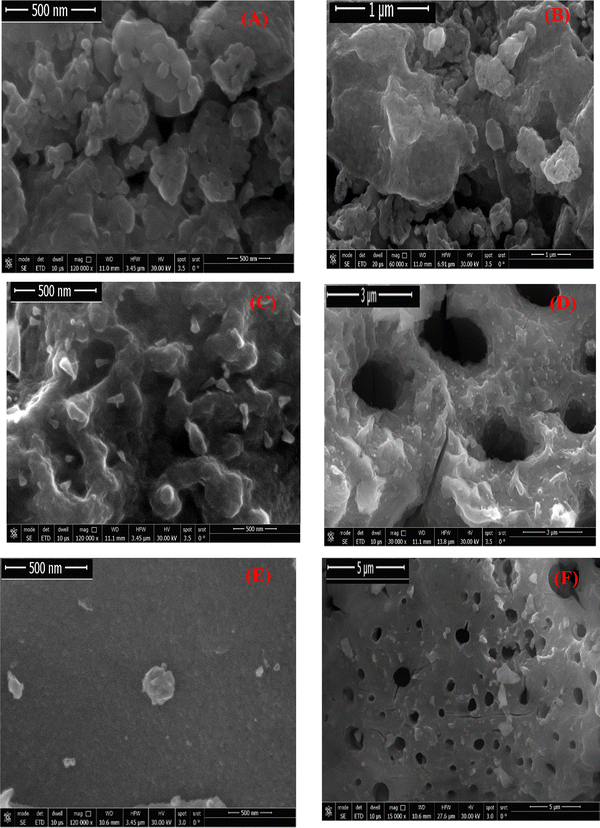 |
| | Fig. 9 FE-SEM photos of pure TiO2 (A) and (B)56 (previously published in reference: sm/ymri/04239411 and reproduced with permission from Taylor & Francis), calcined at 650 °C for 2 h, 7% Mn–TiO2 (C) and (D), calcined at 600 °C for 2 h, and 5% Fe–TiO2 (E) and (F), calcined at 600 °C for 2 h. | |
The 5% Fe–TiO2 and 7% Mn–TiO2 elemental compositions were also examined via energy-dispersive X-ray (EDX) analysis; the results are displayed in Fig. 10. The presence of Fe–TiO2 particles was demonstrated by the presence of Ti, Fe, and O, which were visible in the EDX spectrum of the 5% Fe–TiO2 product. In addition, the spectrum of the 5% Mn–TiO2 product revealed Ti, Mn, and O as supporting components in the creation of the Mn–TiO2 particles.
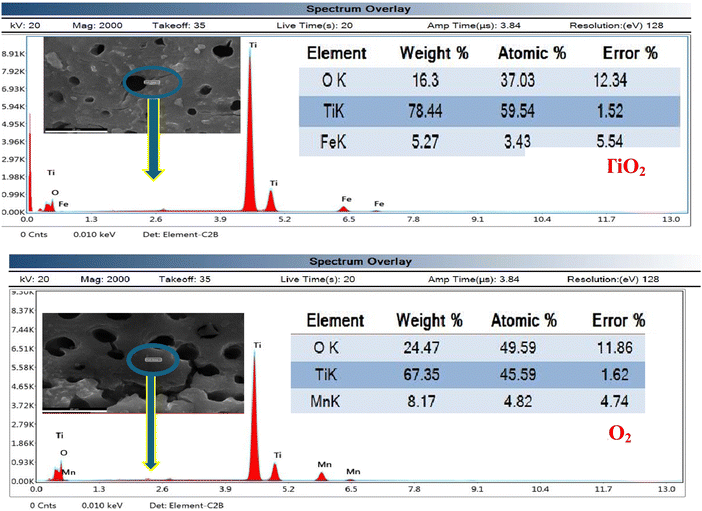 |
| | Fig. 10 EDX results for 5% Fe–TiO2 and 7% Mn–TiO2. | |
3.5.2. High-resolution transmission electron microscopy (HR-TEM).
TEM images match the depicted surface morphology of doped TiO2 (7% Mn–TiO2 and 5% Fe–TiO2) and pure TiO2. Fig. 11A, C, and E depicts the spherical shape of the particles and their aggregation for pure TiO2, Fe–TiO2, and Mn–TiO2, respectively. The average particle sizes of pure TiO2, 5% Fe–TiO2, and 7% Mn–TiO2 were approximately 64.15 nm, 23.15 nm, and 22.08 nm, respectively, as determined from the TEM images using ImageJ. Dopants can function as nucleation sites during the creation of nanoparticles, lowering the energy required for particle formation, and the increased number of nucleation sites can result in a greater number of smaller particles. This may explain why the doped TiO2 particles were smaller than the pure TiO2 particles. The interplanar distance (d) was calculated and found to be 0.34 nm, 0.35 nm, and 0.351 nm for TiO2, 5% Fe–TiO2, and 7% Mn–TiO2, respectively, as shown in Fig. 11B, D, and F, which is consistent with the XRD data. The patterns of 5% Fe–TiO2 and 7% Mn–TiO2, as shown in Fig. 11G and H, respectively, were created by selected area electron diffraction and show unusually bright rings that are the result of regular and well-aligned polycrystals. The XRD results are consistent with the relative strengths of the visible diffraction rings, which may be indexed to the (101), (004), (211), and (204) planes.
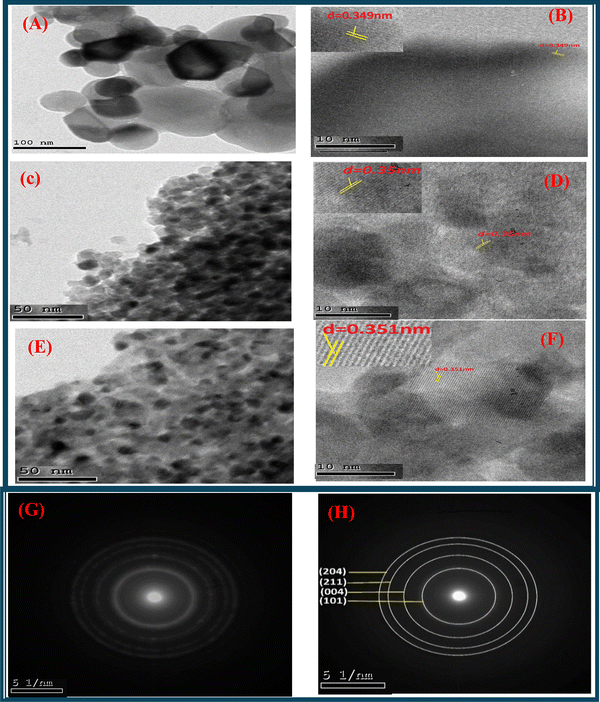 |
| | Fig. 11 HR-TEM photos of (A) and (B) pure TiO256 (previously published in reference: sm/ymri/04239411, and reproduced with permission from Taylor & Francis), (C) and (D) 5% Fe–TiO2, (E) and (F) 7% Mn–TiO2 and (G) and (H) SAED patterns of 5% Fe–TiO2 and 7% Mn–TiO2, respectively. | |
3.6. Photocatalytic assessment
To compare the results, photocatalytic evaluation of TiO2, Fe2O3, and Mn2O3 and doped TiO2 with different cations of Fe3+ and Mn2+ at various concentrations ranging from 1 to 7 mol% was carried out. A total of 20 ppm (20 mg L−1) crystal violet aqueous solution was mixed with 50 mg of the as-prepared catalyst. As illustrated in Fig. 12A and B, the photocatalytic performance of the as-prepared samples Fe–TiO2 and Mn–TiO2 was investigated at 120 and 100 min, respectively. Further research on the kinetics of the photocatalytic degradation of CV was conducted. The plot of ln(Ct/C0) vs. irradiation time intervals clearly demonstrates a linear relationship, where C0 is the dye concentration prior to irradiation and after attaining adsorption/desorption equilibrium and Ct is the actual dye concentration at irradiation time t. For the Fe–TiO2 and Mn–TiO2 samples, respectively, Fig. 12C and D show linear correlations between curves that follow the equation ln(Ct/C0) = Kt, where K is the first-order rate constant. It is common to observe strong correlations, which prove that the reaction kinetics follow a pseudo-first-order rate law. The first-order constants are shown in Table 5.
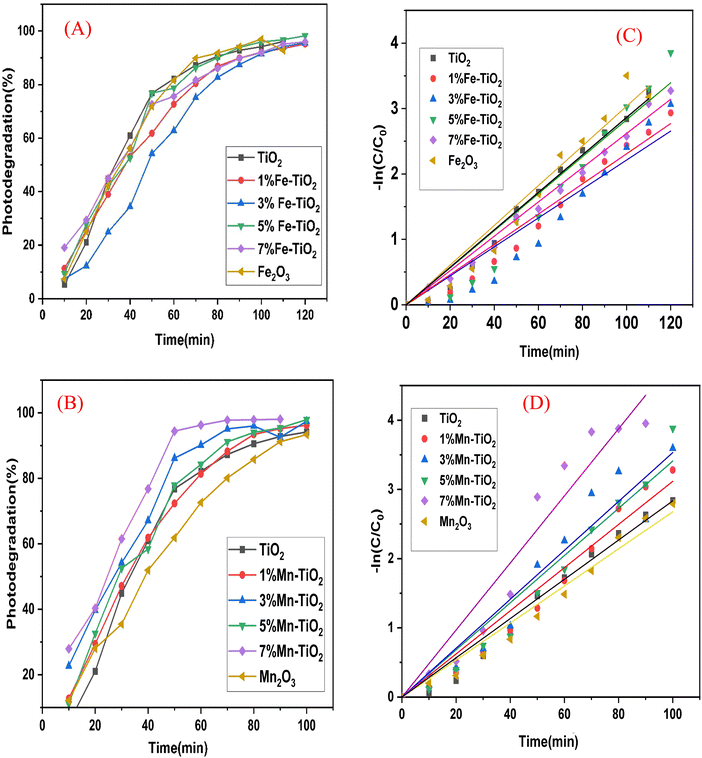 |
| | Fig. 12 Effect of contact time on the degradation rate of an aqueous solution of CV in the presence of (A) pure oxides (TiO2 and Fe2O3) and Fe–TiO2, (B) pure oxides (TiO2 and Mn2O3) and Mn–TiO2. Corresponding pseudo-first-order kinetic fits for the photocatalytic degradation reaction of CV using (C) pure oxides (TiO2 and Fe2O3) and Fe–TiO2 and (D) pure oxides (TiO2 and Mn2O3) and Mn–TiO2 under UV light and with the change in concentration in relation to time (min) upon irradiation of an aqueous solution of CV in the presence of (B) TiO2, Fe2O3 and Fe–TiO2 and (D) pure TiO2, Mn2O3, and Mn–TiO2 under UV light. | |
Table 5 Calculated kinetic parameters for the degradation processes
| S. no. |
Dopant concentration |
Parameters/Mn–TiO2 |
Parameters/Fe–TiO2 |
|
R
2
|
K (min−1) |
R
2
|
K (min−1) |
| 1 |
0 |
0.992 |
2.89 × 10⁻² |
0.992 |
2.89 × 10⁻² |
| 2 |
1 |
0.984 |
3.1 × 10⁻² |
0.985 |
2.31 × 10⁻² |
| 3 |
3 |
0.972 |
3.5 × 10⁻² |
0.956 |
2.21 × 10⁻² |
| 4 |
5 |
0.981 |
3.4 × 10⁻² |
0.971 |
2.91 × 10⁻² |
| 5 |
7 |
0.976 |
4.8 × 10⁻² |
0.996 |
2.61 × 10⁻² |
| 6 |
Simple oxides |
Mn2O3 |
Fe2O3 |
| 0.989 |
2.6 × 10⁻² |
0.981 |
3.03 × 10⁻² |
3.6.1. Effect of dopant concentration.
To examine the photocatalytic performance of pure TiO2 and doped TiO2 with various concentrations of Fe and Mn ranging from 1 to 7 mol%, the degradation of the CV dye in an aqueous suspension solution under UV light in the presence of ambient oxygen was examined. Fig. 13A and B illustrates the rate of decolorization of CV in the presence of pure TiO2 and Fe and Mn-doped TiO2 (dopant concentration ranging from 1 to 7 mol%). The figure demonstrates that doped TiO2 with different Fe and Mn dopant concentrations was more effective than pure TiO2, and it also demonstrates that 5% Fe–TiO2 and 7% Mn–TiO2 achieved the highest degradation of CV in comparison to other dopant concentrations and that the optimal time for degradation was 100 and 70 min, achieving 95.93% and 97%, respectively. Table 6 contrasts the primary degradation results with those of a few similar materials, highlighting their salient features and working conditions.
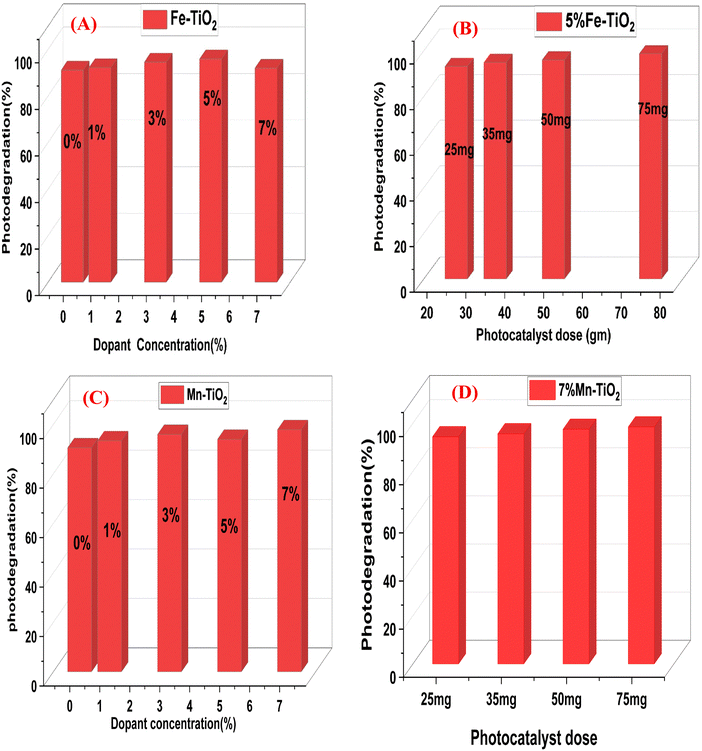 |
| | Fig. 13 Photocatalytic assessment of (A) Fe-doped TiO2 (at different Fe concentrations), (B) Mn-doped TiO2 (at different Mn concentrations), (C) 5% Fe-doped TiO2 (at different concentrations) and (D) 7% Mn–TiO2 (at different concentrations) for the decolorization of CV. | |
Table 6 Comparison of the photodegradation capabilities Fe–TiO2 and Mn–TiO2 for CV with those of several similar photocatalysts
| Photocatalyst |
Preparation method |
Degradation (%) |
Optimum conditions |
Ref. |
| Fe–TiO2 and Mn–TiO2 |
Solution combustion |
95.9 and 96.3 |
The initial concentration of CV dye is 20 mg L−1, the photocatalyst amount is 50 mg, T = 298 K, the contact time is 100 and 70 min and UV light is the light source |
This work |
| Au-reduced graphene oxide nanocomposite |
Repurposing electronic waste and dry batteries |
99% |
The initial concentration of CV dye is 10 mg L−1, pH = 10, the photocatalyst amount is 40 mg, T = 298 K, the contact time is 30 min and visible light is the light source |
8
|
| La-doped TiO2 |
Solution combustion |
95.98 |
The initial concentration of CV dye is 20 mg L−1, the photocatalyst amount is 50 mg, T = 298 K, the contact time is 70 min and UV light is the light source |
56
|
| Fe-doped TiO2 |
Reverse-micelle sol–gel |
96 |
The initial concentration of CV dye is 10 mg L−1, with 3 g L−1 photocatalyst amount, the contact time is 180 min and visible light is the light source |
65
|
| In2O3 nanocapsules |
Biogenic reflux method |
90 |
The initial concentration of CV dye is 10 mg L−1, with 0.1 g L−1 photocatalyst amount, the contact time is 180 min and visible light is the light source |
80
|
| Ag-doped TiO2 |
Hydrothermal method |
99 |
The initial concentration of CV dye is 20 mg L−1, with 1 g L−1 photocatalyst amount, the contact time is 105 min and UV light is the light source |
81
|
| p–n NiO–ZnO |
Homogeneous precipitation method |
100 |
The initial concentration of CV dye is 100 mg L−1, pH = 11, the photocatalyst amount is 0.1 g/50 mL, T = 298 K, the contact time is 180 min and UV light is the light source |
82
|
| ZnFe2O4 nanoparticles |
The co-precipitation oxidation method |
96 |
The initial concentration of CV dye is 10 ppm, pH = 7, the photocatalyst amount is 30 mg, T = 298 K, the contact time is 30 min and sun light is the light source |
83
|
3.6.2. Effect of photocatalyst amount.
Furthermore, the effectiveness of the photocatalytic degradation of different pollutants is similarly influenced by the amount of photocatalyst. It directly determines how easily contaminants can become entrapped at surface-active sites, thus influencing color removal efficiency.84 The photocatalytic activity of 5% Fe–TiO2 and 7% Mn–TiO2 (changing the amount from 25 mg to 75 mg), the most efficient catalyst concentrations among the other Fe and Mn concentrations, was tested for the degradation of CV, as shown in Fig. 13(C and D). 75 mg of the catalyst showed the maximum degradation compared to the other concentrations of 5% Fe–TiO2 and Mn–TiO2 (98.67% and 97.78% at 100 and 70 min, respectively). As shown in the figure, the degradation efficiency increased with increasing photocatalyst amount from 25 mg to 75 mg. This increase in the rate of degradation can be attributed to the higher amount of the photocatalyst, which produced a larger surface area and more active sites, improving the trapping of CV molecules.8
3.6.3. Effect of active species scavenging.
Superoxide radicals (˙O2−), positive holes (h+), and hydroxyl radicals (˙OH) were the active species whose roles were identified by observing changes in the photocatalytic degradation of CV following the addition of scavengers to the photocatalytic system. The variation in CV degradation before and after the scavengers were added to the photocatalytic system is depicted in Fig. 14. The degradation efficiency of CV with (3% La–TiO2, 5% Fe–TiO2, and 7% Mn–TiO2) was nearly the same with and without the addition of EDTA-2Na, which suggests that positive holes (h+) are not involved in the degradation of CV. When MA and AA were added, the degradation of CV decreased sharply, and the MA decreased from 92.5%, 82%, and 94.42% to 62%, 65%, and 65% in the presence of 3% La–TiO2, 5% Fe–TiO2, and 7% Mn–TiO2, respectively, in just 55 minutes. In terms of AA, the percentages decreased from 92.5%, 82%, and 94.42% to 53%, 55%, and 58%, respectively. Based on these findings, we may conclude that the primary active species throughout the photocatalytic process were hydroxyl radicals (˙OH) and superoxide radicals (˙O2−).
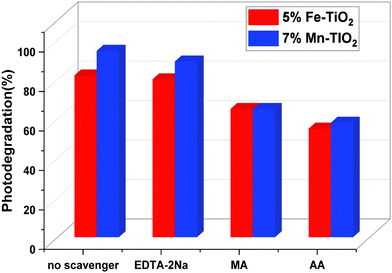 |
| | Fig. 14 Photocatalytic degradation of CV using 5% Fe–TiO2 and 7% Mn–TiO2 under UV light irradiation in the presence of various scavengers. | |
3.6.4. Photocatalytic degradation mechanism.
Crystal violet molecules can undergo direct or indirect photodegradation on the surface of doped TiO2. In direct photodegradation, crystal violet molecules directly interact with the photocatalyst surface and undergo oxidation reactions. Indirect photodegradation involves the reaction between crystal violet and reactive oxygen species (ROS) generated by a photocatalyst. During these reactions, the chromophoric groups of crystal violet, which are responsible for its color, are broken down into smaller, less colored fragments. Eventually, these fragments can mineralize into harmless inorganic compounds such as carbon dioxide, water, and inorganic ions.85
According to the photocatalytic degradation mechanism (eqn (6)–(13)), the photocatalytic degradation of CV using pure TiO2 or doped TiO2 involves the generation of reactive oxygen species (ROS) upon exposure to UV light. The ROS, such as hydroxyl radicals (˙OH), superoxide radicals (˙O2−), and holes (h+), can oxidize and breakdown CV molecules into smaller, less harmful compounds, which speeds up the fading of color. Reactive oxygen species, such as hydroxyl radicals (˙OH) and superoxide radicals (˙O2−), form as a result of the reaction of holes with hydroxide ions and the reaction of electrons with dissolved oxygen, respectively.86Fig. 15, which presents the suggested mechanism, illustrates this phenomenon. The process follows a pseudo-first-order rate law, where the degradation rate depends on the concentration of CV, catalyst amount, and light intensity.
| | | Dopant–TiO2 + hν → (ecb− + hvb+)@dopant–TiO2 | (6) |
| | | CV + OH˙ → degraded products | (12) |
| | | CV + O2−˙ → degraded products | (13) |
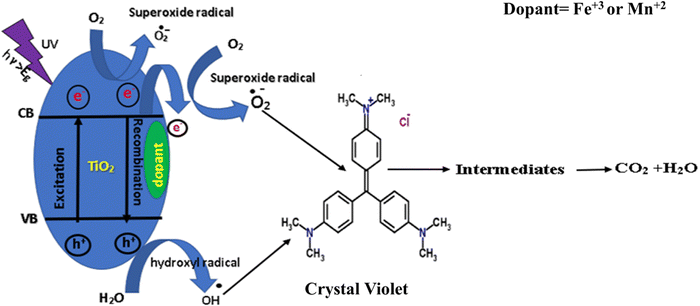 |
| | Fig. 15 Proposed mechanism of TiO2 with dopants for the photocatalytic decolorization of CV. | |
4. Conclusion
Both pure TiO2 and doped TiO2 with various amounts of Fe and Mn exhibited crystallinity, according to the XRD study, and the peaks of the anatase phase were dominant. In comparison to those of TiO2, Fe2O3, and Mn2O3, the photocatalytic activity of TiO2 with Fe and Mn dopant concentrations of 1%, 3%, 5%, and 7% was high. Compared to other dopant concentrations, TiO2 with dopant concentrations of 5% Fe and 7% Mn demonstrated the highest photocatalytic activity for the decolorization of the crystal violet dye. By increasing the amount from 25 mg to 75 mg, the photocatalytic efficiency of 5% Fe–TiO2 and 7% Mn–TiO2 increased, and an amount of 75 mg for both materials exhibited maximum degradation compared to the other amounts. With K = 2.91 × 10⁻² and 4.8 × 10⁻² min−1, 5% Fe–TiO2 and 7% Mn–TiO2 exhibited the highest rate constants of the reaction in comparison to the other dopant concentrations. It was found that superoxide and hydroxyl radicals were the primary active species during the photocatalytic process.
Note after first publication
Following the initial publication, a reader's comments led to revisions in the topological study. The authors had examined the topology, including Fig. 1 and 3, but it was decided to alter these figures after speaking with an expert. This version of the text reports an accurate analysis, and it also includes modified captions for Fig. 4, 5, 9 and 11. This new analysis is also reflected in the manuscript introduction and highlights the novelty of this topology.
Data availability
The datasets used and analyzed during the current study are available from the corresponding author upon reasonable request.
Conflicts of interest
There are no conflicts of interest to declare.
Acknowledgements
The corresponding author, “Gharieb M. Meselhy,” expresses his sincere gratitude to his spouse, “Shereen El Sheikh,” for her unwavering support.
References
- M. Y. Nassar, M. S. NourEldien, I. M. Ibrahim and H. M. Aly, A Facile Hydrothermal Synthesis of S-VO2-Cellulose Nanocomposite for Photocatalytic Degradation of Methylene Blue Dye, Processes, 2023, 11(5), 1322 CrossRef CAS.
- H. Liyanaarachchi, C. Thambiliyagodage, H. Lokuge and S. Vigneswaran, Kinetics and Thermodynamics Study of Methylene Blue Adsorption to Sucrose- and Urea-Derived Nitrogen-Enriched, Hierarchically Porous Carbon Activated by KOH and H3PO4, ACS Omega, 2023, 8(18), 16158–16173, DOI:10.1021/acsomega.3c00339.
- C. P. Liyanage and K. Yamada, Impact of population growth on the water quality of natural water bodies, Sustainability, 2017, 9(8), 1405 CrossRef.
- D. Chahar, D. Kumar, P. Thakur and A. Thakur, Visible light induced photocatalytic degradation of methylene blue dye by using Mg doped Co–Zn nanoferrites, Mater. Res. Bull., 2023, 162, 112205, DOI:10.1016/j.materresbull.2023.112205.
- N. Ali, A. Zada and M. Zahid,
et al., Enhanced photodegradation of methylene blue with alkaline and transition-metal ferrite nanophotocatalysts under direct sun light irradiation, J. Chinese Chem. Soc., 2019, 66(4), 402–408 CrossRef CAS.
- R. Beura, R. Pachaiappan and T. Paramasivam, Photocatalytic degradation studies of organic dyes over novel Ag-loaded ZnO-graphene hybrid nanocomposites, J. Phys. Chem. Solids, 2021, 148, 109689, DOI:10.1016/j.jpcs.2020.109689.
- P. Heidari and S. M. Masoudpanah, Structural, magnetic and optical properties and photocatalytic activity of magnesium-calcium ferrite powders, J. Phys. Chem. Solids, 2021, 148, 109681 CrossRef CAS.
- S. H. Al-Ansari, H. Gomaa, R. D. Abdel-Rahim, G. A. M. Ali and A. M. Nagiub, Recycled gold-reduced graphene oxide nanocomposite for efficient adsorption and photocatalytic degradation of crystal violet, Sci. Rep., 2024, 14(1), 1–16, DOI:10.1038/s41598-024-54580-1.
- Z. Yan, H. Yang and H. Dong,
et al., Occurrence and ecological risk assessment of organic micropollutants in the lower reaches of the Yangtze River, China: A case study of water diversion, Environ. Pollut., 2018, 239, 223–232 CrossRef CAS PubMed.
- W. H. Glaze, J. W. Kang and D. H. Chapin, The chemistry of water treatment processes involving ozone, hydrogen peroxide and ultraviolet radiation, Ozone: Sci. Eng., 1987, 9(4), 335–352 CrossRef CAS.
- L. F. Greenlee, D. F. Lawler, B. D. Freeman, B. Marrot and P. Moulin, Reverse osmosis desalination: water sources, technology, and today's challenges, Water Res., 2009, 43(9), 2317–2348 CrossRef CAS PubMed.
-
M. W. Jornitz, Filtration and Purification in the Biopharmaceutical Industry, CRC Press, 2019 Search PubMed.
- C. Thamaraiselvan and M. Noel, Membrane processes for dye wastewater treatment: recent progress in fouling control, Crit. Rev. Environ. Sci. Technol., 2015, 45(10), 1007–1040 CrossRef CAS.
- D. T. Santos, C. L. C. Albuquerque and M. A. A. Meireles, Antioxidant dye and pigment extraction using a homemade pressurized solvent extraction system, Procedia Food Sci., 2011, 1, 1581–1588 CrossRef CAS.
- P. Mondal, C. B. Majumder and B. Mohanty, Laboratory based approaches for arsenic remediation from contaminated water: recent developments, J. Hazard. Mater., 2006, 137(1), 464–479 CrossRef CAS PubMed.
- R. Al-Tohamy, S. S. Ali and F. Li,
et al., A critical review on the treatment of dye-containing wastewater: Ecotoxicological and health concerns of textile dyes and possible remediation approaches for environmental safety, Ecotoxicol. Environ. Saf., 2022, 231, 113160 CrossRef CAS.
- G. Mustafa, M. K. Aziz and L. Sharma,
et al., Synthesis and characterization of biocone-like ZNO nanoparticles as antibacterial agent and as photocatalyst for removal of hazardous methyl orange dye, J. Pharm. Negat. Results, 2023, 12, 5480–5490 Search PubMed.
- A. Habibi-Yangjeh, S. Asadzadeh-Khaneghah, S. Feizpoor and A. Rouhi, Review on heterogeneous photocatalytic disinfection of waterborne, airborne, and foodborne viruses: can we win against pathogenic viruses?, J. Colloid Interface Sci., 2020, 580, 503–514 CrossRef CAS PubMed.
- C. Thambiliyagodage, A. Kumara, M. Jayanetti, L. Usgodaarachchi, H. Liyanaarachchi and B. Lansakara, Fabrication of dual Z-scheme g-C3N4/Fe2TiO5/Fe2O3 ternary nanocomposite using natural ilmenite for efficient photocatalysis and photosterilization under visible light, Appl. Surf. Sci. Adv., 2022, 12, 100337, DOI:10.1016/j.apsadv.2022.100337.
- R. Mohammed, M. E. M. Ali, E. Gomaa and M. Mohsen, Promising MoS2–ZnO hybrid nanocomposite photocatalyst for antibiotics, and dyes remediation in wastewater applications, Environ. Nanotechnol., Monit. Manage., 2023, 19, 100772 CAS.
- H. M. Yates, M. G. Nolan, D. W. Sheel and M. E. Pemble, The role of nitrogen doping on the development of visible light-induced photocatalytic activity in thin TiO2 films grown on glass by chemical vapour deposition, J. Photochem. Photobiol., A, 2006, 179(1–2), 213–223 CrossRef CAS.
- D. Chen, Y. Cheng and N. Zhou,
et al., Photocatalytic degradation of organic pollutants using TiO2-based photocatalysts: A review, J. Cleaner Prod., 2020, 268, 121725 CrossRef CAS.
- X. Bao, Z. Qin, T. Zhou and J. Deng, In-situ generation of gold nanoparticles on MnO2 nanosheets for the enhanced oxidative degradation of basic dye (Methylene Blue), J. Environ. Sci., 2018, 65, 236–245 CrossRef CAS PubMed.
- M. Najjar, H. A. Hosseini and A. Masoudi,
et al., Green chemical approach for the synthesis of SnO2 nanoparticles and its application in photocatalytic degradation of Eriochrome Black T dye, Optik, 2021, 242, 167152 CrossRef CAS.
- S. Anbarasu, S. Ilangovan and K. Usharani,
et al., Visible light mediated photocatalytic activity of Ni-doped Al2O3 nanoparticles, Surf. Interfaces, 2020, 18, 100416 CrossRef CAS.
- A. Alagarsamy, S. Chandrasekaran and A. Manikandan, Green synthesis and characterization studies of biogenic zirconium oxide (ZrO2) nanoparticles for adsorptive removal of methylene blue dye, J. Mol. Struct., 2022, 1247, 131275 CrossRef CAS.
- G. V. Geetha, S. P. Keerthana, K. Madhuri and R. Sivakumar, Effect of solvent volume on the properties of ZnWO4 nanoparticles and their photocatalytic activity for the degradation of cationic dye, Inorg. Chem. Commun., 2021, 132, 108810 CrossRef CAS.
- M. Kristl, N. Sinanović, S. Gyergyek and J. Kristl, Sonochemical synthesis, characterization and photocatalytic activity of Bi2Mo3O12, Inorg. Chem. Commun., 2020, 112, 107699 CrossRef CAS.
- M. R. Al-Mamun, S. Kader, M. S. Islam and M. Z. H. Khan, Photocatalytic activity improvement and application of UV-TiO2 photocatalysis in textile wastewater treatment: A review, J. Environ. Chem. Eng., 2019, 7(5), 103248 CrossRef CAS.
- A. El Mragui, Y. Logvina, L. Pinto da Silva, O. Zegaoui and J. C. G. Esteves da Silva, Synthesis of Fe-and Co-doped TiO2 with improved photocatalytic activity under visible irradiation toward carbamazepine degradation, Materials, 2019, 12(23), 3874 CrossRef CAS PubMed.
- J. Choi, H. Park and M. R. Hoffmann, Effects of single metal-ion doping on the visible-light photoreactivity of TiO2, J. Phys. Chem. C, 2010, 114(2), 783–792 CrossRef CAS.
- H. Wang, N. Zhang and G. Cheng,
et al., Preparing a photocatalytic Fe doped TiO2/rGO for enhanced bisphenol A and its analogues degradation in water sample, Appl. Surf. Sci., 2020, 505, 144640 CrossRef CAS.
- A. J. Moreira, J. O. D. Malafatti and T. R. Giraldi,
et al., Prozac® photodegradation mediated by Mn-doped TiO2 nanoparticles: evaluation of by-products and mechanisms proposal, J. Environ. Chem. Eng., 2020, 8(6), 104543 CrossRef CAS.
- S. Ahadi, N. S. Moalej and S. Sheibani, Characteristics and photocatalytic behavior of Fe and Cu doped TiO2 prepared by combined sol–gel and mechanical alloying, Solid State Sci., 2019, 96, 105975 CrossRef CAS.
- R. Kaushik, P. K. Samal and A. Halder, Degradation of fluoroquinolone-based pollutants and bacterial inactivation by visible-light-active aluminum-doped TiO2 nanoflakes, ACS Appl. Nano Mater., 2019, 2(12), 7898–7909 CrossRef CAS.
- T. Umebayashi, T. Yamaki, T. Sumita, S. Yamamoto, S. Tanaka and K. Asai, UV-ray photoelectron and ab initio band calculation studies on electronic structures of Cr- or Nb-ion implanted titanium dioxide, Nucl. Instrum. Methods Phys. Res., Sect. B, 2003, 206, 264–267, DOI:10.1016/S0168-583X(03)00740-7.
- J. Yang and X. Luo, Ag-doped TiO2 immobilized cellulose-derived carbon beads: One-Pot preparation, photocatalytic degradation performance and mechanism of ceftriaxone sodium, Appl. Surf. Sci., 2021, 542, 148724 CrossRef CAS.
- M. Jahdi, S. B. Mishra, E. N. Nxumalo, S. D. Mhlanga and A. K. Mishra, Smart pathways for the photocatalytic degradation of sulfamethoxazole drug using F-Pd co-doped TiO2 nanocomposites, Appl. Catal., B, 2020, 267, 118716 CrossRef CAS.
- M. C. Ariza-Tarazona, J. F. Villarreal-Chiu and J. M. Hernández-López,
et al., Microplastic pollution reduction by a carbon and nitrogen-doped TiO2: Effect of pH and temperature in the photocatalytic degradation process, J. Hazard. Mater., 2020, 395, 122632 CrossRef CAS PubMed.
- Q. Gao, F. Si, S. Zhang, Y. Fang, X. Chen and S. Yang, Hydrogenated F-doped TiO2 for photocatalytic hydrogen evolution and pollutant degradation, Int. J. Hydrogen Energy, 2019, 44(16), 8011–8019 CrossRef CAS.
- P. Niu, G. Wu, P. Chen, H. Zheng, Q. Cao and H. Jiang, Optimization of boron doped TiO2 as an efficient visible light-driven photocatalyst for organic dye degradation with high reusability, Front. Chem., 2020, 8, 172 CrossRef CAS PubMed.
- A. Mancuso, O. Sacco and V. Vaiano,
et al., Visible light active Fe-Pr co-doped TiO2 for water pollutants degradation, Catal. Today, 2021, 380, 93–104, DOI:10.1016/j.cattod.2021.04.018.
- X. Zhang, W. F. Chen and G. Bahmanrokh,
et al., Synthesis of V-and Mo-doped/codoped TiO2 powders for photocatalytic degradation of methylene blue, Nano-Struct. Nano-Objects, 2020, 24, 100557 CrossRef CAS.
- K. Bhuvaneswari, R. D. Bharathi and T. Pazhanivel, Silk fibroin linked Zn/Cd-doped SnO2 nanoparticles to purify the organically polluted water, Mater. Res. Express, 2018, 5(2), 24004 CrossRef.
- L. Y. Yang, S. Y. Dong, J. H. Sun, J. L. Feng, Q. H. Wu and S. P. Sun, Microwave-assisted preparation, characterization and photocatalytic properties of a dumbbell-shaped ZnO photocatalyst, J. Hazard. Mater., 2010, 179(1–3), 438–443 CrossRef CAS PubMed.
- L. Radev, L. Pavlova and B. Samuneva,
et al., Sol–gel synthesis and structure of La2O3-CoO-SiO2 powders, Process. Appl. Ceram., 2008, 2(2), 103–108 CrossRef CAS.
- S. P. Kim, M. Y. Choi and H. C. Choi, Photocatalytic activity of SnO2 nanoparticles in methylene blue degradation, Mater. Res. Bull., 2016, 74, 85–89 CrossRef CAS.
-
M. Said, P. L. Hariani and I. Apriani, in Solution combustion method to synthesize magnetic Fe3O4 as photocatalytic of Congo red dye and antibacterial activity, IOP Conference Series: Earth and Environmental Science, IOP Publishing, 2021, vol. 926, p. 12050 Search PubMed.
- P. Chhillar and P. B. Doon, Facile synthesis and photophysical properties of combustion derived Dy3+ doped Ca9La(PO4)7 nanophosphors for advanced solid-state lighting applications, Inorg. Chem. Commun., 2024, 159, 111844, DOI:10.1016/j.inoche.2023.111844.
- V. K. Gupta, R. Jain and A. Mittal,
et al., Photo-catalytic degradation of toxic dye amaranth on TiO2/UV in aqueous suspensions, Mater. Sci. Eng., C, 2012, 32(1), 12–17 CrossRef CAS PubMed.
- A. K. Gupta, A. Pal and C. Sahoo, Photocatalytic degradation of a mixture of Crystal Violet (Basic Violet 3) and Methyl Red dye in aqueous suspensions using Ag+ doped TiO2, Dyes Pigm., 2006, 69(3), 224–232 CrossRef CAS.
- S. Ameen, M. S. Akhtar, M. Nazim and H. S. Shin, Rapid photocatalytic degradation of crystal violet dye over ZnO flower nanomaterials, Mater. Lett., 2013, 96, 228–232 CrossRef CAS.
- H. Tian, J. Ma, K. Li and J. Li, Photocatalytic degradation of methyl orange with W-doped TiO2 synthesized by a hydrothermal method, Mater. Chem. Phys., 2008, 112(1), 47–51 CrossRef CAS.
- J. Zhu, Y. Zhu, Y. Zhou, C. Wu, Z. Chen and G. Chen, Synergistic Promotion of Photocatalytic Degradation of Methyl Orange by Fluorine-and Silicon-Doped TiO2/AC Composite Material, Molecules, 2023, 28(13), 5170 CrossRef CAS PubMed.
- S. Lotfi, M. El Ouardi and H. A. Ahsaine,
et al., Low-temperature synthesis, characterization and photocatalytic properties of lanthanum vanadate LaVO4, Heliyon, 2023, 9(6), e17255 CrossRef CAS PubMed.
- G. M. Meselhy, M. Y. Nassar, I. M. Nassar and S. H. Seda, Auto-combustion synthesis of lanthanum-doped TiO2 nanostructures for efficient photocatalytic degradation of crystal violet dye, Mater. Res. Innov., 2024, 1–9 Search PubMed.
- B. D. Stojanovic, A. S. Dzunuzovic and N. I. Ilic, Review of methods for the preparation of magnetic metal oxides, Magn., Ferroelectr., Multiferroic Met. Oxides, 2018, 333–359, DOI:10.1016/B978-0-12-811180-2.00017-7.
- B. Niu, F. Zhang and H. Ping,
et al., Sol–gel Autocombustion Synthesis of Nanocrystalline High-entropy Alloys, Sci. Rep., 2017, 7(1), 3421, DOI:10.1038/s41598-017-03644-6.
- M. Y. Nassar, T. Y. Mohamed, I. S. Ahmed and I. Samir, MgO nanostructure via a sol–gel combustion synthesis method using different fuels: An efficient nano-adsorbent for the removal of some anionic textile dyes, J. Mol. Liq., 2017, 225, 730–740, DOI:10.1016/j.molliq.2016.10.135.
- S. Naraginti, Y. Li, Y. Wu, C. Zhang and A. R. Upreti, Mechanistic study of visible light driven photocatalytic degradation of EDC 17α-ethinyl estradiol and azo dye Acid Black-52: phytotoxicity assessment of intermediates, RSC Adv., 2016, 6(90), 87246–87257 RSC.
- Y. Fu, H. Chen, X. Sun and X. Wang, Combination of cobalt ferrite and graphene: High-performance and recyclable visible-light photocatalysis, Appl. Catal., B, 2012, 111–112, 280–287, DOI:10.1016/j.apcatb.2011.10.009.
- R. Hazime, C. Ferronato, L. Fine, A. Salvador, F. Jaber and J. M. Chovelon, Photocatalytic degradation of imazalil in an aqueous suspension of TiO2 and influence of alcohols on the degradation, Appl. Catal., B, 2012, 126, 90–99, DOI:10.1016/j.apcatb.2012.07.007.
- D. A. H. Hanaor and C. C. Sorrell, Review of the anatase to rutile phase transformation, J. Mater. Sci., 2011, 46(4), 855–874, DOI:10.1007/s10853-010-5113-0.
- W. Guan, F. Ji, Z. Xie, R. Li and N. Mei, Preparation and photocatalytic performance of nano-TiO2 codoped with iron III and lanthanum III, J. Nanomater., 2015, 2015, 4 Search PubMed.
- A. Mancuso, N. Blangetti and O. Sacco,
et al., Photocatalytic Degradation of Crystal Violet Dye under Visible Light by Fe-Doped TiO2 Prepared by Reverse-Micelle Sol–Gel Method, Nanomaterials, 2023, 13(2) DOI:10.3390/nano13020270.
- A. N. El-Shazly, G. S. El-Sayyad and A. H. Hegazy,
et al., Superior visible light antimicrobial performance of facet engineered cobalt doped TiO2 mesocrystals in pathogenic bacterium and fungi, Sci. Rep., 2021, 11(1), 1–14, DOI:10.1038/s41598-021-84989-x.
- D. A. Solís-Casados, L. Escobar-Alarcón, L. M. Gómez-Oliván, E. Haro-Poniatowski and T. Klimova, Photodegradation of pharmaceutical drugs using Sn-modified TiO2 powders under visible light irradiation, Fuel, 2017, 198, 3–10 CrossRef.
- A. K. Tripathi, M. C. Mathpal, P. Kumar, M. K. Singh, M. A. G. Soler and A. Agarwal, Structural, optical and photoconductivity of Sn and Mn doped TiO2 nanoparticles, J. Alloys Compd., 2015, 622, 37–47 CrossRef CAS.
- J. Liqiang, S. Xiaojun, X. Baifu, W. Baiqi, C. Weimin and F. Honggang, The preparation and characterization of La doped TiO2 nanoparticles and their photocatalytic activity, J. Solid State Chem., 2004, 177(10), 3375–3382 CrossRef.
- M. Umair, D. Kim and M. Choi, Impact of climate, rising atmospheric carbon dioxide, and other environmental factors on water-use efficiency at multiple land cover types, Sci. Rep., 2020, 10(1), 1–13 CrossRef PubMed.
- J. Zhu, J. Zhang, F. Chen, K. Iino and M. Anpo, High activity TiO2 photocatalysts prepared by a modified sol–gel method: characterization and their photocatalytic activity for the degradation of XRG and X-GL, Top. Catal., 2005, 35, 261–268 CrossRef CAS.
- M. M. Mahlambi, A. K. Mishra, S. B. Mishra, R. W. Krause, B. B. Mamba and A. M. Raichur, Comparison of rhodamine B degradation under UV irradiation by two phases of titania nano-photocatalyst, J. Therm. Anal. Calorim., 2012, 110(2), 847–855 CrossRef CAS.
- X. Lin, J. Xing, W. Wang, Z. Shan, F. Xu and F. Huang, Photocatalytic activities of heterojunction semiconductors Bi2O3/BaTiO3: a strategy for the design of efficient combined photocatalysts, J. Phys. Chem. C, 2007, 111(49), 18288–18293 CrossRef CAS.
- S. M. Y. Qattali, J. Nasir and C. Pritzel,
et al., Synthesis and Characterization of Iron-Doped TiO2 Nanotubes (Fe/TiNTs) with Photocatalytic Activity, Constr. Mater., 2024, 315–328 Search PubMed.
- A. Mancuso, O. Sacco and V. Vaiano,
et al., Visible Light-Driven Photocatalytic Activity and Kinetics of Fe-Doped TiO2 Prepared by a Three-Block Copolymer Templating Approach, Materials, 2021, 14(11) DOI:10.3390/ma14113105.
- L. T. Jule, F. B. Dejene and A. G. Ali,
et al., Wide visible emission and narrowing band gap in Cd-doped ZnO nanopowders synthesized via sol–gel route, J. Alloys Compd., 2016, 687, 920–926, DOI:10.1016/j.jallcom.2016.06.176.
- S. Kader, M. R. Al-Mamun, M. B. K. Suhan, S. B. Shuchi and M. S. Islam, Enhanced photodegradation of methyl orange dye under UV irradiation using MoO3 and Ag doped TiO2 photocatalysts, Environ. Technol. Innov., 2022, 27, 102476, DOI:10.1016/j.eti.2022.102476.
- M. Zheng, H. Zhang and X. Gong,
et al., A simple additive-free approach for the synthesis of uniform manganese monoxide nanorods with large specific surface area, Nanoscale Res. Lett., 2013, 8, 1–7 CrossRef PubMed.
- F. Davar, H. Hadadzadeh and T. S. Alaedini, Single-phase hematite nanoparticles: Non-alkoxide sol–gel based preparation, modification and characterization, Ceram. Int., 2016, 42(16), 19336–19342, DOI:10.1016/j.ceramint.2016.09.104.
- K. K. Pawar, L. S. Chaudhary and S. S. Mali,
et al., In2O3 nanocapsules for rapid photodegradation of crystal violet dye under sunlight, J. Colloid Interface Sci., 2020, 561, 287–297 CrossRef CAS PubMed.
- C. Sahoo, A. K. Gupta and A. Pal, Photocatalytic degradation of Crystal Violet (CI Basic Violet 3) on silver ion doped TiO2, Dye Pigm., 2005, 66(3), 189–196 CrossRef CAS.
- M. Saeed, K. Albalawi and I. Khan,
et al., Synthesis of p–n NiO–ZnO heterojunction for photodegradation of crystal violet dye, Alexandria Eng. J., 2023, 65, 561–574, DOI:10.1016/j.aej.2022.09.048.
- H. Bayahia, High activity of ZnFe2O4 nanoparticles for photodegradation of crystal violet dye solution in the presence of sunlight, J. Taibah. Univ. Sci., 2022, 16(1), 988–1004, DOI:10.1080/16583655.2022.2134696.
- D. Gholami, S. Shahbazi and S. Mosleh,
et al., In situ growth of CuFeS2/CuS bridged heterojunction catalyst with mixed redox-couple cations for excellent photocatalytic degradation of organophosphate insecticide: CFD and DFT modeling, Chem. Eng. J., 2023, 461, 141950, DOI:10.1016/j.cej.2023.141950.
- Y. Chen, X. Deng, J. Wen, J. Zhu and Z. Bian, Piezo-promoted the generation of reactive oxygen species and the photodegradation of organic pollutants, Appl. Catal., B, 2019, 258, 118024, DOI:10.1016/j.apcatb.2019.118024.
- N. T. Nandhini, S. Rajeshkumar and S. Mythili, The possible mechanism of eco-friendly synthesized nanoparticles on hazardous dyes degradation, Biocatal. Agric. Biotechnol., 2019, 19, 101138, DOI:10.1016/j.bcab.2019.101138.
|
| This journal is © The Royal Society of Chemistry 2024 |
Click here to see how this site uses Cookies. View our privacy policy here.  Open Access Article
 *ab,
Mostafa Y.
Nassar
bc and
Sabry H.
Seda
b


![[thin space (1/6-em)]](https://www.rsc.org/images/entities/char_2009.gif) sin
sin![[thin space (1/6-em)]](https://www.rsc.org/images/entities/char_2009.gif) θ = λ
θ = λ

![[3 with combining macron]](https://www.rsc.org/images/entities/char_0033_0304.gif) C (167), lattice constants a = 5.038 and c = 13.776, JCPDS card: 01-073-3825). The Debye–Scherrer equation was used to calculate the average crystallite size of the produced Fe2O3 nanoparticles, which was found to be approximately 48.96 nm.
C (167), lattice constants a = 5.038 and c = 13.776, JCPDS card: 01-073-3825). The Debye–Scherrer equation was used to calculate the average crystallite size of the produced Fe2O3 nanoparticles, which was found to be approximately 48.96 nm.![[3 with combining macron]](https://www.rsc.org/images/entities/char_0033_0304.gif) (206), lattice constant a = 9.414, and JCPDS card: 01-071-0636). The average crystallite size of the produced Mn2O3 nanoparticles was calculated using the Debye–Scherrer equation and was found to be approximately 45.57 nm.
(206), lattice constant a = 9.414, and JCPDS card: 01-071-0636). The average crystallite size of the produced Mn2O3 nanoparticles was calculated using the Debye–Scherrer equation and was found to be approximately 45.57 nm.


