 Open Access Article
Screen-printed wearable sensors for continuous respiratory rate monitoring: fabrication, clinical evaluation, and point-of-care potential†
Ala’aldeen
Al-Halhouli
 *ab,
Ahmed
Albagdady
 ac,
Alexander
Rabadi
d,
Musab
Hamdan
a,
Jumana
Abu-Khalaf
 e and
Mahmoud
Abu-Abeeleh
 f
f
aGerman Jordanian University, Amman 11180, Jordan. E-mail: alaaldeen.alhalhouli@gju.edu.jo
bInstitute of Microtechnology, Technische Universität Braunschweig, Braunschweig 38124, Germany
cCentre for Intelligent Healthcare, Coventry University, Coventry, UK
dInternal Medicine, Mclaren Flint/MSU College of Medicine, Michigan, USA
eCentre for Artificial Intelligence and Machine Learning, School of Science, Edith Cowan University, Joondalup, WA 6027, Australia
fDepartment of General Surgery, School of Medicine, The University of Jordan, Amman 11942, Jordan
First published on 12th November 2024
Abstract
In this paper, we investigated the use of screen printing for the fabrication of a non-invasive wearable sensor, aimed at achieving accurate and continuous measurement of respiratory rate. The developed sensor was clinically evaluated on 15 healthy human participants, demonstrating its potential for point-of-care testing. Wearable sensors are emerging as the future of continuous healthcare monitoring by recording crucial physiological parameters that can be processed to monitor existing health conditions and predict future ones. Having a reliable tool to monitor respiratory rate is extremely valuable for healthcare professionals since it can indicate disease progression under certain conditions like COPD (chronic obstructive pulmonary disease) and COVID-19. The developed sensor was printed on a stretchable substrate consisting of repeated silver horseshoe patterns to avoid stress concentration and ensure conductivity at higher strains. By tracking changes in electrical resistance under strain, the sensor derived respiration frequency when placed on the chest. The clinical evaluation involved testing the sensor on 15 healthy human participants, aged 21–24, in sitting, standing, and Fowler's 45° positions, and a temperature-based airflow sensor was used as a reference. The screen-printed sensor accurately measured the respiratory rates with an error of 0.055 breaths per minute (bpm) demonstrating its accuracy and potential for point-of-care healthcare applications.
Introduction
Respiratory rate (RR) is the number of breaths taken in a minute, measured by the movement of the chest and abdomen and is gender-specific. This movement either starts from the abdomen, then the chest in males or it starts with the movement of the thoracic cage and then the abdominal muscles in females.1 Affordable and clinically validated solutions to measure RR can be pivotal in addressing health inequalities, particularly given that respiratory diseases are more strongly linked to poverty compared to other health conditions.2,3 RR is one of the essential vital signs that can be found on every patient's chart and can be one of the earliest signs of sepsis (shock and loss of ability to maintain normal organ function) where tachypnoea is observed.4 In adults, a normal RR is between 12 and 20 bpm, while a measurement of over 20 breaths is called tachypnoea. Most commonly, RR is measured manually which introduces the risk of human error and lacks accuracy. Additionally, measuring the respiratory rate by counting individual breaths gives little to no indication of the breathing pattern and the shape of the waveform. Hence, a new method that overcomes these limitations is needed.5A systematic review by Ginsburg et al.6 summarized the different methods utilized to measure the RR. Those methods were classified into manual and automatic methods, where manual methods included counting with timers or beads, which is the method commonly used in clinical settings. Automatic methods measure the RR by measuring some physical properties attributed to respiration like changes in temperature, humidity, CO2, sound, or thoracic movement. The automatic methods have the advantage of being recordable as all physical attributes mentioned can be monitored with high accuracy using modern sensors. Non-contact RR measurement can be achieved through thermal imaging, and Cho et al.7 discussed using a thermal camera to measure the temperature changes under the nostrils. Badshah et al.8 demonstrated a non-contact method by utilizing ultra-wideband radar (UWB) to measure subtle changes in chest movement during breathing.
The ideal measurement method should be real-time, cost-efficient, reliable and capable of providing continuous monitoring. Wearable sensors allow for continuous monitoring of physical, chemical and electrophysiological parameters with minimal discomfort to the human body featuring wireless connectivity and autonomy.9,10 Recent advances in polymers, soft lithography and 3D printing, have enabled the fabrication of stretchable biocompatible materials that conform to the three-dimensional curvature of the human skin.11 Moreover, the deposition of conductive nanomaterials onto such stretchable substrates results in a unique circuitry that can remain conductive under certain amounts of strain. Materials such as carbon nanotubes,12 gold nanomaterials,13 silver nanowires14 and silver nanoparticles14 have been reported to be used for sensing various parameters. Printing has emerged as a simple and effective method to deposit conductive materials on flexible and stretchable substrates. The most common methods are inkjet printing and screen printing,15,16 as outlined by Al-Halhouli et al.17 Screen printing selectively forces viscous ink through a fine mesh screen onto a substrate, guided by a stencil or pattern that blocks the ink in specific areas while allowing it to pass through others. This process transfers the desired design or pattern onto the underlying substrate.18–20 In contrast to inkjet printing, screen printing does not require special equipment and a simple sensor can be printed using a kit for under $40 USD. Furthermore, screen-printable conductive inks are more available and affordable than their inkjet counterparts due to their use in multiple industries. It is performed by selectively passing viscous ink through a fine mesh. Screen printing has also been used in many electrochemical biosensors for sweat,21 blood,22 glucose23 and uric acid24 measurements.
In this paper, we report the fabrication and clinical evaluation of a novel stretchable screen-printed RR sensor outlining the sensor design, fabrication process, clinical evaluation, and data analysis.
Materials and methods
The contraction and relaxation of the diaphragm drive the airflow in and out of the lungs during breathing, creating continuous and detectable movements in the chest and abdomen. The respiratory rate sensor introduced in this work was developed to act as a strain-dependent resistor as resistive measurement is known to be cost-effective and durable and offers a wide measurement range. When attached to the chest, this sensor measures the cyclic strain, which directly correlates with the respiratory rate. The process from design to a working wearable sensor involves several steps depending on the fabrication method. In screen printing, this involves pattern design, substrate preparation, screen and mesh preparation, screen printing, sensor assembly and conditioning circuit design. Depending on the scale of the printed lines and the substrate sensitivity, working in a clean environment may be required, as dust particles can disturb the dispersion of ink through the screen's mesh openings. Furthermore, accumulated dust can compromise the surface activation of the substrate after plasma etching as will be discussed in the next section. Although a full cleanroom is not required, maintaining a regulated laboratory environment would be sufficient. The ink used is a highly conductive and highly flexible silver ink (CI-1036, Nagase ChemteX America Corp, USA) and the screen resolution was selected, as recommended by the ink's supplier, to be 156–206 (threads per inch) for polyester meshes; therefore, a 160 TPI screen with an aluminium frame was chosen.Substrate preparation
The sensor utilized a silicone polymer known as polydimethylsiloxane (PDMS) as its base. PDMS confers a range of advantageous properties to the sensor, including stretchability, chemical inertness, biocompatibility, gas permeability, and optical transparency.25 These characteristics make PDMS an optimal choice for a wearable sensor. To attach the sensor to a wearable strap, two 100 × 40 mm rectangular black fabric pieces, cut with a laser cutter (Bodor, China), were embedded in liquid PDMS. The PDMS mould was CNC machined as a 1 mm thick rectangular groove of size 180 × 40 mm in a 180 × 60 mm acrylic piece. 40 × 40 mm detachable sides were placed in the mould on top of the fabric pieces to secure them. The substrate was made from PDMS (Dow Corning® Sylgard 184, Midland, MI, USA), and it comes in two parts, a base material and a curing agent. The ratio of mixing determines multiple important factors in the resulting mechanical properties of the substrate such as density and Young's modulus.26,27 For this study, a ratio of 10![[thin space (1/6-em)]](https://www.rsc.org/images/entities/char_2009.gif) :
:![[thin space (1/6-em)]](https://www.rsc.org/images/entities/char_2009.gif) 1 of the base material to curing agent was chosen as recommended in earlier works.28,29 The PDMS mixture was then placed in a vacuum chamber for 10 minutes allowing the entrapped air to be released. Afterwards, 4 ml of the mixture was slowly poured into the mould and placed on a flat surface to settle and fill the mould, and then the mould was placed in an oven at 100 °C for 20 minutes for the PDMS to cure.
1 of the base material to curing agent was chosen as recommended in earlier works.28,29 The PDMS mixture was then placed in a vacuum chamber for 10 minutes allowing the entrapped air to be released. Afterwards, 4 ml of the mixture was slowly poured into the mould and placed on a flat surface to settle and fill the mould, and then the mould was placed in an oven at 100 °C for 20 minutes for the PDMS to cure.
PDMS is hydrophobic in nature which makes it challenging to print on directly, as ink droplets would aggregate together instead of sticking to the substrate surface. To solve this issue, the substrates were oxygen plasma etched (Diener electronic GmbH, Ebhausen, Germany) for 2 minutes at a maximum power (50 W) to activate the surface and make it hydrophilic. However, the hydrophilic effect only lasts 15–30 minutes depending on the exposure level to dust particles or fingerprints. Therefore, substrate handling was performed in a clean environment for higher yields. The hydrophilicity can be tested by dispensing a drop of water on the treated substrate and examining its contact angle.
Screen preparation
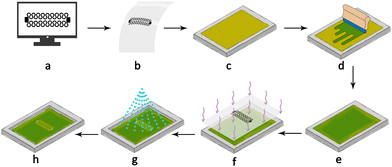
The selection of an appropriate screen for a specific application involves considering various factors, including the screen's colour, thread resolution in threads per inch (TPI), and the screen tension force. Higher thread resolution results in more detailed prints and supports smaller features. However, this is often limited by the ink's viscosity, as it must pass through the small mesh openings of high-resolution screens. As seen in Fig. 1, the first step in creating a screen was the pattern design using computer-aided design tools such as AutoCAD (Autodesk, San Rafael, CA, USA). Subsequently, the pattern was printed onto a transparent sheet of paper using a laser printer or, preferably, a solid ink printer to ensure mask stability. To make the screen stencil, the screen was coated with a photoemulsion (Jacquard, Rupert, Gibbon & Spider, Inc., USA) which is a light-sensitive emulsion that solidifies when exposed to light, and the coating was done manually using a squeegee to spread a thin and even film. The screen was then left to dry in a dark and dry environment for at least 12 hours. The mask was fixed on top of the dried emulsion with paper tape and placed under the sun for 20 seconds until fully exposed. The exposed screen was then washed with a high-pressure water shower to remove the unexposed emulsion and left to dry again under sunlight. Yellow mesh screens absorb the light better than white ones and protect the design from indirect exposure where the edges of the design can be exposed unintentionally due to light scattering off the threads. However, their downside is that they require an increased curing time of up to 150% in comparison to white meshes.Pattern design
A successful stretchable circuit should maintain conductivity under strain, which is a challenging task for wearable sensors as strain-related stress causes cracks in the printed lines leading to disconnections. However, the pattern's shape can enhance the maximum conductive strain by changing the location of stress concentration points that lead to disconnections. A finite element study by Norhidayah et al.30 analysed straight, zigzag and horseshoe patterns, and the stress analysis showed that the horseshoe pattern had the least stress concentration and therefore would be ideal for stretchable circuits. Previous work on inkjet-printed patterns showed that straight lines can disconnect under a strain as low as 4%, while horseshoe patterns can withstand up to 19%.28,31 The design was updated and improved from a previously inkjet-printed version,28 and the changes included reducing the width of the horseshoe line from 2 mm to 1.5 mm to increase the sensitivity of the sensor and expanding the area of the connection pads to ensure a secure connection between the sensor and the external circuitry. Fig. 2 shows the sensor design consisting of two sets of 8-and-a-half horseshoe cycles connected in parallel at the connection pads, and the parallel design maintains the connection even if one side gets disconnected. In the application of creating a stretchable sensor, many designs can return a signal good enough for interpretation. However, aiming towards a clean signal with a high signal/noise ratio can simplify the signal postprocessing including filtering, gain and offset adjustment.Sensor assembly
Before commencing screen printing, the silver ink temperature must be around room temperature to reach the required viscosity and therefore pass freely through the mesh openings. It can be difficult to align the print on the substrate when the screen is blocking the view, so an A4 sheet of paper with the pattern design printed on it is placed on the table; this serves to ensure the best alignment between them since the pattern can be seen through the screen. After the printing process was finished, the screen was cleaned from the excess ink for future use. The ink is reusable and can be poured back into a secondary container. The screen can be cleaned with methyl ethyl ketone (MEK), which acts as a solvent for the silver ink and makes the screen easier to clean. It is essential to use MEK inside a chemical fume hood for its possible harmful effects on human health.Screen printing
The strap fabric was placed in the mould before pouring the liquid PDMS to make it part of the substrate instead of attaching it after moulding. After the PDMS substrate was plasma etched, the ink was poured on the screen under the pattern (the open stencil mesh where the ink would pass through) and then gently wiped with a flat edge squeegee upwards over the pattern on the screen to spread the ink evenly covering the design. Finally, the squeegee was swept with slight pressure on the screen forcing the ink through the mesh openings. Afterwards, the screen was slowly lifted to reveal the printed pattern on the substrate, and the sensor was then placed in an oven at 100–120 °C for 2 hours. After the primary layer of the sensor was ready, a drop of Galinstan (68.5% Ga, 21.5% In, and 10.0% Sn) liquid metal was placed on each connection to provide a conductive surface for the conductive threads to be connected to and sustain conductivity under strain without any rigid connections.32 To contain the Galinstan and prevent it from spilling, it was sealed with a drop of liquid PDMS as can be seen in Fig. 3. The printed silver ink degrades over time due to exposure to environmental conditions and oxidation, which leads to an increase in resistance and discolouration. Therefore, the sensor was coated with a thin protective PDMS layer. Plastic release buckle clips are sewn onto the side fabric pieces, allowing an additional belt to be attached and securely fasten the sensor around the chest. More details about the fabrication process are found in Fig. S1–S3 in the ESI.†Conditioning circuit
A single-element varying Wheatstone bridge configuration was used to convert the change in resistance into a voltage readable using a microcontroller, and the sensor was placed as the variable resistor with two other fixed resistors, whose values are similar to the sensor at the rest position. The third resistor was a 10-fold trimmer potentiometer placed to adjust the offset prior to recording measurements. Due to the low resistance of the sensor, the configuration exhibits high power consumption when supplied with 5 V. A resistor was placed in series to the bridge to reduce the voltage at the junction, thereby decreasing the current. This reduction in power consumption significantly lowered the resulting output voltage, rendering it barely readable using a microcontroller with an 8-bit ADC (analogue to digital converter); therefore, the output voltage was amplified using a single-supply AD623 instrumentation amplifier with a potentiometer connected to its gain resistance inputs.Signal processing and data curation
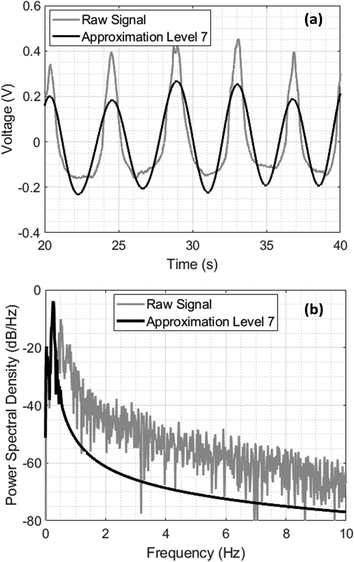
The recorded signals were clean, allowing for the extraction of their fundamental frequencies using fast Fourier transform (FFT) without any prior filtration. Nevertheless, applying filters to these signals can yield additional information on the breathing patterns and the nature of the respiratory signals. The DC offset was eliminated using the ‘detrend’ command in MATLAB (R2019b, MathWorks Inc., Natick, MA, USA). This step is crucial to remove the peak at 0 Hz that would otherwise appear when plotting the power spectral density. The signal was then subjected to a wavelet transform, allowing for the decomposition of the signal into different frequency components at various scales. This approach enables the extraction of fine details at high frequencies and coarse approximations at low frequencies. The selection of the decomposition level determines the frequency range of the extracted components. In the case of the RR analysis, the goal is to cover the normal respiration frequency range of 0.2–0.33 Hz. With a sampling frequency of 100 Hz, using Level 7 decomposition would provide an approximation component with a frequency range of 0–0.397 Hz, since the Nyquist frequency is 50 Hz and each decomposition level halves the frequency band. Fig. 4 shows the raw signal before and after level 7 wavelet decomposition, Fig. 4a shows the filtered signal and Fig. 4b shows the power spectral density of the resulting signal in comparison to the raw signal, showing superior filtering of high frequencies. The DC shift and any frequencies below 0.1 Hz were also disregarded. The frequency resolution was 0.0166 Hz since the number of data points was 6000 and the sampling frequency was 100 Hz.Results and discussion
Printed pattern validation
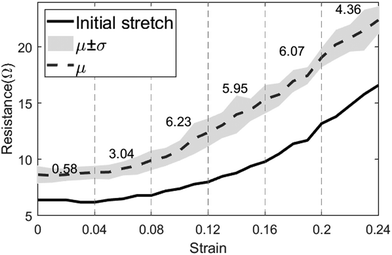
Measuring the RR requires the sensor to be able to withstand relatively high strains as the volumetric strain of the chest varies between people depending on the effectiveness of the respiration system. The strain–resistance curve represents the dynamic range of the sensor and its ability to remain conductive after being subjected to strain. The sensor was fixed on a vice with 3D-printed magnetic holders and a right-angle ruler between its jaws to keep track of strain changes. In each measurement step, a 1 mm (1% as well since the initial length was 100 mm) strain increment was added, and the resistance was measured. Fig. 5 shows the resistance–strain curve of the horseshoe pattern adopted for RR measurement. The gauge factor (GF) of the sensor was calculated in 6 different intervals of strain to determine the ideal range of operation using the following formula:where ΔR represents the change in resistance between two corresponding strain values (ε) and R0 is the initial resistance. For strains lower than 4%, resistance changes were barely visible, and the gauge factor was almost 0. However, the sensitivity increases between 4 and 8% strain and can be sufficient for reliable readings. After 8%, the sensitivity starts to increase significantly with its peak being in the strain range of 8–20% with a gauge factor reaching 6.23. Deriving the gauge factor in multiple intervals can improve the sensor's response drastically when testing on human participants. The sensor can be pre-stretched when mounted on the chest to avoid the low-sensitivity region and to ensure that the sensor is always in a stretching position. It was noticed that the initial test was slightly shifted below the consecutive 4 tests as can be seen in Fig. 5. To investigate this observation, a stretched-then-released and an un-stretched sample were examined under a scanning electron microscope (VEGA 3, TESCAN, Czech Republic). Stretching the sensor causes microcracks to appear in stress concentration segments of the pattern, thereby reducing the sensing effective area and increasing the resistance. As long as the cracks do not result in physical disconnection in the printed conductive lines, the sensor can remain functional but may exhibit a different response when subjected to the same strain. In most cases, the sensor can regain conductivity when relaxed after stretching it to a point that is higher than the breakout strain. Fig. 6 shows the scanning electron microscopy (SEM) images for an unstretched (Fig. 6a) and a stretched-then-relaxed (Fig. 6b) sample. It can also be concluded that the introduction of a strain that has not been previously experienced by the sensor may change the sensor's strain–resistance curve during normal operation.
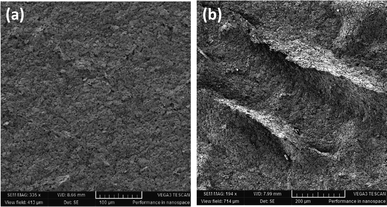 | ||
| Fig. 6 SEM images for screen printed pattern investigation: (a) an unstretched sample and (b) a stretched-then-relaxed sample. | ||
Sensor testing and evaluation on human participants
The study was conducted at Jordan University Hospital on healthy volunteers who were selected randomly to participate after acquiring IRB approval (ref. 10-2021-4348). Following an introduction to the importance of the study and the ability to withdraw at any point, they were given a questionnaire and 2 IRB forms (The hospital ethics committee IRB form and an international IRB form) to fill out. The questionnaire's main goal was to collect demographic data (age, gender, height, and weight), previous medical history, any related surgeries or chest deformities, and chronic drug use.A temperature-based airflow sensor (e-Health Sensor Shield – Libelium) was used as a reference. The sensor was positioned under the nostrils to record the changes in breathing air temperature that result during inhalation or exhalation, while the screen-printed sensor was strapped on the upper abdomen area. After the participant rested in a seated position, both sensors were attached, and the RR was measured for one minute. Next, the volunteer stood up and measurements were repeated. Finally, the volunteer lies in a recombinant position and the measurements were repeated for the third and final time. Different postures mimic the most common resting positions. In the future, a study validating the sensor while in motion is required. Volunteers were approached to increase the probability of having a clear medical history. Thus, the selected age group clustered in the early to mid-’20s while the selection criteria remained that of a random convenience sampling. All measurements were collected with both sensors connected via cables to a laptop. A custom MATLAB Simulink program was created to record the measurements and store the experiment's demographic data. Fig. 7 illustrates a representative recording obtained from subject #2 while in a standing posture. It is noteworthy that the airflow sensor is out of phase when compared to the printed sensor. This disparity arises due to the inherent characteristics of the measured quantities, as during inhalation, the temperature decreases causing a drop in the temperature sensor reading, while the chest volume increases leading to a corresponding increase in the strain sensor length and its resistance. All data were organized into a database with each participant assigned a unique number to correlate the recorded measurements with the collected demographic data. Measurements were recorded from 18 participants, though 3 were excluded due to medical histories that directly impact their respiratory health. Fig. S4 in the ESI† demonstrates a participant in a seated position with the sensor attached.
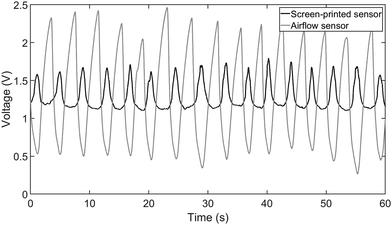 | ||
| Fig. 7 A recording from subject #2 while being in a standing position, showing the recorded signals from the screen-printed respiratory rate sensor and the reference airflow temperature sensor. | ||
Bland-Altman analysis
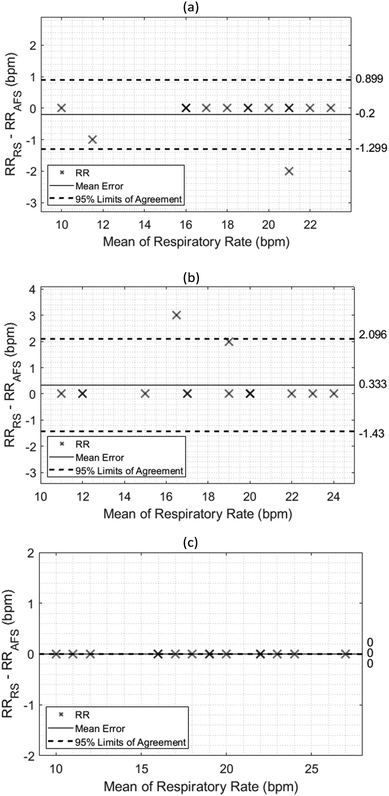
Plotting the agreement between the fabricated screen printed sensor and the airflow sensor is crucial to demonstrate the measurement error at each posture and assess the reliability of the sensor by comparing it with the reference sensor. This test can be done by using a Bland-Altman method.33 A total of 15 participants took part in this study and measurements were recorded in sitting, standing and Fowler's 45° positions. As seen in Fig. 8, the limits of agreements (LoAs) for all three postures were relatively low compared to the inkjet-printed counterpart which in a previous study achieved average 95% LoAs of 4.968 ± 2.672 and −5.393 ± 3.166 (upper LoA and lower LoA),34 while this work achieved average LoAs of 0.998 ± 1.051 and −0.910 ± 0.791. Additionally, the sensor was less sensitive to the participant's posture as the standard deviation was quite small in comparison to the previous work.34 In Fowler's 45° position, the bias and 95% LoA were both zero, while the highest ones were found to be from the standing position.Regression analysis
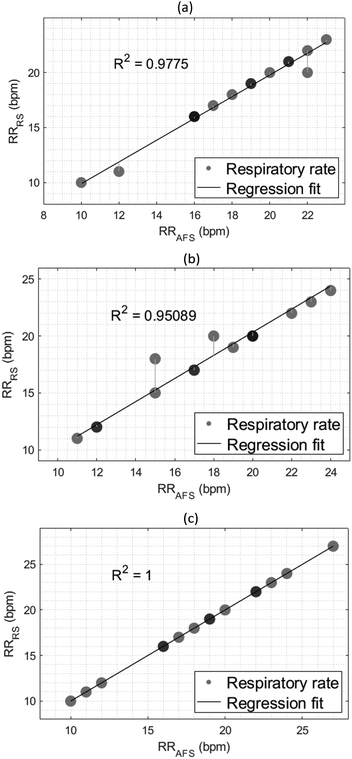
The linear correlation between the RRs obtained from both the developed sensor and the reference airflow sensor was conducted by plotting a regression plot and deriving the regression coefficient. Fig. 9 shows the corresponding regression plots at different body postures, and all three regression coefficients show a high linearity and a strong relationship between the variables. The highest coefficient of determination (R2) value was in Fowler's 45° position and the lowest in the standing position achieving values of 1 and 0.9775, respectively, matching the results from the Bland-Altman analysis.Error analysis
The resulting overall sensor error and standard deviation were calculated to be 0.044 ± 0.6379 bpm. In Fowler's 45° position, the error was zero and the derived respiratory rates from the reference airflow sensor perfectly matched those from the screen-printed sensor, whereas in both sitting and standing positions, the error was higher but still achieved high R2 values indicating a strong relationship between the developed and reference sensors. In both standing and seated postures, the sensor would not be supported from the participant's body, and only held in place by the belt's tension. Consequently, any small movement or loosening of the belt could lead to sensor buckling, introducing potential inaccuracies in measurements. Two high amplitude peaks were found upon investigating the power spectral density (PSD) of the tests with errors higher than 0%, and there appears to be another frequency with a higher power than the respiration frequency. Fig. 10 shows the power spectral density function of the screen-printed sensor during a standing test for subject #14. Peak 1 corresponds to the frequency with the highest power; however, peak 2 is the amplitude that perfectly matches the fundamental frequency of the corresponding airflow sensor signal. The causes of this error can be linked to motion artefacts, low amplification gain, and improper connection belt attachment. Table S1 in the ESI† document contains the respiratory rates of all 15 participants at different postures.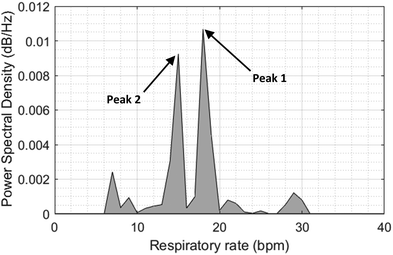 | ||
| Fig. 10 Power spectral density function of test subject #17 while standing showing two peaks, and the 2nd highest one represents the correct respiratory rate. | ||
Comparison with other work
In previous studies,28,34 Al-Halhouli et al. reported an inkjet-printed strain sensor with a GF of 0.11 and a maximum strain of 7%, resulting in an average error of 0.46 ± 0.66 bpm. Although inkjet printing is more flexible than screen printing, the inkjet-printed patterns are more prone to scratches, difficult to coat and less durable. Chu et al.35 developed a compact strain sensor using magnetron sputter deposition with a gauge factor of 0.85–2.64. Owing to integrated hierarchical wrinkle structures, the sensor achieved a maximum strain of 226%. The sensor could also extract the respiration volume. Yamada et al.36 used aligned single-walled carbon nanotube (SWCNT) thin films that deform when stretched similar to the deformation of string cheese when peeled. Although designed for large-scale motion monitoring with a maximum strain of 280% and a gauge factor of 0.82, this sensor was demonstrated to measure respiratory rate as well, but without calculating the error. Massaroni et al.37 developed a smart textile sensor and argued that a maximum strain of 5% covers the strain range during respiration. With six different sensors of varying lengths and thicknesses, a bias of 0.05 bpm and a LoA of 1.97 bpm were achieved. In this work, a gauge factor of 6.23 was achieved, resulting in a high signal-to-noise ratio and thereby achieving an average error of 0.044 ± 0.638 bpm. While the maximum strain achieved is not the highest in the literature, 24% is much higher than the expected chest strain during breathing. Table 1 compares strain sensors in the literature that were used for respiratory rate monitoring, comparing their gauge factor, performance and maximum strain.| Group | Gauge factor (GF) | Performance analysis | Maximum strain (%) |
|---|---|---|---|
| Al-Halhouli et al.28,34 | 0.11 | Error: 0.46 ± 0.66 bpm | 7 |
| Chu et al.35 | 0.85–2.64 | Maximum error of 2% | 156–226 |
| Yamada et al.36 | 0.82 | — | 280 |
| Massaroni et al.37 | 0.5–5 | Bias: 0.05 bpm and LoA 1.97 bpm | 5 |
| Current work | 6.23 | Error: 0.044 ± 0.638 bpm | 24 |
Limitations of screen-printed sensors and recommendations for future work
The development process of the screen-printed respiratory rate sensor relied heavily on inkjet printing as a method for prototyping and experimentation. Any single change in the design requires starting over with the mesh preparation process including the coating of photoemulsion, light exposure and washing. While one screen can contain multiple designs, the research and development process is often iterative and requires the results of the previous design to identify the areas of improvement for the next one. Moreover, screen printing produces a waste of ink and cleaning solutions, especially because not all inks can be reused, and the screen needs to be properly cleaned to be repurposed again. The sensor is very durable and water and solvent-resistant, and this gives it a big advantage over inkjet counterparts since the sensor may be subjected to environmental changes during operation. However, this durability means that the sensor also is less sensitive to small strain changes, making it not ideal for detecting small variations like vibrations induced by heart rate. Ideally, inkjet and screen printing are to be used together in the development phase to exploit both of their advantages. The current strap connection is not practical for the continuous use and skin-like adhesive and strapless attachment methods are recommended for future development. Also, the recruitment of a diverse group of human participants is recommended for future trials.Conclusions
The screen-printed RR sensor presented in this study demonstrates a promising advancement in continuous healthcare monitoring. Its fabrication using low-cost, biocompatible, and durable materials, such as PDMS and the carefully designed silver horseshoe patterns, ensures accuracy and reliability and promotes comfort for wear on the skin. The sensor's successful clinical evaluation on 15 healthy subjects included various postures, showing its precision in measuring RR with an overall error of 0.044 bpm (compared to a reference nasal airflow sensor). This method exhibits potential for integration into clinical settings and personal health tracking. Moreover, the ease of implementation of the developed screen-printing process in low-income regions holds significant promise for widespread implementation without relying on sophisticated facilities and expensive equipment.Author contributions
Conceptualization: A. A.-H and J. A-K.; methodology: A. A.; software: A. A.; validation: A. A-H., A. A. and M. H.; formal analysis: A. A., A. R. and M. H; investigation: A. A., A. R. and M. H.; resources: A. A.-H, J. A.-K and M. A.-A; data curation: A. A.; writing – original draft preparation: A. A., A. R. and M. H.; writing – review and editing: A. A.-H, A. A., and J. A.-K; visualization: A. A.; supervision: A. A-H and M. A.-A; project administration: A. A.-H, J. A.-K and A. A.; funding acquisition: J. A.-K and A. A.-H. All authors have read and agreed to the published version of the manuscript.Data availability
The deidentified raw clinical data are accessible online as a MATLAB database. Additionally, we have included ESI† that contain the collected participant data along with detailed figures illustrating the fabrication and testing processes. The MATLAB code used to plot the strain-resistance curve is also provided.Conflicts of interest
There are no conflicts to declare.Acknowledgements
This research was funded by the Deanship of Scientific Research at the German Jordanian University, grant number SATS01/2019. The authors would like to thank the Deanship of Scientific Research at the German Jordanian University for the continuous support in acquiring and maintaining funding for this project. Moreover, special thanks to Dr Mohammad Khanfar and Ayat Abu Daeij for their support in SEM imaging. The authors also acknowledge the contributions of Abdallah Adwan, Jafar Alawadi, Saleem El Bouri in the early stages of the project. Also, special thanks to Osama Khallouf for preparing the data acquisition MATLAB Simulink diagram used in the clinical experiments.Notes and references
- M. A. Cretikos, R. Bellomo, K. Hillman, J. Chen, S. Finfer and A. Flabouris, Respiratory rate: the neglected vital sign, Med. J. Aust., 2008, 188, 657–659, DOI:10.5694/J.1326-5377.2008.TB01825.X.
- A. Bush, C. A. Byrnes, K. C. Chan, A. B. Chang, J. C. Ferreira, K. A. Holden, S. Lovinsky-Desir, G. Redding, V. Singh and I. P. Sinha, et al., Social determinants of respiratory health from birth: still of concern in the 21st century?, Eur. Respir. Rev., 2024, 33, DOI:10.1183/16000617.0222-2023.
- K. A. Holden, A. R. Lee, D. B. Hawcutt and I. P. Sinha, The impact of poor housing and indoor air quality on respiratory health in children, Breathe, 2023, 19, 230058, DOI:10.1183/20734735.0058-2023.
- T. Kenzaka, M. Okayama, S. Kuroki, M. Fukui, S. Yahata, H. Hayashi, A. Kitao, D. Sugiyama, E. Kajii and M. Hashimoto, Importance of Vital Signs to the Early Diagnosis and Severity of Sepsis: Association between Vital Signs and Sequential Organ Failure Assessment Score in Patients with Sepsis, Intern. Med., 2012, 51, 871–876, DOI:10.2169/internalmedicine.51.6951.
- P. B. Lovett, J. M. Buchwald, K. Stürmann and P. Bijur, The vexatious vital: Neither clinical measurements by nurses nor an electronic monitor provides accurate measurements of respiratory rate in triage, Ann. Emerg. Med., 2005, 45, 68–76, DOI:10.1016/j.annemergmed.2004.06.016.
- A. S. Ginsburg, J. L. Lenahan, R. Izadnegahdar and J. M. Ansermino, A Systematic Review of Tools to Measure Respiratory Rate in Order to Identify Childhood Pneumonia, Am. J. Respir. Crit. Care Med., 2018, 197, 1116–1127, DOI:10.1164/rccm.201711-2233CI.
- Y. Cho, S. J. Julier, N. Marquardt and N. Bianchi-Berthouze, Robust tracking of respiratory rate in high-dynamic range scenes using mobile thermal imaging, Biomed. Opt. Express, 2017, 8, 4480, DOI:10.1364/BOE.8.004480.
- S. S. Badshah, U. Saeed, A. Momand, S. Y. Shah, S. I. Shah, J. Ahmad, Q. H. Abbasi and S. A. Shah, UWB Radar Sensing for Respiratory Monitoring Exploiting Time- Frequency Spectrograms, 2022 2nd International Conference of Smart Systems and Emerging Technologies (SMARTTECH), 2022, pp. 136–141 DOI:10.1109/SMARTTECH54121.2022.00040.
- L. Felipe De Lima, L. Ferreira and W. Reis De Araujo, Sensing Interfaces: Materials for Wearable Sensors, Encyclopedia of Sensors and Biosensors, 2023, vol. 2, pp. 636–649 DOI:10.1016/B978-0-12-822548-6.00127-8.
- H. C. Ates, P. Q. Nguyen, L. Gonzalez-Macia, E. Morales-Narváez, F. Güder, J. J. Collins and C. Dincer, End-to-end design of wearable sensors, Nat. Rev. Mater., 2022, 7, 887–907, DOI:10.1038/s41578-022-00460-x.
- Y. Yang and Z. D. Deng, Stretchable sensors for environmental monitoring, Appl. Phys. Rev., 2019, 6, DOI:10.1063/1.5085013.
- M. Rdest and D. Janas, Carbon Nanotube Wearable Sensors for Health Diagnostics, Sensors, 2021, 21, 5847, DOI:10.3390/s21175847.
- J. Yi, Y. Xianyu, J. Yi and Y. Xianyu, Gold Nanomaterials-Implemented Wearable Sensors for Healthcare Applications, Adv. Funct. Mater., 2022, 32, 2113012, DOI:10.1002/ADFM.202113012.
- G. W. Hsieh and C. Y. Chien, Wearable Capacitive Tactile Sensor Based on Porous Dielectric Composite of Polyurethane and Silver Nanowire, Polymers, 2023, 15, 3816, DOI:10.3390/polym15183816.
- G. Baldini, A. Albini, P. Maiolino and G. Cannata, An Atlas for the Inkjet Printing of Large-Area Tactile Sensors, Sensors, 2022, 22, 2332, DOI:10.3390/S22062332.
- X. Qi, H. Ha, B. Hwang and S. Lim, Printability of the Screen-Printed Strain Sensor with Carbon Black/Silver Paste for Sensitive Wearable Electronics, Appl. Sci., 2020, 10, 6983, DOI:10.3390/APP10196983.
- A. Al-Halhouli, A. Albagdady, J. Alawadi and M. A. Abeeleh, Monitoring Symptoms of Infectious Diseases: Perspectives for Printed Wearable Sensors, Micromachines, 2021, 12, 620, DOI:10.3390/mi12060620.
- J. Voutilainen, T. Happonen, J. Hakkinen and T. Fabritius, All Silk-Screen Printed Polymer-Based Remotely Readable Temperature Sensor, IEEE Sens. J., 2015, 15, 723–733, DOI:10.1109/JSEN.2014.2350077.
- U. Boda, J. Strandberg, J. Eriksson, X. Liu, V. Beni and K. Tybrandt, Screen-Printed Corrosion-Resistant and Long-Term Stable Stretchable Electronics Based on AgAu Microflake Conductors, ACS Appl. Mater. Interfaces, 2023, 15, 12372–12382, DOI:10.1021/acsami.2c22199.
- N. Zavanelli and W. H. Yeo, Advances in Screen Printing of Conductive Nanomaterials for Stretchable Electronics, ACS Omega, 2021, 6, 9344–9351, DOI:10.1021/acsomega.1c00638.
- S. Cinti, L. Fiore, R. Massoud, C. Cortese, D. Moscone, G. Palleschi and F. Arduini, Low-cost and reagent-free paper-based device to detect chloride ions in serum and sweat, Talanta, 2018, 179, 186–192, DOI:10.1016/j.talanta.2017.10.030.
- C. M. Moreira, S. V. Pereira, J. Raba, F. A. Bertolino and G. A. Messina, Paper-based enzymatic platform coupled to screen printed graphene-modified electrode for the fast neonatal screening of phenylketonuria, Clin. Chim. Acta, 2018, 486, 59–65, DOI:10.1016/j.cca.2018.07.016.
- E. Núnez-Bajo, M. C. Blanco-López, A. Costa-García and M. T. Fernández-Abedul, In situ gold-nanoparticle electrogeneration on gold films deposited on paper for non-enzymatic electrochemical determination of glucose, Talanta, 2018, 178, 160–165, DOI:10.1016/j.talanta.2017.08.104.
- K. Income, N. Ratnarathorn, N. Khamchaiyo, C. Srisuvo, L. Ruckthong and W. Dungchai, Disposable Nonenzymatic Uric Acid and Creatinine Sensors Using μ PAD Coupled with Screen-Printed Reduced Graphene Oxide-Gold Nanocomposites, Int. J. Anal. Chem., 2019, 2019, 1–11, DOI:10.1155/2019/3457247.
- I. Miranda, A. Souza, P. Sousa, J. Ribeiro, E. M. S. Castanheira, R. Lima and G. Minas, Properties and Applications of PDMS for Biomedical Engineering: A Review, J. Funct. Biomater., 2021, 13, 2, DOI:10.3390/jfb13010002.
- K.-Y. Song, H. Zhang, W.-J. Zhang and A. Teixeira, Enhancement of the surface free energy of PDMS for reversible and leakage-free bonding of PDMS–PS microfluidic cell-culture systems, Microfluid. Nanofluid., 2018, 22, 135, DOI:10.1007/s10404-018-2152-3.
- H. Hocheng, C.-M. Chen, Y.-C. Chou and C.-H. Lin, Study of novel electrical routing and integrated packaging on bio-compatible flexible substrates, Microsyst. Technol., 2010, 16, 423–430, DOI:10.1007/s00542-009-0930-2.
- A. Al-Halhouli, L. Al-Ghussain, S. El Bouri, H. Liu and D. Zheng, Fabrication and Evaluation of a Novel Non-Invasive Stretchable and Wearable Respiratory Rate Sensor Based on Silver Nanoparticles Using Inkjet Printing Technology, Polymers, 2019, 11, 1518, DOI:10.3390/polym11091518.
- J. Abu-Khalaf, R. Saraireh, S. Eisa and A. Al-Halhouli, Experimental Characterization of Inkjet-Printed Stretchable Circuits for Wearable Sensor Applications, Sensors, 2018, 18, 3476, DOI:10.3390/s18103476.
- A. A. Norhidayah, A. A. Saad, M. F. M. Sharif, F. C. Ani, M. Y. T. Ali and Z. Ahmad, Stress Analysis of a Stretchable Electronic Circuit, Procedia Eng., 2017, 184, 625–630, DOI:10.1016/j.proeng.2017.04.127.
- J. M. Abu-Khalaf, L. Al-Ghussain and A. Al-Halhouli, Fabrication of Stretchable Circuits on Polydimethylsiloxane (PDMS) Pre-Stretched Substrates by Inkjet Printing Silver Nanoparticles, Materials, 2018, 11, 2377, DOI:10.3390/ma11122377.
- S. Mascaro, D. Mascaro, J. Abu-Khalaf and J. Park, Stretchable Circuit Configuration 2014, vol. 2, p. 14.
- J. M. Bland and D. G. Altman, Statistical methods for assessing agreement between two methods of clinical measurement, Lancet, 1986, 327, 307–310 CrossRef.
- A. Al-Halhouli, L. Al-Ghussain, O. Khallouf, A. Rabadi, J. Alawadi, H. Liu, K. Al Oweidat, F. Chen and D. Zheng, Clinical Evaluation of Respiratory Rate Measurements on COPD (Male) Patients Using Wearable Inkjet-Printed Sensor, Sensors, 2021, 21, 468, DOI:10.3390/s21020468.
- M. Chu, T. Nguyen, V. Pandey, Y. Zhou, H. N. Pham, R. Bar-Yoseph, S. Radom-Aizik, R. Jain, D. M. Cooper and M. Khine, Respiration rate and volume measurements using wearable strain sensors, npj Digit. Med., 2019, 2, 8, DOI:10.1038/s41746-019-0083-3.
- T. Yamada, Y. Hayamizu, Y. Yamamoto, Y. Yomogida, A. Izadi-Najafabadi, D. N. Futaba and K. Hata, A stretchable carbon nanotube strain sensor for human-motion detection, Nat. Nanotechnol., 2011, 6, 296–301, DOI:10.1038/nnano.2011.36.
- C. Massaroni, J. Di Tocco, D. Lo Presti, U. G. Longo, S. Miccinilli, S. Sterzi, D. Formica, P. Saccomandi and E. Schena, Smart Textile Based on Piezoresistive Sensing Elements for Respiratory Monitoring, IEEE Sens. J., 2019, 19, 7718–7725, DOI:10.1109/JSEN.2019.2917617.
Footnote |
| † Electronic supplementary information (ESI) available. See DOI: https://doi.org/10.1039/d4ma00510d |
| This journal is © The Royal Society of Chemistry 2024 |

