 Open Access Article
Water sorption studies with mesoporous multivariate monoliths based on UiO-66†
Linia Gedi
Marazani
 a,
Victoria
Gascon-Perez
 b,
Ayush
Pathak
 c,
Michele
Tricarico
d,
Jin-Chong
Tan
 d,
Michael J.
Zaworotko
b,
Andrew E. H.
Wheatley
 c,
Banothile C. E.
Makhubela
 e and
Gift
Mehlana
 *a
*a
aDepartment of Chemical Sciences, Faculty of Science and Technology, Midlands State University, P Bag 9055 Senga Road, Gweru, Zimbabwe. E-mail: mehlanag@staff.msu.ac.zw
bBernal Institute, Department of Chemical Sciences, University of Limerick, Limerick, V94 T9PX, Republic of Ireland
cYusuf Hamied Department of Chemistry, University of Cambridge, Lensfield Road, Cambridge, CB2 1EW, UK
dDepartment of Engineering Science, University of Oxford, Parks Road, Oxford, OX1 3PJ, UK
eResearch Centre for Synthesis and Catalysis, Department of Chemical Sciences, Faculty of Science, University of Johannesburg, Auckland Park 2006, South Africa
First published on 30th August 2024
Abstract
Hierarchical linker thermolysis has been used to enhance the porosity of monolithic UiO-66-based metal–organic frameworks (MOFs) containing 30 wt% 2-aminoterephthalic acid (BDC-NH2) linker. In this multivariate (i.e. mixed-linker) MOF, the thermolabile BDC-NH2 linker decomposed at ∼350 °C, inducing mesopore formation. The nitrogen sorption of these monolithic MOFs was probed, and an increase in gas uptake of more than 200 cm3 g−1 was observed after activation by heating, together with an increase in pore volume and mean pore width, indicating the creation of mesopores. Water sorption studies were conducted on these monoliths to explore their performance in that context. Before heating, monoUiO-66-NH2-30%-B showed maximum water vapour uptake of 61.0 wt%, which exceeded that reported for either parent monolith, while the highly mesoporous monolith (monoUiO-66-NH2-30%-A) had a lower maximum water vapour uptake of 36.2 wt%. This work extends the idea of hierarchical linker thermolysis, which has been applied to powder MOFs, to monolithic MOFs for the first time and supports the theory that it can enhance pore sizes in these materials. It also demonstrates the importance of hydrophilic functional groups (in this case, NH2) for improving water uptake in materials.
Introduction
The issues of global warming and population growth have already combined to stress populations living in water-depleted areas of the world. According to the 2023 United Nations World Water Development Report,1 more than 80 countries suffer from water shortages and, by 2025, 2.7 billion people will be lacking reliable access to clean water. This makes efforts to develop technologies that can provide safe and clean water to large populations vital. While water is plentiful on the planet, given that it covers more than 70% of the surface,2 97% is salty (seawater) and can only be consumed after purification. Of the 3% fresh water available, only 0.06% can be accessed without problems. Indeed, war and conflict, climate change, lack of infrastructure, natural disasters and many other crises have contributed to problems in accessing fresh water.1 To purify seawater, desalination technologies have been employed. The most common of these can be broadly classified into membrane and thermal (distillation) technologies.3,4 Membrane technologies are further subdivided into reverse osmosis (RO), electrodialysis (ED), and electrodialysis reversal (EDR). Thermal technologies, on the other hand, can be further categorised as multi-stage flash distillation (MSF), multi-effect distillation (MED) and vapour compression distillation (VCD).5 Concerning drawbacks, most desalination methods in current use are energy intensive and costly;6 membrane technologies usually suffer from fouling, whereas thermal technologies suffer from high energy consumption.3 Therefore, there is a need for both alternative methods of water purification and new materials that can more efficiently adsorb water either from the air or from other sources.Water sorption is an area that has been intensively studied. Various classes of material have been tested, including activated carbon fibres (ACFs),6–8 zeolites,9,10 and polymers.11 These materials tend to lack pores that offer appropriate gas diffusion and water uptake kinetics.12 For example, zeolites show microporosity and very high surface-to-volume ratios,9 reducing their water uptake. Metal–organic frameworks (MOFs) based on zirconium,13–18 aluminium,19–21 zinc,10,22 chromium,23–25 magnesium,26 copper,27 and iron28 have also been studied. This class of porous, hybrid metal–organic materials, frequently possess tuneable porosity, significant surface areas and ease of functionalisation.29 They comprise metal clusters joined together by organic linkers to form 3D (or 2D) networks, potentially with huge pore volumes and large inner surface areas. However, many MOFs are hydrolytically unstable,30,31 due to the lability of the metal–ligand coordination bonds or the instability of the metal nodes in the MOF framework.32–34 This potential drawback has been overcome by developing MOFs that use high valent metals like Zr(IV), Cr(III), and Hf(IV) or metals, such as Cu(II), that can undergo controlled coordinative reduction (e.g., to Cu(I)) and have proven to improve hydrolytic stability.32,35 Nevertheless, circumspection is required as some zirconium-based MOFs, for example those based on 4,4-biphenyl-dicarboxylate and 2,2′-bipyridine-5,5′-dicarboxylate linkers have been proven to be unstable towards liquid water and water vapour,36 while others, like UiO-67 and NU1000, though stable in liquid water, collapse upon activation from liquid water.37 Water-stable MOFs have already shown great potential in water adsorption, for example the aluminium-based MOF-303, which demonstrated a high water uptake of 45% at 90% relative humidity.38 In addition to good stability, these MOFs have offered scope for being modified, increasing their hydrophobicity, post-synthetically or in situ.39–42 In this context, Ni2Cl2BTDD (BTDD2− = bis(1H-1,2,3-triazolato[4,5-b],[4′,5′-i])dibenzo[1,4]dioxin) MOF was modified by replacing chloride with bromide to obtain Ni2Br2BTDD, a procedure that made the MOF more hydrophobic and reduced its volumetric water uptake by about 15%.41
A material with a high water adsorption performance can be harnessed in pervaporation processes that allow water purification by separating mixtures of water and organic solvents,43 and desalinating salty water.3–5 In a similar vein, water extraction from the atmosphere (atmospheric water harvesting, AWH), since the atmosphere contains approximately 1.3 × 10¹⁶ litres of water vapour,44 is another field underpinned by materials with high gravimetric water uptake.6,11,38,45–47 AWH is commonly used in condensation systems, where air is forced through a heat exchanger that cools it and condenses its water content.48 However, these systems suffer from high energy consumption.49 AWH, driven by solar energy and waste heat, can significantly reduce energy consumption and constitute a more sustainable infrastructure. In other applications, materials with high water uptake can be used in heat transmission, such as in cooling and in the production of heat.10,19,25,50 Underpinning applications development, water sorption studies also provide information on the pore volume, and pore size and show the hydrophobicity or hydrophilicity and stability of materials toward moisture.51 Three mechanisms of water adsorption in MOFs have been identified:52–54 (1) capillary condensation, which is usually reflected by hysteresis in the isotherm, and manifests in mesopores at room temperature; (2) in the hydration layer, as identified by a lack of hysteresis, water clusters grow with increasing relative humidity; (3) water clusters forming in and filling the pores of hydrophobic MOFs, with which they display only weak interactions.52
The requirements that must be satisfied for water sorption by a MOF include hydrolytic stability, S-shaped or stepped adsorption isotherm at lower than 30% relative humidity (RH),55 fast loading and unloading kinetics and facile regeneration conditions.56,57 MOFs that can capture water vapour at lower RH (0–40%) can potentially be used in atmospheric water harvesting, heat transfer mechanisms and dehumidification.58
A range of MOFs have been tested as sorption materials for heat transfer processes.50,59–62 Zirconium-based MOFs (ZrMOFs) have held particular appeal since they are in general highly stable thermally and chemically.63 Despite this, it has been reported that, though they possess most of the requirements for water adsorption, including high surface area and porosity,20 they may lack long-term hydrolytic stability.64–66 This notwithstanding, ZrMOFs of the UiO, NU, DUT, Zr-fumarate and MOF-801 types have been extensively studied for water adsorption, and they have proven to be outstanding candidates in heating, ventilation and air conditioning (HVAC) systems and water treatment.67–73 However, these materials have so far all been powders, which suffer from dustiness, limited mechanical strengths and low densities that reduce their volumetric working capacities and water vapour and gas uptakes.74 To address the drawbacks of these powder MOFs, techniques of shaping or pelletising into desired shapes, sizes and densities using chemical binders and high pressures have been introduced. However, these come with major shortcomings, mainly in reducing porosity, adding chemical complexity and inducing structural collapse of the frameworks.75–78 Therefore effort has recently been redirected towards finding other ways of conforming and densifying MOFs. In this regard, monolithic monoZIF-879 and monoHKUST-178 were synthesised with high microporosity and density. However, while densification meant that monoHKUST-1 exhibited benchmark volumetric natural gas storage, its deficient working capacity prompted Connolly et al.74 to develop the sol–gel synthesis of mesoporous monoUiO-66 MOFs. These monolithic MOFs are conformed materials that exhibit a single-phase appearance on both the macro and micro scale. In their synthesis, washing of the intermediate gel with solvent, which is then slowly evaporated from primary nanocrystallite surfaces, coupled with the presence there of residual precursors, has been argued to facilitate the epitaxial growth and closer interaction of these primary particles by effectively extending the reaction time.78 In this case, the use of a solvent with relatively high surface tension and boiling point (DMF) facilitates slow drying, thereby encouraging retention of the gel macrostructure throughout the drying process. The result is a monoMOF with high density, stability and rigidity.76 They have recently gained popularity due to their very high gas uptake levels compared to their powder counterparts. Moreover, their size makes them easy to handle and stable for industrial applications. Specific to water handling, Çumar et al.80 recently used three high-density monoliths, UiO-66, UiO-66-NH2 and Zr-fumarate, in water adsorption studies for HVAC applications.
Linker thermolysis has been used to create mesopores in microporous materials.81,82 However, the method has only been applied to powder MOFs. The current work extends the idea to monolithic MOFs for the first time and supports the theory that it enhances pore sizes in these materials. The work translates the recent introduction of monoUiO systems to the field of water sorption80 by post-synthetically modifying monolithic UiO-66 MOFs incorporating 30 wt% 2-amino benzene-1,4-dicarboxylate (BDC-NH2) linker. Adapting a protocol developed by Feng et al.,81 monolithic MOFs were heated to enhance mesoporosity by decomposition of the thermolabile BDC-NH2 linker. The resulting monoMOFs have then been studied for their water adsorption capabilities using Dynamic Vapour Sorption (DVS).
Experimental section
General
Synthesis of monoUiO-66-NH2-30%
The synthesis procedure involved a modified literature method.74 ZrOCl2·8H2O (1.61 g, 4.97 mmol), H2BDC (1.31 g, 7.89 mmol) and H2BDC-NH2 (0.393 g, 2.17 mmol) (30 wt% with respect to H2BDC) were weighed into a 150 mL pyrex Schott bottle, and 30 mL of DMF was added. It was stirred vigorously for a minute, and then 2 mL glacial acetic acid and 1.5 mL concentrated HCl were added and stirred until well mixed. The mixture was then heated in a conventional oven at 100 °C for two hours. The gel formed was cooled overnight. 50 mL of DMF was added to the cooled gel and remixed. Approximately 10 mL portions of the mixture were centrifuged at 5500 rpm for 3 minutes. The samples were washed with 30 mL DMF and centrifuged at 5500 rpm for 10 minutes before drying at 30 °C in an oil bath. The dry monoliths were soaked in methanol for 24 hours, followed by activation at 110 °C for 8 hours in a vacuum oven to give monoUiO-66-NH2-30%-B. To convert this to monoUiO-66-NH2-30%-A, the monolith was heated to 350 °C for two hours in a muffle furnace under normal air.Powder X-ray diffraction (PXRD)
PXRD data were collected on a PANalytical Empyrean diffractometer fitted with an X’celerator detector and using a Cu-Kα1 (λ = 1.5406 Å) source. X-rays were generated with a current flow of 40 mA and a voltage of 40 kV. The monoliths were gently crushed to a powder and then placed on a zero background silicon wafer for analysis.Thermogravimetric analysis (TGA)
TGA was performed using a TA Discovery Instrument TA-Q50 with a heating rate of 10 °C min−1 from 25–500 °C under a dry nitrogen purge gas flow of 50 mL min−1.Fourier transform infrared (FTIR) spectroscopy
FTIR spectra were recorded in the 400–4000 cm−1 range on a PerkinElmer FTIR spectrometer (Model BX II) fitted with an attenuated total reflectance (ATR) probe.Scanning electron microscopy (SEM)
SEM images were collected on a TESCAN MIRA3 FEG-SEM. The voltage was 5.0 keV, and various magnifications were used. The images were processed using the Oxford Instruments AzTec Suite. The samples were sputter-coated with a 5 nm layer of chromium before placing in the instrument. The acquisition and analysis of EDX was performed on an Oxford Instruments X-maxN 80 EDS system.Transmission electron microscopy (TEM)
A Talos F200X G2 FEG Scanning TEM with a 200 keV accelerating voltage was used. The instrument has a Schottky X-FEG electron source. It has a Ceta 16M camera with speed enhancement designed for imaging and diffraction applications. This allowed 4k × 4k images to be acquired at 40 frames per second (and 512 × 512 pixels at 320 fps). HAADF, DF2, DF4 and BF STEM detectors were used. 2 mg of the monolith was crushed to a fine powder and dispersed in 2 mL hexane. A 4 μL aliquot was then transferred to a continuous carbon-coated Cu grid, and the solvent evaporated before the sample was mounted in the instrument.Nuclear magnetic resonance (NMR) spectroscopy
A Bruker Avance III 500 MHz DCH Cryoprobe Spectrometer was used (500.200 MHz for 1H and 125.775 MHz for 13C). Spectra were obtained at 27 °C using deuterated solvent stored over molecular sieves (3 Å). Chemical shifts were internally referenced to deuterated solvent and calculated relative to tetramethylsilane. Results were processed using Bruker TOPSPIN 3.0 software. For sample preparation, ∼13 mg of material was treated with 5 drops of D2SO4 at room temperature. The mixture was sonicated at 70 °C until dissolution was complete. The sample was then diluted with 1 mL DMSO-d6.Elemental analysis
An Exeter Analytical CE-440 Elemental Analyzer was used for C, H, and N analysis, and approximately 2 mg of each sample was used per analysis.Inductively coupled plasma-optical emission spectroscopy (ICP-OES)
A Thermo Fisher Scientific iCAP 7400 Duo ICP spectrometer was used for Zr analysis against ICP standards from Sigma-Aldrich or Acros of tetramethyl ammonium hydroxide. Approximately 2 mg activated MOF was digested in 5 mL trace metal grade nitric acid and this was diluted with 5 mL trace metal grade water. An aliquot of 0.5 mL of this sample was then diluted to 10 mL with water. Standard curves were also prepared in the concentration range of 0.01–10 ppm. For this, the commercial standard was diluted with 2% nitric acid solution.Gas adsorption studies
An Anton Parr Autosorb iQ-XR at 77 K was used in gas adsorption studies. Adsorption and desorption isotherms were collected using N2 gas. The sample was loaded in an oven-dried, type A long cell, 9 mm outer diameter, LG bulb, which was tarred before loading. Degassing at 110 °C for 12 h followed, then the evacuated tube was weighed to find the sample mass. Isotherms were collected over 24–30 hours, after which samples were reweighed for accurate mass readings. AsiQwin version 5.21 software was used to evaluate the sorption isotherms, which facilitated the calculation of the BET surface area using the BET equation and Rouquerol's consistency criteria.Nanoindentation
A KLA iMicro nanoindenter equipped with a 50 mN force actuator and a Berkovich diamond tip was used for nanoindentation. Continuous Stiffness Measurements (CSM) were performed by measuring the indentation modulus (E) and indentation hardness (H) as a function of surface penetration depth.83 Four sets of sixteen indents were performed per sample in different areas. Two sets of indents were performed at a maximum depth of 1000 nm and another two sets at 2000 nm. A constant indentation strain rate of 0.1 s−1 was used. To quantify creep, the maximum load was held for 1 second before unloading. The load was held at 10% maximum load for 3 minutes upon unloading to quantify thermal drift and correct the recorded value of depth and load. Prior to nanoindentation studies, the monoliths were cold-mounted in an epoxy resin (Struers Epofix) and the sample surfaces were flattened by polishing with sandpapers and diamond suspensions.Dynamic vapour sorption (DVS) measurements
The Adventure dynamic vapour sorption analyser (from Surface Measurement Systems, UK) was combined with in situ preheating/drying of samples and two sample balances to allow simultaneous analysis of two samples. The system included a sample preheater option to heat a sample to 160 °C under in situ preheating/drying (heating rate programmable up to 10 °C min−1). It could cool/heat the sample from 10 °C to at least 70 °C (precision ±0.02 °C) during dynamic DVS analysis and covered a broad range of RH (i.e., 0 to 98% from 10 °C to 70 °C). The RH range accuracy from 10 °C to 60 °C was ± 0.5%, while from 60 °C to 70 °C was ± 1%. An accurate zero drying at 0.0% RH of the sample (with dry carrier gas) was considered. The two balances allowed simultaneous parallel analysis of two samples. The instrument included highly accurate digital mass flow controllers (i.e., two mass flow controllers automatically deliver wet and dry flow 0–200 sccm, ±0.1 sccm), RH sensors, and all required regulators for the dry air used as carrier gas during analysis. Accurately, the instrument determined vapour across a range of sample weights, from ca. 1 mg to 1 g with high resolution/precision (mass change ±150 mg; balance resolution or precision 0.1 μg; balance noise ≤0.3 μg) (peak to peak, RMS); drift ≤5 μg over 24 hours (0% RH and 25 °C). The instrument ran at ambient pressure conditions. The control software fully controlled RH, times, and temperatures; sorption and desorption cycles; isotherm and kinetics; choice of timed or mass stability measurement points; and real-time plot of experimental data. The system had a water reservoir with a 0.25 L capacity. Pure water (HPLC Gradient Grade, Fisher Chemical) was used for the experiments. The analysis software includes all pertinent processing and built-in calculation capabilities to generate water vapour sorption and desorption isotherms and kinetics information. Water vapour sorption analysis was measured at 27 °C for the samples using 10–20 mg.Results and discussion
UiO-66 MOF comprises octahedral clusters of Zr6O4(OH)4 connected 12-fold by 1,4-benzene-dicarboxylate (BDC) linkers, forming a fcc crystal structure. This MOF has been reported to have a high surface area of >1200 m2 g−1 and is highly thermally and chemically stable.74,80 The primary source of this stability is the strength of the Zr(IV)–O bonds formed between the linker and metal cluster.84 Additionally, the Zr6 cluster cores can reversibly rearrange on addition or removal of the μ3-OH groups with no change in the structure. While it was originally fabricated as a powder,85,86 UiO-66 is one of the few MOFs developed as a densified monolith.74 Achieving a monolithic formulation yielded improvements in mechanical properties and surface area, with a density approaching that of the ideal single crystal. Significantly, monoUiO-66 offers the advantage of more significant and more tractable particle size (centimetre scale). In this work, we sought to produce a monolithic variant based on UiO-66 by introducing 30% (by weight with respect to H2BDC) H2BDC-NH2. This would represent, so far as we are aware, the first example of a multivariate monolithic MOF. In the event, monoUiO-66-NH2-30%-B was synthesised by modifying the literature synthesis for monoUiO-66.74 A mixture of H2BDC and 30 wt% H2BDC-NH2 were used to obtain gelUiO-66-NH2-30%-B. After slow drying at ambient temperature to give monoUiO-66-NH2-30%-B, thermal treatment was employed to hierarchically degrade the BDC-NH2 linkers and change pore structure. As shown in Scheme 1, orange monoUiO-66-NH2-30%-B turned black after heating at 350 °C to give monoUiO-66-NH2-30%-A.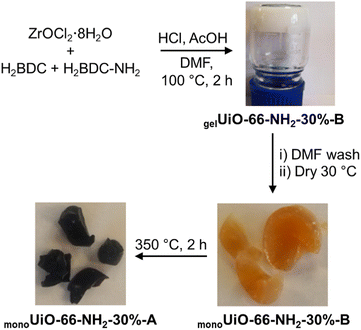 | ||
| Scheme 1 Synthesis of monoUiO-66-NH2-30%-B (orange) and monoUiO-66-NH2-30%-A (black) from gelUiO-66-NH2-30%-B. H2BDC-NH2 used was 30% by weight with respect to H2BDC. | ||
The PXRD patterns of monoUiO-66-NH2-30%-B and monoUiO-66-NH2-30%-A matched, suggesting that, despite the colour change and some decomposition after thermolysis, the remaining material had the same structure and crystallinity as UiO-66. The phase of the material (before and after heating to 350 °C) is compared to the calculated pattern of UiO-66 in Fig. 1. Significant peak broadening is seen in the experimental patterns. Connolly et al.74 have previously reported this behaviour, attributing it to the non-convergence of diffraction peaks in nanocrystallites. In that study, the authors noted that these monolithic materials comprise densified MOF nanoparticles where particle interstitial space is reduced compared to the gel, contributing to peak broadening.74
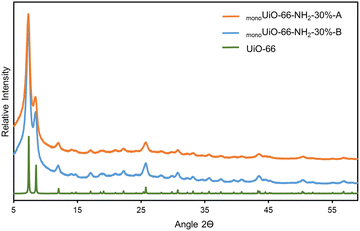 | ||
| Fig. 1 Experimental PXRD patterns of monoUiO-66-NH2-30%-B and monoUiO-66-NH2-30%-A and the simulated pattern for UiO-66. | ||
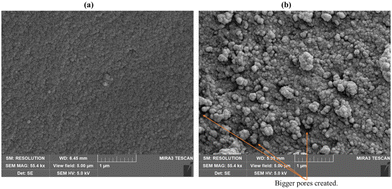
The morphology of either monolith prepared here was studied using SEM and TEM. These studies suggested that the synthesised materials are indeed monoliths. Representative SEM imaging for monoUiO-66-NH2-30%-B reveals densely packed nanocrystallites, as shown in Fig. 2(a) (also Fig. S1a and S2a, ESI†). These densely packed nanocrystallites were not retained after heating, as can be seen in the monoUiO-66-NH2-30%-A image in Fig. 2(b) (also Fig. S1b and S2b, ESI†). Instead, monoUiO-66-NH2-30%-A displayed a surface decorated with agglomerated particles and more prominent pores. Previous TEM studies on monoUiO-66 and monoUiO-66-NH2 by Connolly et al.74 revealed that these materials comprise densified primary nanoparticles approximately 10 nm in diameter. TEM images of the current monolith before and after heating (Fig. S3 and S4, ESI†) also support the formation of such ∼10 nm nanoparticles.
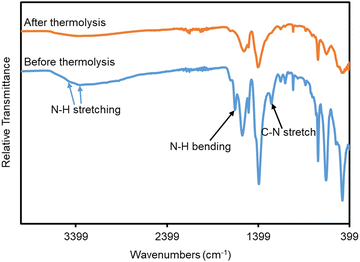
FTIR analysis of monoUiO-66-NH2-30%-A demonstrated the degradation of the BDC-NH2 linker as evidenced by the loss of N–H stretching peaks at ∼3350 cm−1 and 3450 cm−1, and more clearly the N–H bending peak at ∼1650 cm−1 and C–N stretching peak at ∼1250 cm−1 from the monoUiO-66-NH2-30%-B spectrum (Fig. 3). This view was substantiated by elemental analysis, which showed a significant increase in the Zr content and losses of C, N, and H in monoUiO-66-NH2-30%-A (Table 1). These data are consistent with the suggestion by Feng et al.,81 of a dehydration mechanism manifest during thermolysis at 250 °C followed by a decarboxylation above 300 °C, whereby the initial elimination of H2O from all nodes is followed by loss of CO2 from BDC-NH2 but not BDC, leading to the gradual eradication of BDC-NH2 linkers from the structure. This was suggested to occur to an incomplete extent based on analysis of nitrogen content after annealing. However, we speculate that the presence of aromatic amines generated in situ and subsequently entrapped by the MOF structure may complicate that analysis. The thermal induction of missing-linker defects was finally argued to engender the formation of small zirconium oxide nanoclusters. In the current study, experimental elemental compositions were lower than the theoretical elemental composition of UiO-66 in the literature.74 This could be attributed to mainly missing-linker defects in the case of monoUiO-66-NH2-30%-B, and the decomposition of a fraction of the thermolabile linker in monoUiO-66-NH2-30%-A. SEM-EDX results (Fig. S5–S8, ESI†) also confirmed the decrease in the carbon analysis. From these results, the Zr![[thin space (1/6-em)]](https://www.rsc.org/images/entities/char_2009.gif) :
:![[thin space (1/6-em)]](https://www.rsc.org/images/entities/char_2009.gif) C weight ratio was calculated to be 0.18 for monoUiO-66-NH2-30%-B and 0.54 for monoUiO-66-NH2-30%-A. The Zr/C weight ratio for the defect-free structure was found from the literature to be 0.06 for both UiO-66 and UiO-66-NH2.80 This figure was lower than the experimental ratio, which is in line with the literature expectation, suggesting that even in the densified monolith prior to heating there are some missing linker defects.74 The ratio for monoUiO-66-NH2-30%-B was, however, comparable to what was found by Çamur et al.,80 who reported ratios of 0.11 for both monoUiO-66 and monoUiO-66-NH2.
C weight ratio was calculated to be 0.18 for monoUiO-66-NH2-30%-B and 0.54 for monoUiO-66-NH2-30%-A. The Zr/C weight ratio for the defect-free structure was found from the literature to be 0.06 for both UiO-66 and UiO-66-NH2.80 This figure was lower than the experimental ratio, which is in line with the literature expectation, suggesting that even in the densified monolith prior to heating there are some missing linker defects.74 The ratio for monoUiO-66-NH2-30%-B was, however, comparable to what was found by Çamur et al.,80 who reported ratios of 0.11 for both monoUiO-66 and monoUiO-66-NH2.
| Substance | % C | % H | % N | % Zr | |||||||||||||||||||||||||||||||||||||||||||||||||||||||||||||||||||||||||||||||||||||||||||||||
|---|---|---|---|---|---|---|---|---|---|---|---|---|---|---|---|---|---|---|---|---|---|---|---|---|---|---|---|---|---|---|---|---|---|---|---|---|---|---|---|---|---|---|---|---|---|---|---|---|---|---|---|---|---|---|---|---|---|---|---|---|---|---|---|---|---|---|---|---|---|---|---|---|---|---|---|---|---|---|---|---|---|---|---|---|---|---|---|---|---|---|---|---|---|---|---|---|---|---|---|
| a Zr6O4(OH)4(BDC)4.71(BDC-NH2)1.29. b Zr6O6(BDC)4.71, assuming complete eradication of BDC-NH2. | |||||||||||||||||||||||||||||||||||||||||||||||||||||||||||||||||||||||||||||||||||||||||||||||||||
| monoUiO-66-NH2-30%-B | 30.2 | 2.8 | 2.7 | 24.3 | |||||||||||||||||||||||||||||||||||||||||||||||||||||||||||||||||||||||||||||||||||||||||||||||
| monoUiO-66-NH2-30%-A | 28.8 | 2.5 | 1.4 | 29.3 | |||||||||||||||||||||||||||||||||||||||||||||||||||||||||||||||||||||||||||||||||||||||||||||||
| UiO-66 (theoretical) | 34.6 | 1.7 | 0.0 | 32.9 | |||||||||||||||||||||||||||||||||||||||||||||||||||||||||||||||||||||||||||||||||||||||||||||||
| UiO-66-NH2 (theoretical) | 32.9 | 2.0 | 4.8 | 31.2 | |||||||||||||||||||||||||||||||||||||||||||||||||||||||||||||||||||||||||||||||||||||||||||||||
| monoUiO-66-NH2-30%-B (theoretical)a | 34.3 | 1.8 | 1.1 | 32.5 | |||||||||||||||||||||||||||||||||||||||||||||||||||||||||||||||||||||||||||||||||||||||||||||||
| monoUiO-66-NH2-30%-A (theoretical)b | 32.0 | 1.4 | 0.0 | 38.6 | |||||||||||||||||||||||||||||||||||||||||||||||||||||||||||||||||||||||||||||||||||||||||||||||
To further elucidate the decomposition of the thermolabile BDC-NH2 linker, proton (1H) and carbon (13C) NMR spectroscopic studies were carried out on our monoliths before and after heating. However, like many MOFs, they could not be directly dissolved in most common NMR solvents. Hence, they were digested with D2SO4 and then diluted with DMSO. Subsequent analysis revealed that the BDC-NH2 linker was indeed eliminated upon heating. Fig. S9 (ESI†) shows that the 1H NMR spectrum for monoUiO-66-NH2-30%-B retains signals for both the BDC and BDC-NH2 linkers, consistent with expectation for a multivariate system. Specifically, the resonance at 7.92 ppm originates from the BDC linker, with signals between 7.93–7.64 ppm corresponding to the aromatic signals of the BDC-NH2 linker. In apparent contrast, the 1H NMR spectrum for monoUiO-66-NH2-30%-A (Fig. S10, ESI†) superficially shows a resonance only due to BDC (7.87 ppm). However, a closer inspection of the aromatic region in this latter figure reveals very weak signals attributable to the retention of some fraction of BDC-NH2, helping to explain the observation of nitrogen content for monoUiO-66-NH2-30%-A in Table 1. These data tally with the 13C NMR spectroscopic results, which show the spectrum of monoUiO-66-NH2-30%-B in Fig. S11 (ESI†) being simplified to retain only three singlets due to BDC in that of monoUiO-66-NH2-30%-A in Fig. S12 and S13 (ESI†), any signals due to remnant aminated linker now being vanishingly small.
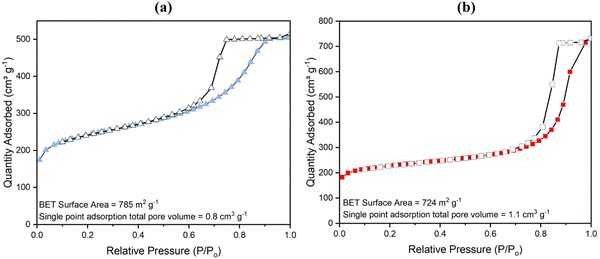
With NMR spectroscopy and compositional analysis backing up previous data (see both Fig. S22, Table 1 and ref. 81) and pointing to the method of degradation of a fraction of the aminated linker to form more mesopores being successful, BET analysis of surface area and porosity by nitrogen gas adsorption at 77 K was next conducted. Results are shown in Fig. 4 (for low pressure data see Fig. S14, ESI†). High surface areas of 1074 ± 20 m2 g−1 for powder UiO-66-NH2 and 1200 ± 20 m2 g−1 for UiO-66 have been reported before.33,80 These surface areas, however, hitherto reduced slightly in monoliths as reported by Çamur et al.80 and Connolly et al.,74 who measured surface areas of 988 m2 g−1 and 822 m2 g−1 for monoUiO-66-NH2 and 1223 m2 g−1 and 1069 m2 g−1 for monoUiO-66, respectively. In this work, monoUiO-66-NH2-30%-B exhibited a surface area of 785 m2 g−1, which was reduced upon heating to 724 m2 g−1 in monoUiO-66-NH2-30%-A. These values were both low, probably due to structural defects induced by the inclusion of the aminated linker in the framework even before thermolysis. As hoped for based on the observations of Feng et al.,81 thermolabilisation of the aminated linker saw the total pore volume increase from 0.8 cm3 g−1 in monoUiO-66-NH2-30%-B to 1.1 cm3 g−1 in monoUiO-66-NH2-30%-A. This increment was attributed to the porosity created by linker decomposition. Both monoUiO-66-NH2-30%-B and monoUiO-66-NH2-30%-A exhibited Type IV adsorption–desorption isotherms with hysteresis showing that they were both mesoporous.82 The pore size distribution, calculated using the Barrett–Joyner–Halenda (BJH) method is shown in Fig. 5. Data reinforce the presence of mesopores in both composites, with the mean pore width increasing from 5 nm for monoUiO-66-NH2-30%-B to 12 nm for monoUiO-66-NH2-30%-A and full-width-half-maximum (FWHM) analyses for each system returning values of 13 nm and 11 nm, respectively. The pore sizes also improved, as shown in Fig. 5, in the sense that, before heating, the most prominent pores had averaged widths of approximately 63 nm, whereas, upon heating, this average went up to approximately 90 nm. Overall, BET data reveal an increase in the N2 gas uptake of 216 cm3 g−1 in monoUiO-66-NH2-30%-A, the greater N2 uptake seen at higher relative pressure in this monolith supporting the thesis that thermally-induced ligand degradation has afforded increased mesoporosity.81
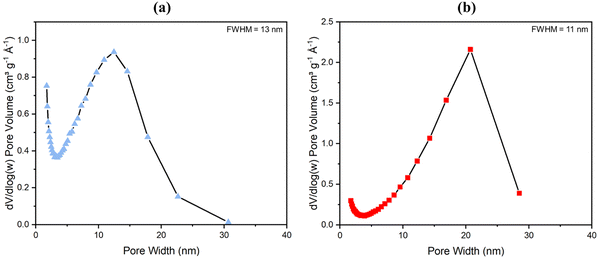 | ||
| Fig. 5 The BJH pore distribution with FWHM analysis for (a) monoUiO-66-NH2-30%-B and (b) monoUiO-66-NH2-30%-A. | ||
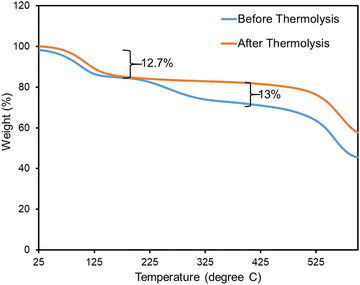
TGA was used to verify the stability of our samples before and after heat treatment (Fig. 6). The TGA data for both monoUiO-66-NH2-30%-B and monoUiO-66-NH2-30%-A displayed an initial weight loss of around 12.7% in the temperature range of 60 °C to 160 °C, which was attributed to the loss of moisture absorbed from the air, and residual AcOH (boiling point = 117.9 °C) also seen in the 1H NMR spectrum of each (Fig. S9 and S11, ESI†). From this temperature range up to approximately 525 °C, monoUiO-66-NH2-30%-A showed no further weight loss, a sign of high thermal stability after thermolysis. However, monoUiO-66-NH2-30%-B demonstrated another weight loss of around 13% from the temperature of 205 °C, which could be attributed to the decomposition of BDC-NH2. It aligns with the literature,74,80 which also revealed the gradual decomposition of UiO-66-NH2 from temperatures of approximately 200 °C upwards. Both monoliths finally decomposed at temperatures above 525 °C, consistent with the degradation of monoUiO-66 (ca. 550 °C).74,80
Lastly, the mechanical properties of both MOFs were studied using nanoindentation. The elastic and plastic properties of monoUiO-66-NH2-30%-B and monoUiO-66-NH2-30%-A were determined, as shown in Table S1 (also Fig. S15–S26, ESI†). The monoliths were indented to depths of 1000 nm and 2000 nm, and their modulus of elasticity and hardness were recorded. At a depth of 1000 nm, monoUiO-66-NH2-30%-B had an indentation modulus of 6.1 ± 0.2 GPa and hardness of 185 ± 10 MPa; and at 2000 nm, the indentation modulus was 6.0 ± 0.2 GPa and hardness was 180 ± 14 MPa. These values were comparable to previously reported mesoporous monoUiO-66 (E = 4.3 ± 0.9 GPa, H = 0.11 ± 0.02 GPa),74 lending weight to the view that monolith formation was being observed here. After thermolysis, the indentation modulus and hardness of monoUiO-66-NH2-30%-A reduced to 4.8 ± 0.3 GPa and 169 ± 16 MPa at 1000 nm and 4.6 ± 0.2 GPa and 155 ± 13 MPa at 2000 nm, respectively. This result was expected since materials tend to weaken and become brittle when exposed to high temperatures, and the monoliths are no exception.
Water sorption studies
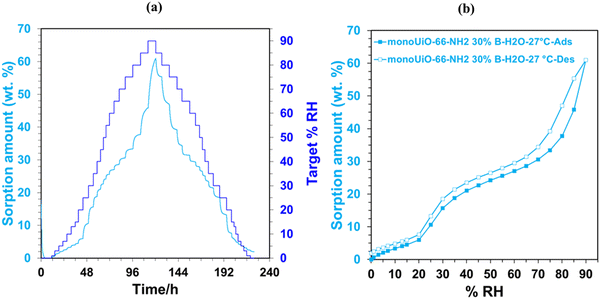
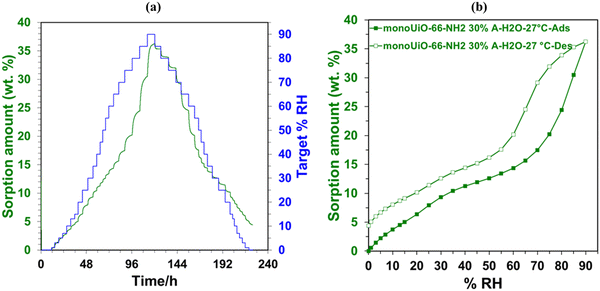
An Adventure DVS was used to analyse the water sorption capabilities of monoUiO-66-NH2-30%-B and monoUiO-66-NH2-30%-A. Before water sorption analysis, the samples were activated at 160 °C for 6 hours at 0% RH. The method used for collecting the isotherms at 27 °C had a dm/dt = 0.001. The kinetics plots of the two monoliths, monoUiO-66-NH2-30%-B and monoUiO-66-NH2-30%-A, were measured using a dm/dt lower than 0.001 to ensure equilibrium in each step (Fig. 7(a) and 8(a)). The time to complete the adsorption–desorption process was 224 h.Monolithic UiO-66 MOFs have not been widely applied to water sorption studies. However, Çamur et al.80 recently achieved exciting results with monolithic UiO-66 and UiO-66-NH2. That study focused on comparing monolithic UiO-66 and UiO-66-NH2 to their powder counterparts. In this work, we go a step further to explore the effects on water sorption of creating bigger pores in monoliths through linker thermolysis. Fig. 7(b) and 8(b) give the mean sorption isotherms for monoUiO-66-NH2-30%-B and monoUiO-66-NH2-30%-A, respectively (mean values of triplicate cycles, as shown in Fig. S28 and S29, ESI†). Meanwhile, Fig. 7(a) and 8(a) (also Fig. S27 and S30, ESI†) give the corresponding kinetic plots for the two materials, respectively. Both monoliths were highly stable during the analysis, as evidenced by the similar sorption and desorption paths meaning the samples underwent no phase change during these two operations. Fig. 7(a) and 8(a) show the step-wise sorption and desorption in the samples. The time taken for the mass change per minute reveals the kinetic information of the samples, like the water uptake per given time, and the change of mass at the end of each humidity step plotted against RH gives the isotherm plots (Fig. 7(b) and 8(b)). The water uptake was reported in wt%, and this was calculated using the formula given in eqn (1):
 | (1) |
The water sorption isotherms for both samples were sigmoidal or S-shaped and demonstrated hysteresis loops, typical of mesoporous materials. They both had low water uptake levels at 10% RH compared to literature80 (Table 2). This low intake indicated that the water affinity to the surface of these monoliths was limited. It could be linked to the hydrophobicity of the BDC linker. To prompt pore filling, higher vapour pressure was needed.14 The presence of the hydrophilic NH2-incorporating functional groups accounts for monoUiO-66-NH2-30%-B demonstrating a higher uptake of 15.6% at lower relative humidity (30% RH) compared to monoUiO-66-NH2-30%-A. At 90% RH, monoUiO-66-NH2-30%-B adsorbed 61.0 wt% water vapour, whereas the adsorption by monoUiO-66-NH2-30%-A was 36.2 wt%. Compared to pure monoUiO-66 and monoUiO-66-NH2,80 the monoUiO-66-NH2-30%-B data is excellent, showing significantly better water uptake. While the result is comparable to that reported by Jeremias et al.64 on powder UiO-66-NH2, the more tractable nature of conformed monoUiO-66-NH2 and its relatives is noteworthy. This result was attributed to the defects induced by the multivariate linkers coupled with the presence of hydrophilic amine groups. The importance of this combination is borne out by monoUiO-66-NH2-30%-A data, which showed a lower overall uptake than either parent monolith, attributed to the relative lack of hydrophilic NH2 functional groups in the thermolyzed composite. In this work, the presence of both defects and hydrophilic groups in monoUiO-66-NH2-30%-B superseded additional mesoporosity regarding water vapour uptake, highlighting the important role of interaction between the hydrophilic NH2 groups and water molecules. The maximum uptake was achieved at higher RH values, which signifies that the water vapour molecules were not just on the surface but also permeating through the pores into the interior of the monolith.52 To evaluate the monoliths’ stability, recyclability, and applicability in water sorption studies, water isotherms were collected on the same sample for up to 3 cycles, pretreating the sample at 40.0 °C before each cycle. Both monoliths remained stable during this process, as shown by Fig. S27–S30 (ESI†).
Conclusions
Monolithic MOFs have been reported to be high-density, shaped, centimetre-scale materials with excellent gas adsorption capabilities and high thermal, chemical and mechanical stability. In this work, linker thermolysis has been used to enhance the formation of mesopores in monolithic UiO-66 MOF samples that contained 30% by mass of monoaminated BDC linker. By thermally decomposing the BDC-NH2 linker in a multivariate, monolithic context, pore volumes were increased from 0.8 cm3 g−1 to 1.1 cm3 g−1, while pore widths improved from a mean of 5.2 nm to 11.5 nm. In line with this, gas adsorption properties were enhanced by more than 200 cm3 g−1. The monoliths were subsequently examined for gravimetric water sorption using DVS.Interestingly, before heating, the monolith of multivariate UiO-66-NH2-30% had lower gas adsorption properties and smaller pores than its thermolabile derivative in which degradation of the aminated linkers had been shown. In DVS studies, however, it exhibited a high water vapour uptake of 61.0% at 90% RH, and so outperformed previously reported MOF-303 and also the conformed species monoUiO-66 and monoUiO-66-NH2.80 This was attributed to the defects induced by the mixture of linkers used here coupled to hydrophilicity of the NH2 groups in the BDC-NH2. However, when compared to the monolith after heating, which had higher gas adsorption and larger pores, a water vapour uptake of 36.2% was seen at 90% RH – reinforcing the importance of linker hydrophilicity in this field.
Overall, this work extends for the first time the idea of linker thermolysis that has been recently applied to powder MOFs81 to monolithic MOFs and supports the theory that it enhances pore sizes in these materials. It further demonstrates the importance of both defects and hydrophilicity in water sorption studies. It goes on to illustrate that these must be carefully balanced, since creating more defects at the expense of hydrophilicity results in worse performance. Based on these data, the investigation of multivariate MOFs formed using a higher wt% of H2BDC-NH2 has been initiated, since the overall water sorption capabilities displayed by the monoliths reported here suggests they may be useful materials in the long term if an appropriate balance between pore volume and hydrophilicity can be achieved.
Author contributions
Linia Gedi Marazani: methodology, investigation, writing – original draft preparation; Victoria Gascon-Perez: investigation, methodology, reviewing and editing; Ayush Pathak: methodology, investigation, reviewing and editing; Michele Tricarico: methodology, investigation, reviewing and editing; Jin-Chong Tan: resources, reviewing and editing; Michael J. Zaworotko: resources, methodology, reviewing and editing; Andrew E. H. Wheatley: methodology, resources, supervision, reviewing and editing; Banothile C. E Makhubela: resources, supervision, reviewing and editing; Gift Mehlana: conceptualization, supervision, resources, reviewing and editing.Data availability
Open Data are available at https://doi.org/10.17863/CAM.111767. The authors have applied a CC BY license to the Author Accepted Manuscript version of this work. The data supporting this article have been included as part of the ESI.†Conflicts of interest
The authors declare no conflict of interest.Acknowledgements
The authors thank the Royal Society (FCG\R1\201021) and the African Academy of Sciences for funding this project. The authors also thank the Crystal Engineering Group at the University of Limerick for providing the DVS instruments. J. C. T. and M. T. thank the European Research Council (ERC) Consolidator Grant PROMOFS (grant agreement 771575). L. G. M is grateful for the financial assistance she received from the European Union (grant no. DCI-PANAF/2020/420-028), through the African Research Initiative for Scientific Excellence (ARISE), pilot programme. The UK EPSRC is thanked for supporting electron microscopy at Cambridge (EP/P030467/1).References
- UNESCO World Water Assessment Programme, The United Nations World Water Development Report 2023: partnerships and cooperation for water, 2023.
- E. Elsayed, R. AL-Dadah, S. Mahmoud, P. A. Anderson, A. Elsayed and P. G. Youssef, Desalination, 2017, 406, 25–36 CrossRef CAS.
- A. Abushawish, I. Bouaziz, I. W. Almanassra, M. M. AL-Rajabi, L. Jaber, A. K. A. Khalil, M. S. Takriff, T. Laoui, A. Shanableh, M. A. Atieh and A. Chatla, Water, 2023, 15, 1–42 CrossRef.
- A. Tiwari, M. K. Rathod and A. Kumar, Environ. Dev. Sustain., 2023, 25, 1052–1083 CrossRef.
- R. A. Mohammed and R. J. M. Alkhafaja, Eng. Sci., 2023, 1, 1–10 Search PubMed.
- J. Y. Wang, R. Z. Wang and L. W. Wang, Appl. Therm. Eng., 2016, 100, 893–901 CrossRef CAS.
- H. Ye, Z. Yuan, S. Li and L. Zhang, Appl. Therm. Eng., 2014, 62, 690–696 CrossRef CAS.
- J. Y. Wang, J. Y. Liu, R. Z. Wang and L. W. Wang, Appl. Therm. Eng., 2017, 127, 1608–1616 CrossRef CAS.
- H. W. B. Teo, A. Chakraborty and B. Han, Appl. Therm. Eng., 2017, 127, 35–45 CrossRef CAS.
- B. Han and A. Chakraborty, Microporous Mesoporous Mater., 2019, 288, 1–8 CrossRef.
- A. Entezari, M. Ejeian and R. Z. Wang, Mater. Today Energy, 2019, 13, 362–373 CrossRef.
- F. Keshavarz, Chem. Mater., 2024, 36, 439–449 CrossRef CAS.
- X. L. Lv, S. Yuan, L. H. Xie, H. F. Darke, Y. Chen, T. He, C. Dong, B. Wang, Y. Z. Zhang, J. R. Li and H. C. Zhou, J. Am. Chem. Soc., 2019, 141, 10283–10293 CrossRef CAS PubMed.
- H. Furukawa, F. Gándara, Y. B. Zhang, J. Jiang, W. L. Queen, M. R. Hudson and O. M. Yaghi, J. Am. Chem. Soc., 2014, 136, 4369–4381 CrossRef CAS PubMed.
- W. Gong, H. Xie, K. B. Idrees, F. A. Son, Z. Chen, F. Sha, Y. Liu, Y. Cui and O. K. Farha, J. Am. Chem. Soc., 2022, 144, 1826–1834 CrossRef CAS PubMed.
- B. Han and A. Chakraborty, Appl. Therm. Eng., 2020, 175, 1–10 CrossRef.
- B. Han and A. Chakraborty, Energy Convers. Manage., 2020, 213, 1–14 CrossRef.
- M. V. Solovyeva, L. G. Gordeeva, T. A. Krieger and Y. I. Aristov, Energy Convers. Manage., 2018, 174, 356–363 CrossRef CAS.
- H. W. B. Teo, A. Chakraborty and S. Kayal, Microporous Mesoporous Mater., 2018, 272, 109–116 CrossRef CAS.
- N. Hanikel, M. S. Prévot, F. Fathieh, E. A. Kapustin, H. Lyu, H. Wang, N. J. Diercks, T. G. Glover and O. M. Yaghi, ACS Cent. Sci., 2019, 5, 1699–1706 CrossRef CAS PubMed.
- H. W. B. Teo, A. Chakraborty, Y. Kitagawa and S. Kayal, Int. J. Heat Mass Transfer, 2017, 114, 621–627 CrossRef CAS.
- Y. Han, P. Das, Y. He, D. C. Sorescu, K. D. Jordan and N. L. Rosi, J. Am. Chem. Soc., 2022, 144, 19567–19575 CrossRef CAS PubMed.
- E. Elsayed, P. Anderson, R. AL-Dadah, S. Mahmoud and A. Elsayed, J. Solid State Chem., 2019, 277, 123–132 CrossRef CAS.
- H. W. B. Teo, A. Chakraborty and S. Kayal, Appl. Therm. Eng., 2017, 120, 453–462 CrossRef CAS.
- W. Shi, Y. Zhu, C. Shen, J. Shi, G. Xu, X. Xiao and R. Cao, Microporous Mesoporous Mater., 2019, 285, 129–136 CrossRef CAS.
- P. M. Schoenecker, C. G. Carson, H. Jasuja, C. J. J. Flemming and K. S. Walton, Ind. Eng. Chem. Res., 2012, 51, 6513–6519 CrossRef CAS.
- N. Al-Janabi, V. Martis, N. Servi, F. R. Siperstein and X. Fan, Chem. Eng. J., 2018, 333, 594–602 CrossRef CAS.
- S. I. Kim, T. U. Yoon, M. B. Kim, S. J. Lee, Y. K. Hwang, J. S. Chang, H. J. Kim, H. N. Lee, U. H. Lee and Y. S. Bae, Chem. Eng. J., 2016, 286, 467–475 CrossRef CAS.
- Y. Chen, L. Xia and G. Li, J. Chromatogr. A, 2022, 1677, 1–12 CrossRef PubMed.
- X. Yuan, X. Wu, J. Xiong, B. Yan, R. Gao, S. Liu, M. Zong, J. Ge and W. Lou, Nat. Commun., 2023, 14, 1–13 Search PubMed.
- X. J. Xie, Y. Wang, Q. Y. Cao, R. Krishna, H. Zeng, W. Lu and D. Li, Chem. Sci., 2023, 14, 11890–11895 RSC.
- J. Y. C. Lim, L. Goh, K. I. Otake, S. S. Goh, X. J. Loh and S. Kitagawa, Biomater. Sci., 2023, 11, 2661–2677 RSC.
- K. L. Miller, R. Lin, J. Hou, C. J. Kepert, D. M. D’Alessandro and M. B. Solomon, Mater. Adv., 2024, 5, 1868–1874 RSC.
- F. Yu, C. Wang, H. Ma, M. Song, D. Li, Y. Li, S. Li, X. Zhang and Y. Liu, Nanoscale, 2020, 12, 7000–7010 RSC.
- D. Song, J. Bae, H. Ji, M.-B. Kim, Y.-S. Bae, K. Sung Park, D. Moon and N. Cheon Jeong, J. Am. Chem. Soc., 2019, 141, 7853–7864 CrossRef CAS PubMed.
- J. B. Decoste, G. W. Peterson, B. J. Schindler, K. L. Killops, M. A. Browe and J. J. Mahle, J. Mater. Chem. A, 2013, 1, 11922–11932 RSC.
- J. E. Mondloch, M. J. Katz, N. Planas, D. Semrouni, L. Gagliardi, T. Hupp and O. K. Farha, Chem. Commun., 2014, 50, 8944–8946 RSC.
- N. Hanikel, X. Pei, S. Chheda, H. Lyu, W. Jeong, J. Sauer, L. Gagliardi and O. M. Yaghi, Science, 2021, 374, 454–459 CrossRef CAS PubMed.
- R. G. Abdulhalim, P. M. Bhatt, Y. Belmabkhout, A. Shkurenko, K. Adil, L. J. Barbour and M. Eddaoudi, J. Am. Chem. Soc., 2017, 139, 10715–10722 CrossRef CAS PubMed.
- X. Liu, X. Wang and F. Kapteijn, Chem. Rev., 2020, 120, 8303–8377 CrossRef CAS PubMed.
- N. Hanikel, M. S. Prévot and O. M. Yaghi, Nat. Nanotechnol., 2020, 15, 348–355 CrossRef CAS PubMed.
- D. A. Evangelou, A. D. Pournara, V. I. Karagianni, C. Dimitriou, E. K. Andreou, Y. Deligiannakis, G. S. Armatas and M. J. Manos, ACS Appl. Mater. Interfaces, 2024, 16, 12672–12685 CrossRef CAS PubMed.
- Q. Li, Q. Liu, J. Zhao, Y. Hua, J. Sun, J. Duan and W. Jin, J. Membr. Sci., 2017, 544, 68–78 CrossRef CAS.
- H. Kim, S. Yang, S. R. Rao, S. Narayanan, E. A. Kapustin, H. Furukawa, A. S. Umans, O. M. Yaghi and E. N. Wang, Science, 2017, 356, 430–434 CrossRef CAS PubMed.
- Z. Guo, K. Li, Y. Wu, J. Wang and Q. Li, Microporous Mesoporous Mater., 2021, 328, 1–7 CrossRef.
- H. Zhao, Q. Li, Z. Wang, T. Wu and M. Zhang, Microporous Mesoporous Mater., 2020, 297, 1–7 Search PubMed.
- M. J. Kalmutzki, C. S. Diercks and O. M. Yaghi, Adv. Mater., 2018, 30, 1–26 CrossRef PubMed.
- M. S. Thavalengal, M. A. Jamil, M. Mehroz, B. Bin Xu, H. Yaqoob, M. Sultan, N. Imtiaz and M. W. Shahzad, Energies, 2023, 16, 1–27 CrossRef.
- Z. Ahrestani, S. Sadeghzadeh and H. B. Motejadded Emrooz, RSC Adv., 2023, 13, 10273–10307 RSC.
- S. K. Henninger, H. A. Habib and C. Janiak, J. Am. Chem. Soc., 2009, 131, 2776–2777 CrossRef CAS PubMed.
- P. Küsgens, M. Rose, I. Senkovska, H. Fröde, A. Henschel, S. Siegle and S. Kaskel, Microporous Mesoporous Mater., 2009, 120, 325–330 CrossRef.
- M. C. Lawrence and M. J. Katz, J. Phys. Chem. C, 2022, 126, 1107–1114 CrossRef CAS.
- B. Zhang, Z. Zhu, X. Wang, X. Liu and F. Kapteijn, Adv. Funct. Mater., 2023, 1–31 Search PubMed.
- C. Wang, Y. Xing, Y. Lei, Y. Xia, C. Zhang, R. Zhang, S. Wang, P. Chen, S. Zhu, J. Li and X. Gui, Colloids Surf., A, 2021, 631, 127719 CrossRef CAS.
- M. Shivanna, A. A. Bezrukov, V. Gascón-Pérez, K. I. Otake, S. Sanda, D. J. O’Hearn, Q. Y. Yang, S. Kitagawa and M. J. Zaworotko, ACS Appl. Mater. Interfaces, 2022, 14, 39560–39566 CrossRef CAS PubMed.
- C. H. Ho, M. L. Valentine, Z. Chen, H. Xie, O. Farha, W. Xiong and F. Paesani, Commun. Chem., 2023, 6, 1–9 CrossRef PubMed.
- A. A. Bezrukov, D. J. O’Hearn, V. Gascón-Pérez, S. Darwish, A. Kumar, S. Sanda, N. Kumar, K. Francis and M. J. Zaworotko, Cell Rep. Phys. Sci., 2023, 4, 1–16 Search PubMed.
- A. J. Rieth, A. M. Wright, G. Skorupskii, J. L. Mancuso, C. H. Hendon and M. Dinca, J. Am. Chem. Soc., 2019, 141, 13858–13866 CrossRef CAS PubMed.
- S. K. Henninger, F. Jeremias, H. Kummer and C. Janiak, Eur. J. Inorg. Chem., 2012, 2625–2634 CrossRef CAS.
- D. M. Steinert, S. Ernst, S. K. Henninger and C. Janiak, Eur. J. Inorg. Chem., 2020, 4502–4515 CrossRef CAS.
- H. Kummer, F. Jeremias, A. Warlo, G. Fu, D. Fro, C. Janiak, R. Gla and S. K. Henninger, Ind. Eng. Chem. Res., 2017, 56, 8393–8398 CrossRef CAS.
- D. Lenzen, J. Zhao, S. Ernst, M. Wahiduzzaman, A. K. Inge, D. Fröhlich, H. Xu, H. Bart, C. Janiak, S. Henninger, G. Maurin, X. Zou and N. Stock, Nat. Commun., 2019, 10, 3025–3034 CrossRef PubMed.
- O. V. Gutov, W. Bury, D. A. Gomez-Gualdron, V. Krungleviciute, D. Fairen-Jimenez, J. E. Mondloch, A. A. Sarjeant, S. S. Al-Juaid, R. Q. Snurr, J. T. Hupp, T. Yildirim and O. K. Farha, Chem. – Eur. J., 2014, 20, 12389–12393 CrossRef CAS PubMed.
- F. Jeremias, V. Lozan, S. K. Henninger and C. Janiak, Dalton Trans., 2013, 42, 15967–15973 RSC.
- F. Jeremias, D. Fro, C. Janiak and S. K. Henninger, New J. Chem., 2014, 38, 1846–1852 RSC.
- K. Leus, T. Bogaerts, J. De Decker, H. Depauw, K. Hendrickx, H. Vrielinck, V. Van Speybroeck and P. Van Der Voort, Microporous Mesoporous Mater., 2016, 226, 110–116 CrossRef CAS.
- Z. Chen, X. Wang, T. Islamoglu and O. K. Farha, Inorganics, 2019, 7, 1–9 CrossRef.
- B. Han and A. Chakraborty, J. Mol. Liq., 2021, 341, 1–15 Search PubMed.
- L. Yang, K. B. Idrees, Z. Chen, J. Knapp, Y. Chen, X. Wang, R. Cao, X. Zhang, H. Xing, T. Islamoglu and O. K. Farha, ACS Appl. Nano Mater., 2021, 4, 4346–4350 CrossRef CAS.
- F. Drache, V. Bon, I. Senkovska, C. Marschelke, A. Synytska and S. Kaskel, Inorg. Chem., 2016, 55, 7206–7213 CrossRef CAS PubMed.
- T. Liu, S. Zheng and L. Yang, J. Colloid Interface Sci., 2019, 552, 134–141 CrossRef CAS PubMed.
- K. Ahmad, M. A. Nazir, A. K. Qureshi, E. Hussain, T. Najam, M. S. Javed, S. S. A. Shah, M. K. Tufail, S. Hussain, N. A. Khan, H. ur R. Shah and M. Ashfaq, Mater. Sci. Eng., B, 2020, 262, 1–11 CrossRef.
- W. Xu and O. M. Yaghi, ACS Cent. Sci., 2020, 6, 1348–1354 CrossRef CAS PubMed.
- B. M. Connolly, M. Aragones-Anglada, J. Gandara-Loe, N. A. Danaf, D. C. Lamb, J. P. Mehta, D. Vulpe, S. Wuttke, J. Silvestre-Albero, P. Z. Moghadam, A. E. H. Wheatley and D. Fairen-Jimenez, Nat. Commun., 2019, 10, 1–11 CrossRef CAS PubMed.
- D. G. Madden, R. Babu, C. Çamur, N. Rampal, J. Silvestre-Albero, T. Curtin and D. Fairen-Jimenez, Faraday Discuss., 2021, 231, 51–65 RSC.
- P. Albacete, M. Asgari, Y. Yang, A. N. Al-Shanks and D. Fairen-Jimenez, Adv. Funct. Mater., 2023, 2305979, 1–14 Search PubMed.
- C. Duan, Y. Yu, J. Li, L. Li, B. Huang, D. Chen and H. Xi, Sci. China Mater., 2021, 64, 1305–1319 CrossRef CAS.
- T. Tian, Z. Zeng, D. Vulpe, M. E. Casco, G. Divitini, P. A. Midgley, J. Silvestre-Albero, J. C. Tan, P. Z. Moghadam and D. Fairen-Jimenez, Nat. Mater., 2018, 17, 174–179 CrossRef CAS PubMed.
- T. Tian, J. Velazquez-Garcia, T. D. Bennett and D. Fairen-Jimenez, J. Mater. Chem. A, 2015, 3, 2999–3005 RSC.
- C. Çamur, R. Babu, J. A. Suárez del Pino, N. Rampal, J. Pérez-Carvajal, P. Hügenell, S. J. Ernst, J. Silvestre-Albero, I. Imaz, D. G. Madden, D. Maspoch and D. Fairen-Jimenez, Adv. Mater., 2023, 35, 1–13 CrossRef.
- L. Feng, S. Yuan, L. L. Zhang, K. Tan, J. L. Li, A. Kirchon, L. M. Liu, P. Zhang, Y. Han, Y. J. Chabal and H. C. Zhou, J. Am. Chem. Soc., 2018, 140, 2363–2372 CrossRef CAS PubMed.
- S. Chen, S. Mukherjee, B. E. G. Lucier, Y. Guo, Y. T. A. Wong, V. V. Terskikh, M. J. Zaworotko and Y. Huang, J. Am. Chem. Soc., 2019, 141, 14257–14271 CrossRef CAS PubMed.
- J. C. Tan, Fundamentals of MOF Mechanics & Structure–Mechanical Property Relationships, The Royal Society of Chemistry, Oxford, 2023 Search PubMed.
- A. J. Howarth, Y. Liu, P. Li, Z. Li, T. C. Wang, J. T. Hupp and O. K. Farha, Nat. Rev. Mater., 2016, 1, 1–15 Search PubMed.
- J. H. Cavka, S. Jakobsen, U. Olsbye, N. Guillou, C. Lamberti, S. Bordiga and K. P. Lillerud, J. Am. Chem. Soc., 2008, 6, 13850–13851 CrossRef PubMed.
- J. Winarta, B. Shan, S. M. Mcintyre, L. Ye, C. Wang, J. Liu and B. Mu, Cryst. Growth Des., 2020, 20, 1347–1362 CrossRef CAS.
Footnote |
| † Electronic supplementary information (ESI) available. See DOI: https://doi.org/10.1039/d4ma00522h |
| This journal is © The Royal Society of Chemistry 2024 |

