 Open Access Article
Synthesis of gum tragacanth-starch hydrogels for water purification
Sana
Ahmad
 * and
Saleha
Imran
Department of Chemistry, Lahore College for Women University, Lahore, Pakistan. E-mail: drsanaahmad@yahoo.com
First published on 7th October 2024
Abstract
The increasing demand for environmentally friendly materials to address environmental toxicity has prompted a shift towards natural products. This study focuses on the development of biodegradable starch-based (ST) hydrogels modified with gum tragacanth (GT) using polyvinyl alcohol (PVA) as a cross-linker. These hydrogels were utilized as efficient adsorbents for the removal of methylene blue (MB) and congo red (CR) dyes from aqueous solutions. The hydrogels were synthesized via the solution casting method, yielding four variants by adjusting the weights of ST and GT in ratios of ST/GT (2![[thin space (1/6-em)]](https://www.rsc.org/images/entities/char_2009.gif) :
:![[thin space (1/6-em)]](https://www.rsc.org/images/entities/char_2009.gif) 0, 1.5
0, 1.5![[thin space (1/6-em)]](https://www.rsc.org/images/entities/char_2009.gif) :
:![[thin space (1/6-em)]](https://www.rsc.org/images/entities/char_2009.gif) 0.5, 1
0.5, 1![[thin space (1/6-em)]](https://www.rsc.org/images/entities/char_2009.gif) :
:![[thin space (1/6-em)]](https://www.rsc.org/images/entities/char_2009.gif) 1, and 0.5
1, and 0.5![[thin space (1/6-em)]](https://www.rsc.org/images/entities/char_2009.gif) :
:![[thin space (1/6-em)]](https://www.rsc.org/images/entities/char_2009.gif) 1.5). Characterization of the hydrogels was performed using FTIR, FESEM, and TGA-DSC. During MB dye adsorption, ST/GT (0.5
1.5). Characterization of the hydrogels was performed using FTIR, FESEM, and TGA-DSC. During MB dye adsorption, ST/GT (0.5![[thin space (1/6-em)]](https://www.rsc.org/images/entities/char_2009.gif) :
:![[thin space (1/6-em)]](https://www.rsc.org/images/entities/char_2009.gif) 1.5) exhibited a remarkable removal efficiency of 97.6% within 90 minutes, at pH 10 and an initial dye concentration of 30 ppm. Similarly, for CR dye, the highest removal efficiency of 93.7% was observed with ST/GT (0.5
1.5) exhibited a remarkable removal efficiency of 97.6% within 90 minutes, at pH 10 and an initial dye concentration of 30 ppm. Similarly, for CR dye, the highest removal efficiency of 93.7% was observed with ST/GT (0.5![[thin space (1/6-em)]](https://www.rsc.org/images/entities/char_2009.gif) :
:![[thin space (1/6-em)]](https://www.rsc.org/images/entities/char_2009.gif) 1.5) under optimal conditions of 90 minutes, pH 2, and a dye concentration of 10 ppm. Kinetic studies indicated that the adsorption process followed a pseudo-second order model. Biodegradability tests confirmed the complete breakdown of the hydrogels in soil. This study successfully demonstrates the potential of using plant-based hydrogels for efficient pollutant removal and sustainable water treatment.
1.5) under optimal conditions of 90 minutes, pH 2, and a dye concentration of 10 ppm. Kinetic studies indicated that the adsorption process followed a pseudo-second order model. Biodegradability tests confirmed the complete breakdown of the hydrogels in soil. This study successfully demonstrates the potential of using plant-based hydrogels for efficient pollutant removal and sustainable water treatment.
1 Introduction
In recent years, hydrogel technology has advanced significantly, finding widespread applications across various fields such as food packaging, tissue engineering, drug delivery, wound dressing, and water purification. One of the key properties driving their popularity is their exceptional water retention capability. However, with rapid urbanization and industrialization, water quality has deteriorated, posing threats to both human health and the ecosystem.Various methods have been introduced to address water pollution, including filtration, flocculation, sedimentation, and disinfection. Despite these efforts, conventional methods often fall short of achieving cost-effectiveness and thorough purification.1–3 Hydrogels offer a promising solution through both absorption and adsorption mechanisms, particularly effective for removing pollutants like dyes and heavy metals from water.
Hydrogels possess high adsorption capacity compared to other materials like clay or activated carbon, owing to their three-dimensional porous structure. This porosity allows hydrogels to absorb water without dissolving, earning them the nickname “super absorbents.” However, the extent of porosity and swelling behavior depends on factors such as the density of cross-linking agents.4–6
Starch, a widely available natural polysaccharide, is commonly used in hydrogel formulations. However, its limited functional groups for water retention and low porosity hinder its performance.7,8 To overcome these limitations, modifications involving polysaccharides with diverse functional groups are necessary to enhance water storage capacity and pollutant adsorption.
This study focuses on the modification of starch with gum tragacanth, an exudate with hydrogel properties derived from the Astragalus plant. Gum tragacanth, composed of various sugars, offers improved water-swellable properties and selective adsorption towards cationic pollutants due to its anionic nature.9–11 Despite its extensive use in the food industry and wound healing applications, its potential for water treatment remains largely unexplored.
To address the poor sorption capacity of hydrogels, various combinations of synthetic polymers have been reported in the literature. However the merge of two natural polysaccharides is very rare to be seen. This study aims to bridge this gap by developing a copolymer hydrogel based on starch and gum tragacanth for the adsorptive removal of pollutants from wastewater. By leveraging the swellable nature of gum tragacanth and the biodegradability of both components, this research contributes to the advancement of clean water technologies.
2 Materials and methods
Starch (ST) and gum tragacanth (GT) were purchased from the local market. Polyvinyl alcohol (PVA), and sodium hydroxide (NaOH) were purchased from Sigma Aldrich, Germany. Hydrochloric acid (HCl) was purchased from AnalR, America. Commercially available congo red (CR) and methylene blue (MB) were utilized. All analytical grade chemicals were used in this work. The preparation of solutions was carried out in deionized water.2.1 Preparation of hydrogels
The copolymer hydrogels were synthesized by varying the weight ratio of ST and GT (2![[thin space (1/6-em)]](https://www.rsc.org/images/entities/char_2009.gif) :
:![[thin space (1/6-em)]](https://www.rsc.org/images/entities/char_2009.gif) 0, 1.5
0, 1.5![[thin space (1/6-em)]](https://www.rsc.org/images/entities/char_2009.gif) :
:![[thin space (1/6-em)]](https://www.rsc.org/images/entities/char_2009.gif) 0.5, 1
0.5, 1![[thin space (1/6-em)]](https://www.rsc.org/images/entities/char_2009.gif) :
:![[thin space (1/6-em)]](https://www.rsc.org/images/entities/char_2009.gif) 1, and 0.5
1, and 0.5![[thin space (1/6-em)]](https://www.rsc.org/images/entities/char_2009.gif) :
:![[thin space (1/6-em)]](https://www.rsc.org/images/entities/char_2009.gif) 1.5 w/w) with a fixed quantity of PVA (0.5 g) at 60 to 70 °C using solution casting method [20]. Homogeneous solutions of both polymers were separately prepared in 50 mL of deionized water. 0.5 g of PVA was added to 20 mL deionized water followed by heating at 80–90 °C and continual stirring until complete dissolution. All three solutions were mixed and stirred for 2 hours to ensure effective interaction with each other. The copolymer hydrogel solution was casted and dried at 60 °C.
1.5 w/w) with a fixed quantity of PVA (0.5 g) at 60 to 70 °C using solution casting method [20]. Homogeneous solutions of both polymers were separately prepared in 50 mL of deionized water. 0.5 g of PVA was added to 20 mL deionized water followed by heating at 80–90 °C and continual stirring until complete dissolution. All three solutions were mixed and stirred for 2 hours to ensure effective interaction with each other. The copolymer hydrogel solution was casted and dried at 60 °C.
2.2 Characterization
For the confirmation of the synthesis of hydrogels, a Fourier transform infrared (FTIR) spectrophotometer (scanning range 4000–500 cm−1), Shimadzu Company with IR Tracer-100 was used. FESEM micrographs were obtained using a ZEISS electron microscope to investigate the surface morphology of synthesized samples. The thermal degradation of samples was studied using DSC/TGA, SDT Q600 V. The samples were thermally treated at the rate of 10 °C min−1 over the temperature range of 25–500 °C.2.3 Swelling measurement
The dried composite hydrogels were weighed and then immersed in distilled water. The swollen hydrogel was weighed after 15 min of time intervals. The swelling measurements were continued for 24 hours. This process was carried out with all the ST/GT hydrogels constituting a fixed amount of PVA in (2![[thin space (1/6-em)]](https://www.rsc.org/images/entities/char_2009.gif) :
:![[thin space (1/6-em)]](https://www.rsc.org/images/entities/char_2009.gif) 0, 1.5
0, 1.5![[thin space (1/6-em)]](https://www.rsc.org/images/entities/char_2009.gif) :
:![[thin space (1/6-em)]](https://www.rsc.org/images/entities/char_2009.gif) 0.5, 1
0.5, 1![[thin space (1/6-em)]](https://www.rsc.org/images/entities/char_2009.gif) :
:![[thin space (1/6-em)]](https://www.rsc.org/images/entities/char_2009.gif) 1, 0.5
1, 0.5![[thin space (1/6-em)]](https://www.rsc.org/images/entities/char_2009.gif) :
:![[thin space (1/6-em)]](https://www.rsc.org/images/entities/char_2009.gif) 1.5, 0
1.5, 0![[thin space (1/6-em)]](https://www.rsc.org/images/entities/char_2009.gif) :
:![[thin space (1/6-em)]](https://www.rsc.org/images/entities/char_2009.gif) 2) hydrogels. The experiments were accomplished in duplicates of each sample. The mass of hydrogel is W, where, Ws is the mass of hydrogel after swelling, Wd is the mass of dried hydrogel. The swelling % of all the hydrogel was calculated and recorded.12
2) hydrogels. The experiments were accomplished in duplicates of each sample. The mass of hydrogel is W, where, Ws is the mass of hydrogel after swelling, Wd is the mass of dried hydrogel. The swelling % of all the hydrogel was calculated and recorded.12 | (1) |
2.4 Adsorption application
The efficacy of the blended hydrogels was studied for the adsorption of methylene blue (MB) and congo red (CR) dyes. 10 ppm of dye solutions were prepared to investigate the adsorptive performance of ST/GT hydrogels against both dyes. The adsorption test was conducted by considering three factors; contact time (15–90 min), pH (2–12), and adsorbate dose (10–40 ppm).The effect of contact time was investigated in 10 ppm of 50 mL dye solution. The initial absorbance value was noted at λmax of the dyes (MB = 665 nm, CR = 498 nm). 0.05 g of ST/GT hydrogel was added and stirring was continued under 500 rpm. After 15 min interval, the UV-Vis absorbance value was noted. This was continued for 2 hours. The procedure was carried out with all the ST/GT hydrogels (2![[thin space (1/6-em)]](https://www.rsc.org/images/entities/char_2009.gif) :
:![[thin space (1/6-em)]](https://www.rsc.org/images/entities/char_2009.gif) 0, 1.5
0, 1.5![[thin space (1/6-em)]](https://www.rsc.org/images/entities/char_2009.gif) :
:![[thin space (1/6-em)]](https://www.rsc.org/images/entities/char_2009.gif) 0.5, 1
0.5, 1![[thin space (1/6-em)]](https://www.rsc.org/images/entities/char_2009.gif) :
:![[thin space (1/6-em)]](https://www.rsc.org/images/entities/char_2009.gif) 1, and 0.5
1, and 0.5![[thin space (1/6-em)]](https://www.rsc.org/images/entities/char_2009.gif) :
:![[thin space (1/6-em)]](https://www.rsc.org/images/entities/char_2009.gif) 1.5).
1.5).
To study the influence of pH, 25 mL of 10 ppm dye solution was taken. pH was maintained (2, 4, 6, 8, 10, and 12), by the dropwise addition of HCl or NaOH. 0.025 g of ST/GT hydrogel was added and continuously stirred for 2 hours. Absorbance value before and after the addition of hydrogel was recorded. These steps were repeated for all ST/GT hydrogels.
To evaluate the role of adsorbate dose, 25 mL of 10, 20, 30, and 40 ppm of dye solutions were prepared and their absorbance value was noted at λmax of dyes. 0.025 g of ST/GT hydrogel was added to each of the solutions and stirred for 2 hours. The final absorbance value of the solutions was recorded.
2.5 Adsorption isotherm study
The adsorptive removal efficiency was calculated using eqn (2). The adsorption capacities (qe) of the ST/GT hydrogels against MB and CR dyes were calculated using eqn (3), where, qe is the capacity to adsorb measured in mg g−1. Ci and Ce are initial and equilibrium concentrations (mg L−1), respectively. V and W are the volume of solution (L) and mass of adsorbent (g), respectively. | (2) |
 | (3) |
The two most commonly used isotherms were implied to find out equilibrium adsorption characteristics. Linear form of Langmuir's isotherm is represented by the following equation,
 | (4) |
 | (5) |
Besides Langmuir's isotherm, Freundlich's isotherm model was also implied. The linear form of Freundlich's isotherm is as follows;
 | (6) |
2.6 Kinetic study
The adsorption rate of hydrogels against both dye CR and MB were analyzed. Pseudo-first and pseudo-second order were applied. Eqn (7) represents a pseudo first-order reaction.| ln(qe − qt) = ln qe − K1t | (7) |
Pseudo 2nd order is represented through the following equation,
 | (8) |
2.7 Biodegradability test
Degradation of synthesized hydrogels was studied by soil burial method.13 0.035 g of hydrogel sample was taken and buried in the soil at ambient temperature. After three days hydrogel was taken out from the soil, washed with water, and allowed to dry in an oven at 60 °C. The dried hydrogel was weighed and the sample was again buried in the soil. The measurements were taken after 3 days and continued until complete biodegradation was achieved. The process was repeated with all the hydrogels. The following equation was employed to determine weight loss; | (9) |
3 Results and discussions
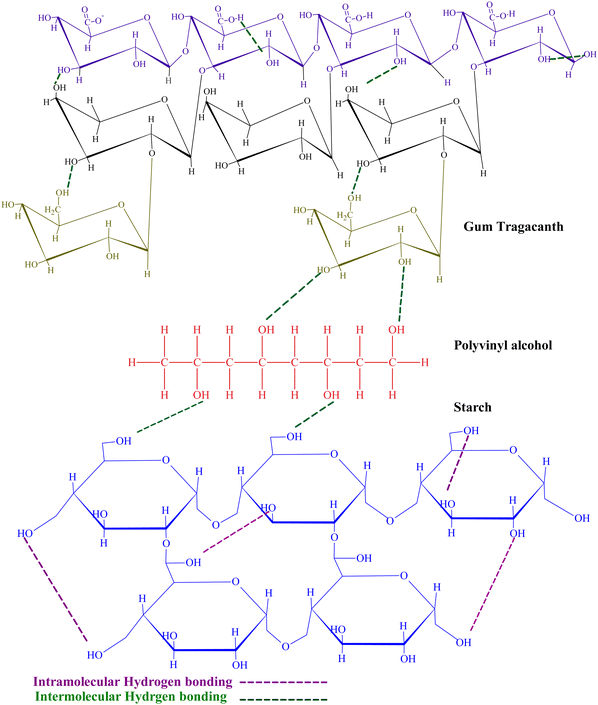
The prepared hydrogels exhibited a significant impact of polymer ratio on their chemical and physical characteristics. Among physical characteristics, water-holding capacity and surface morphology were affected. The chemical characteristics involved the nature of intermolecular interaction between ST and GT with PVA employed as a cross-linking agent. PVA concentration was kept constant to investigate the effect of ST and GT on the hydrogels. The structure of GT in Fig. 1 shows numerous hydroxyl and carboxylic acid groups, that provide the hydrophilicity and anionic character to the hydrogel. From the proposed structure in Fig. 1, –OH of ST and COOH, –COO− and –OH of GT instigated intermolecular and intramolecular hydrogen bonding. This was further affirmed when hydrogen bonding appeared as a cohesive force in the results of FTIR.3.1 FTIR investigation of ST/GT hydrogel blend
To inquire about the chemical composition and the functional groups, FTIR analysis was conducted. The spectra of hydrogels are displayed in Fig. 2.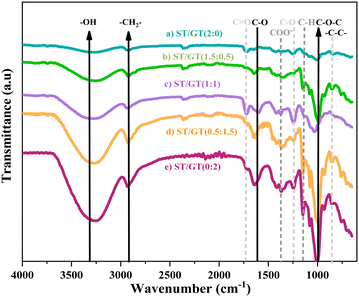 | ||
Fig. 2 FTIR spectra of (a) ST/GT (2![[thin space (1/6-em)]](https://www.rsc.org/images/entities/char_2009.gif) : :![[thin space (1/6-em)]](https://www.rsc.org/images/entities/char_2009.gif) 0) (b) ST/GT (1.5 0) (b) ST/GT (1.5![[thin space (1/6-em)]](https://www.rsc.org/images/entities/char_2009.gif) : :![[thin space (1/6-em)]](https://www.rsc.org/images/entities/char_2009.gif) 0.5) (c) ST/GT (1 0.5) (c) ST/GT (1![[thin space (1/6-em)]](https://www.rsc.org/images/entities/char_2009.gif) : :![[thin space (1/6-em)]](https://www.rsc.org/images/entities/char_2009.gif) 1) (d) ST/GT (0.5 1) (d) ST/GT (0.5![[thin space (1/6-em)]](https://www.rsc.org/images/entities/char_2009.gif) : :![[thin space (1/6-em)]](https://www.rsc.org/images/entities/char_2009.gif) 1.5) (e) ST/GT (0 1.5) (e) ST/GT (0![[thin space (1/6-em)]](https://www.rsc.org/images/entities/char_2009.gif) : :![[thin space (1/6-em)]](https://www.rsc.org/images/entities/char_2009.gif) 2). 2). | ||
All samples showed a broad band around 3255–3295 cm−1 corresponding to the stretching vibration of –OH groups suggesting the bridges of hydrogen-bonded hydroxyl groups in the polymeric matrix. A peak at 2925 cm−1 appears as a result of –CH2 stretching in alkane. The strong signal at 1034 cm−1 reveals the presence of glycosidic linkage, –C–O–C-stretch that is characteristic of gum polysaccharides.14,15 The weak absorption band at 850 cm−1 is due to C–C stretching in the carbohydrate backbone.15 The prominent signal at 1728 cm−1, which is attributed to –C![[double bond, length as m-dash]](https://www.rsc.org/images/entities/char_e001.gif) O stretching of –COOH groups, becomes eminent as the concentration of GT increases. At 1645 cm−1, the C–O stretch is recorded. The peak at 1420 cm−1 belongs to the –CH bend and is a characteristic signal of PVA.16 A weak signal at 1361 cm−1 is attributed to the C–H deformation of secondary alcohol groups.17 The broadness of this signal is evidence of the participation of –CH bending vibrations from starch as well. However, this signal became weaker as the concentration of ST decreased. The sharp signal at 1373 cm−1 showed –COO− stretch by D-galacturonic acid in GT.18,19 The peak at 1248 cm−1 belonged to –C–O-stretching vibration in polyols. Both signals are the characteristics of GT.20 All the peaks having distinctive features of PVA, GT, and ST are identified in FTIR spectra which suggest the combination has been achieved successfully. The appearance of new signals (–C
O stretching of –COOH groups, becomes eminent as the concentration of GT increases. At 1645 cm−1, the C–O stretch is recorded. The peak at 1420 cm−1 belongs to the –CH bend and is a characteristic signal of PVA.16 A weak signal at 1361 cm−1 is attributed to the C–H deformation of secondary alcohol groups.17 The broadness of this signal is evidence of the participation of –CH bending vibrations from starch as well. However, this signal became weaker as the concentration of ST decreased. The sharp signal at 1373 cm−1 showed –COO− stretch by D-galacturonic acid in GT.18,19 The peak at 1248 cm−1 belonged to –C–O-stretching vibration in polyols. Both signals are the characteristics of GT.20 All the peaks having distinctive features of PVA, GT, and ST are identified in FTIR spectra which suggest the combination has been achieved successfully. The appearance of new signals (–C![[double bond, length as m-dash]](https://www.rsc.org/images/entities/char_e001.gif) O), band broadening (–OH), and slight shifts in peak positions to lower wavenumbers are evidences of hydrogen bonding as an adhesive force.
O), band broadening (–OH), and slight shifts in peak positions to lower wavenumbers are evidences of hydrogen bonding as an adhesive force.
3.2 Field emission scanning electron microscope (FESEM)
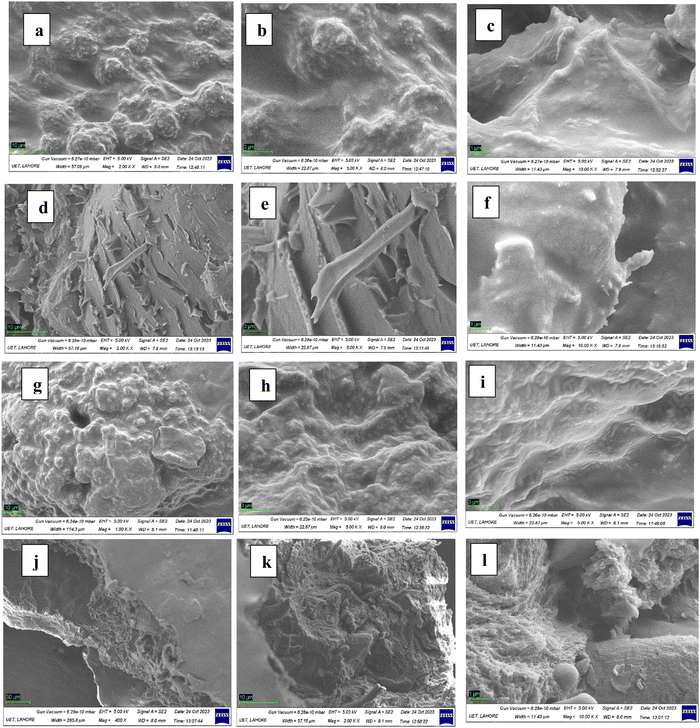
FESEM was conducted at different magnifications (×400, ×2000, ×5000 and ×10![[thin space (1/6-em)]](https://www.rsc.org/images/entities/char_2009.gif) 000) to investigate the morphological characteristics of prepared hydrogels.
000) to investigate the morphological characteristics of prepared hydrogels.
Fig. 3 shows the morphology of ST/GT (2![[thin space (1/6-em)]](https://www.rsc.org/images/entities/char_2009.gif) :
:![[thin space (1/6-em)]](https://www.rsc.org/images/entities/char_2009.gif) 0) hydrogel. From Fig. 3(a)–(c) rough surface can be seen. The pores on the surface are superficial and less shallow. Small agglomerates can also be seen which may be due to the aggregation of starch or PVA molecules. Fig. 3(d)–(f) shows the results of ST/GT (1.5
0) hydrogel. From Fig. 3(a)–(c) rough surface can be seen. The pores on the surface are superficial and less shallow. Small agglomerates can also be seen which may be due to the aggregation of starch or PVA molecules. Fig. 3(d)–(f) shows the results of ST/GT (1.5![[thin space (1/6-em)]](https://www.rsc.org/images/entities/char_2009.gif) :
:![[thin space (1/6-em)]](https://www.rsc.org/images/entities/char_2009.gif) 0.5) hydrogel that revealed sharp needle-like valleys on the surface. This aspect has made its morphology different from the previous sample since this is the evidence of enhancement in surface roughness that assisted in adsorption. The image in Fig. 3(g) and (h) is of ST/GT (1
0.5) hydrogel that revealed sharp needle-like valleys on the surface. This aspect has made its morphology different from the previous sample since this is the evidence of enhancement in surface roughness that assisted in adsorption. The image in Fig. 3(g) and (h) is of ST/GT (1![[thin space (1/6-em)]](https://www.rsc.org/images/entities/char_2009.gif) :
:![[thin space (1/6-em)]](https://www.rsc.org/images/entities/char_2009.gif) 1) which demonstrates the porous structure of hydrogel due to a cross-linked network. The surface heterogeneity displayed in Fig. 3(i) occurs as a result of the increased concentration of gum in the polymeric matrix. The image of ST/GT (0.5
1) which demonstrates the porous structure of hydrogel due to a cross-linked network. The surface heterogeneity displayed in Fig. 3(i) occurs as a result of the increased concentration of gum in the polymeric matrix. The image of ST/GT (0.5![[thin space (1/6-em)]](https://www.rsc.org/images/entities/char_2009.gif) :
:![[thin space (1/6-em)]](https://www.rsc.org/images/entities/char_2009.gif) 1.5) in Fig. 3(j) indicated the dominance of surface roughness. The sharp needle-like valleys can be seen. In Fig. 3(k) along with rough surface, shallow and dense pores can also be observed. These results are in agreement with the adsorption application since maximum adsorption is shown by ST/GT (0.5
1.5) in Fig. 3(j) indicated the dominance of surface roughness. The sharp needle-like valleys can be seen. In Fig. 3(k) along with rough surface, shallow and dense pores can also be observed. These results are in agreement with the adsorption application since maximum adsorption is shown by ST/GT (0.5![[thin space (1/6-em)]](https://www.rsc.org/images/entities/char_2009.gif) :
:![[thin space (1/6-em)]](https://www.rsc.org/images/entities/char_2009.gif) 1.5), owing to its most heterogeneous surface among all samples. To conclude, the formation of a three-dimensional network within hydrogel has led to the heterogeneous morphology of ST/GT hydrogels that are observed in FESEM micrographs.
1.5), owing to its most heterogeneous surface among all samples. To conclude, the formation of a three-dimensional network within hydrogel has led to the heterogeneous morphology of ST/GT hydrogels that are observed in FESEM micrographs.
3.3 Simultaneous TGA-DSC
To evaluate the thermal stability of prepared samples, thermo gravimetric analysis was carried out simultaneous to differential scanning calorimetry. Fig. 4 shows the TGA results of prepared hydrogels. The initial decomposition temperature (IDT) and final decomposition temperatures (FDT) along with weight loss percent are mentioned in Table 1. In each case, initial weight loss due to entrapped water molecules has been ignored, and IDT has been considered the onset of actual degradation of polymers.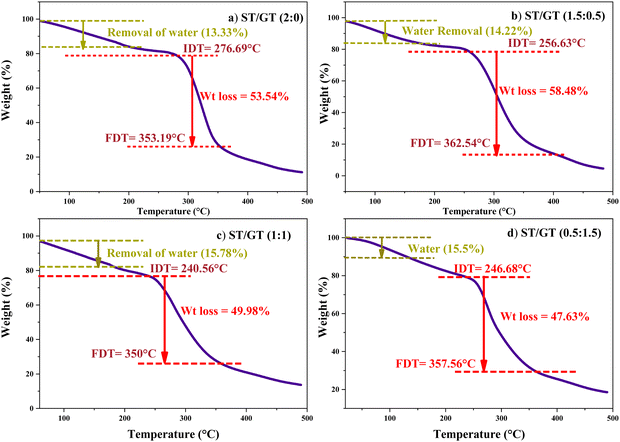 | ||
Fig. 4 TGA of ST/GT hydrogel (a) ST/GT (2![[thin space (1/6-em)]](https://www.rsc.org/images/entities/char_2009.gif) : :![[thin space (1/6-em)]](https://www.rsc.org/images/entities/char_2009.gif) 0) (b) ST/GT (1.5 0) (b) ST/GT (1.5![[thin space (1/6-em)]](https://www.rsc.org/images/entities/char_2009.gif) : :![[thin space (1/6-em)]](https://www.rsc.org/images/entities/char_2009.gif) 0.5) (c) ST/GT (1 0.5) (c) ST/GT (1![[thin space (1/6-em)]](https://www.rsc.org/images/entities/char_2009.gif) : :![[thin space (1/6-em)]](https://www.rsc.org/images/entities/char_2009.gif) 1) (d) ST/GT (0.5 1) (d) ST/GT (0.5![[thin space (1/6-em)]](https://www.rsc.org/images/entities/char_2009.gif) : :![[thin space (1/6-em)]](https://www.rsc.org/images/entities/char_2009.gif) 1.5). 1.5). | ||
| Sample code | Initial decomposition temperature (°C) | Final decomposition temperature (°C) | Weight loss% |
|---|---|---|---|
ST/GT (2![[thin space (1/6-em)]](https://www.rsc.org/images/entities/char_2009.gif) : :![[thin space (1/6-em)]](https://www.rsc.org/images/entities/char_2009.gif) 0) 0) |
276.69 | 353.19 | 53.54 |
ST/GT (1.5![[thin space (1/6-em)]](https://www.rsc.org/images/entities/char_2009.gif) : :![[thin space (1/6-em)]](https://www.rsc.org/images/entities/char_2009.gif) 0.5) 0.5) |
256.63 | 362.55 | 58.48 |
ST/GT (1![[thin space (1/6-em)]](https://www.rsc.org/images/entities/char_2009.gif) : :![[thin space (1/6-em)]](https://www.rsc.org/images/entities/char_2009.gif) 1) 1) |
240.56 | 355.56 | 49.98 |
ST/GT (0.5![[thin space (1/6-em)]](https://www.rsc.org/images/entities/char_2009.gif) : :![[thin space (1/6-em)]](https://www.rsc.org/images/entities/char_2009.gif) 1.5) 1.5) |
247.68 | 350.0 | 47.63 |
In ST/GT (2![[thin space (1/6-em)]](https://www.rsc.org/images/entities/char_2009.gif) :
:![[thin space (1/6-em)]](https://www.rsc.org/images/entities/char_2009.gif) 0) (Fig. 4(a)), an initial weight loss of 13.33% due to bound water molecules at 55.76 °C to 183.26 °C has occurred. The onset of degradation occurred at IDT of 276.69 °C and ended at FDT 353.19 °C with an associated weight loss of 53.54%. In ST/GT (1.5
0) (Fig. 4(a)), an initial weight loss of 13.33% due to bound water molecules at 55.76 °C to 183.26 °C has occurred. The onset of degradation occurred at IDT of 276.69 °C and ended at FDT 353.19 °C with an associated weight loss of 53.54%. In ST/GT (1.5![[thin space (1/6-em)]](https://www.rsc.org/images/entities/char_2009.gif) :
:![[thin space (1/6-em)]](https://www.rsc.org/images/entities/char_2009.gif) 0.5) (Fig. 4(b)), a minor weight loss of 14.22% (due to moisture content) between 99.3 °C and 159.28 °C has been recorded. The onset of degradation appeared to be at 256.63 °C and the endpoint was 362.55 °C. The weight loss is 58.48%. The ST/GT (1
0.5) (Fig. 4(b)), a minor weight loss of 14.22% (due to moisture content) between 99.3 °C and 159.28 °C has been recorded. The onset of degradation appeared to be at 256.63 °C and the endpoint was 362.55 °C. The weight loss is 58.48%. The ST/GT (1![[thin space (1/6-em)]](https://www.rsc.org/images/entities/char_2009.gif) :
:![[thin space (1/6-em)]](https://www.rsc.org/images/entities/char_2009.gif) 1) (Fig. 4c), hydrogel shows a 15.78% loss of water between 37.01–178.65 °C. Major weight loss of 49.98% has been recorded from 240.5–350.5 °C as its IDT and FDT, respectively. In ST/GT (0.5
1) (Fig. 4c), hydrogel shows a 15.78% loss of water between 37.01–178.65 °C. Major weight loss of 49.98% has been recorded from 240.5–350.5 °C as its IDT and FDT, respectively. In ST/GT (0.5![[thin space (1/6-em)]](https://www.rsc.org/images/entities/char_2009.gif) :
:![[thin space (1/6-em)]](https://www.rsc.org/images/entities/char_2009.gif) 1.5) (Fig. 4d), from 38.54 °C to 183 °C removal of water with the associated weight of 15.5% is recorded. The IDT and FDT are observed at 247.68 °C and 357.56 °C with 47.63% weight loss. Complete decomposition of the sample has been evident in all samples. The shift of IDT and FDT towards lower temperature regions suggests that GT-modified hydrogel has lower thermal stability relative to the unmodified one (ST/GT-2
1.5) (Fig. 4d), from 38.54 °C to 183 °C removal of water with the associated weight of 15.5% is recorded. The IDT and FDT are observed at 247.68 °C and 357.56 °C with 47.63% weight loss. Complete decomposition of the sample has been evident in all samples. The shift of IDT and FDT towards lower temperature regions suggests that GT-modified hydrogel has lower thermal stability relative to the unmodified one (ST/GT-2![[thin space (1/6-em)]](https://www.rsc.org/images/entities/char_2009.gif) :
:![[thin space (1/6-em)]](https://www.rsc.org/images/entities/char_2009.gif) 0). Blending with gum resulted in the heterogeneity of the microstructure of hydrogel creating regions of weaker bonds that are more susceptible towards thermal degradation.21 Conclusively, the suppression in thermal stability is the evidence of existence of intermolecular interactions between ST and GT.
0). Blending with gum resulted in the heterogeneity of the microstructure of hydrogel creating regions of weaker bonds that are more susceptible towards thermal degradation.21 Conclusively, the suppression in thermal stability is the evidence of existence of intermolecular interactions between ST and GT.
Differential scanning calorimetry is carried out concurrent with TGA. From the amount of heat flow, the processes involved in thermal degradation are deduced and interpolation of the peak area is calculated to determine the enthalpy (ΔH) of the reaction.
ST/GT (2![[thin space (1/6-em)]](https://www.rsc.org/images/entities/char_2009.gif) :
:![[thin space (1/6-em)]](https://www.rsc.org/images/entities/char_2009.gif) 0) (Fig. 5(a)) shows an endotherm corresponding to dehydration at 203 °C. Depolymerization of the polymeric backbone at 319 °C appears to be an endothermic process. This is followed by the oxidative decomposition of residual groups into polynuclear aromatic hydrocarbons at 374.98 °C.22 This process emerges an as exothermic phenomenon. Enthalpy calculated during dehydration (ΔHdehy) and depolymerization (ΔHdepoly) reaction is 145.54 J g−1 and 34.485 J g−1. During the decomposition reaction (ΔHdec), ΔH is 131.13 J g−1. In ST/GT (1.5
0) (Fig. 5(a)) shows an endotherm corresponding to dehydration at 203 °C. Depolymerization of the polymeric backbone at 319 °C appears to be an endothermic process. This is followed by the oxidative decomposition of residual groups into polynuclear aromatic hydrocarbons at 374.98 °C.22 This process emerges an as exothermic phenomenon. Enthalpy calculated during dehydration (ΔHdehy) and depolymerization (ΔHdepoly) reaction is 145.54 J g−1 and 34.485 J g−1. During the decomposition reaction (ΔHdec), ΔH is 131.13 J g−1. In ST/GT (1.5![[thin space (1/6-em)]](https://www.rsc.org/images/entities/char_2009.gif) :
:![[thin space (1/6-em)]](https://www.rsc.org/images/entities/char_2009.gif) 0.5) (Fig. 5(b)), the initial endotherm belongs to dehydration at 159.28 °C comprising ΔHdehy of 25.27 J g−1. At 322.04 °C, energy is involved in depolymerization with ΔHdepoly of 4.119 J g−1. The adjacent exotherm shows decomposition at 371.54 °C with ΔHdec of 67.37 J g−1. The ST/GT (1
0.5) (Fig. 5(b)), the initial endotherm belongs to dehydration at 159.28 °C comprising ΔHdehy of 25.27 J g−1. At 322.04 °C, energy is involved in depolymerization with ΔHdepoly of 4.119 J g−1. The adjacent exotherm shows decomposition at 371.54 °C with ΔHdec of 67.37 J g−1. The ST/GT (1![[thin space (1/6-em)]](https://www.rsc.org/images/entities/char_2009.gif) :
:![[thin space (1/6-em)]](https://www.rsc.org/images/entities/char_2009.gif) 1) (Fig. 5(c)), shows the removal of structural water at 177 °C, depolymerization at 324.98 °C followed by complete decomposition at 382.24 °C. ΔHdehy is found to be 116.81 J g−1. ΔHdepoly and ΔHdec are noted to be 9.242 J g−1 and 28 J g−1. In ST/GT (0.5
1) (Fig. 5(c)), shows the removal of structural water at 177 °C, depolymerization at 324.98 °C followed by complete decomposition at 382.24 °C. ΔHdehy is found to be 116.81 J g−1. ΔHdepoly and ΔHdec are noted to be 9.242 J g−1 and 28 J g−1. In ST/GT (0.5![[thin space (1/6-em)]](https://www.rsc.org/images/entities/char_2009.gif) :
:![[thin space (1/6-em)]](https://www.rsc.org/images/entities/char_2009.gif) 1.5) (Fig. 5(d)), a dehydration reaction is noted at 240 °C. Thermal degradation of the sample begins with the depolymerization of carboxylate groups corresponding to carbohydrate backbone at 331.07 °C, followed by decomposition of byproducts at 374.8 °C. ΔHdehy is 186.63 J g−1. ΔHdepoly and ΔHdec are 40.93 J g−1 and 5.72 J g−1, respectively. Comparative analysis with other DSC curves suggests that as the quantity of gum polysaccharide increases, the area of peak also enhances. This is due to the large number of hydrophilic functional groups introduced by GT results in the enhancement of hydrogen bonding in the polymer matrix. Followed by the same reason, the shift in depolymerization and decomposition temperatures was also recorded. The ordered framework with strong intermolecular interactions of both polysaccharides did not allow the PVA to get miscible in the polymeric matrix, thereby leading to the absence of Tg in all the samples.
1.5) (Fig. 5(d)), a dehydration reaction is noted at 240 °C. Thermal degradation of the sample begins with the depolymerization of carboxylate groups corresponding to carbohydrate backbone at 331.07 °C, followed by decomposition of byproducts at 374.8 °C. ΔHdehy is 186.63 J g−1. ΔHdepoly and ΔHdec are 40.93 J g−1 and 5.72 J g−1, respectively. Comparative analysis with other DSC curves suggests that as the quantity of gum polysaccharide increases, the area of peak also enhances. This is due to the large number of hydrophilic functional groups introduced by GT results in the enhancement of hydrogen bonding in the polymer matrix. Followed by the same reason, the shift in depolymerization and decomposition temperatures was also recorded. The ordered framework with strong intermolecular interactions of both polysaccharides did not allow the PVA to get miscible in the polymeric matrix, thereby leading to the absence of Tg in all the samples.
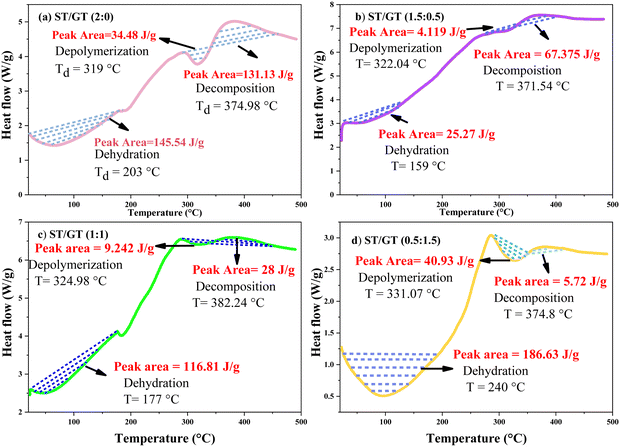 | ||
Fig. 5 DSC of ST/GT hydrogel (a) ST/GT (2![[thin space (1/6-em)]](https://www.rsc.org/images/entities/char_2009.gif) : :![[thin space (1/6-em)]](https://www.rsc.org/images/entities/char_2009.gif) 0) (b) ST/GT (1.5 0) (b) ST/GT (1.5![[thin space (1/6-em)]](https://www.rsc.org/images/entities/char_2009.gif) : :![[thin space (1/6-em)]](https://www.rsc.org/images/entities/char_2009.gif) 0.5) (c) ST/GT (1 0.5) (c) ST/GT (1![[thin space (1/6-em)]](https://www.rsc.org/images/entities/char_2009.gif) : :![[thin space (1/6-em)]](https://www.rsc.org/images/entities/char_2009.gif) 1) (d) ST/GT (0.5 1) (d) ST/GT (0.5![[thin space (1/6-em)]](https://www.rsc.org/images/entities/char_2009.gif) : :![[thin space (1/6-em)]](https://www.rsc.org/images/entities/char_2009.gif) 1.5). 1.5). | ||
3.4 Swelling measurement
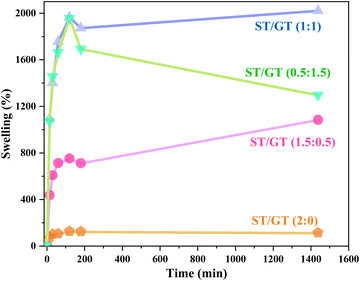
In Fig. 6, the comparative analysis of swelling capacities of all hydrogels for 24 h is displayed.For unmodified starch-based hydrogel ST/GT (2![[thin space (1/6-em)]](https://www.rsc.org/images/entities/char_2009.gif) :
:![[thin space (1/6-em)]](https://www.rsc.org/images/entities/char_2009.gif) 0), the swelling% increased initially and reached its highest value in 120 min i.e. 123%. After 120 min, it started to decrease and within 24 hours it dropped down to 111%. With the inclusion of gum in ST/GT (1.5
0), the swelling% increased initially and reached its highest value in 120 min i.e. 123%. After 120 min, it started to decrease and within 24 hours it dropped down to 111%. With the inclusion of gum in ST/GT (1.5![[thin space (1/6-em)]](https://www.rsc.org/images/entities/char_2009.gif) :
:![[thin space (1/6-em)]](https://www.rsc.org/images/entities/char_2009.gif) 0.5), the swelling got better and it reached 750% within 120 min. After 24 h, 1082% swelling capacity was observed. This is attributed to the hydrophilic functional groups introduced as a result of the modification with GT. For ST/GT (1
0.5), the swelling got better and it reached 750% within 120 min. After 24 h, 1082% swelling capacity was observed. This is attributed to the hydrophilic functional groups introduced as a result of the modification with GT. For ST/GT (1![[thin space (1/6-em)]](https://www.rsc.org/images/entities/char_2009.gif) :
:![[thin space (1/6-em)]](https://www.rsc.org/images/entities/char_2009.gif) 1), the swelling reached 2021% in 24 h. For ST/GT (0.5
1), the swelling reached 2021% in 24 h. For ST/GT (0.5![[thin space (1/6-em)]](https://www.rsc.org/images/entities/char_2009.gif) :
:![[thin space (1/6-em)]](https://www.rsc.org/images/entities/char_2009.gif) 1.5), the swelling was compromised. During 24 hours 1295% swelling was recorded. This is due to the high concentration of gum, which increased the content of hydrophilic groups more than a certain extent. As a result, the hydrogel started to disperse in water.
1.5), the swelling was compromised. During 24 hours 1295% swelling was recorded. This is due to the high concentration of gum, which increased the content of hydrophilic groups more than a certain extent. As a result, the hydrogel started to disperse in water.
The capability to swell in ST/GT hydrogels was observed when hydrophilic and hydrophobic components of hydrogel interacted with the bound water molecules, osmotic driving forces carried more water in its network. The empty spaces started to fill with water. But the physical cross-links introduced by the cross-linker, prevented excess of swelling, thereby avoiding complete dilution. Subsequently, a point was reached where hydrogel did not swell anymore nor went to infinite dilution, rather equilibrium was established where the degree of swelling became equal to the degree of dissolution. And as evidence of that, the hydrogel started to disperse.23 From the swelling studies, the water retention property of ST/GT hydrogels was affirmed, which is an important factor in wastewater remediation.
3.5 Adsorption study of ST/GT hydrogel
Blended hydrogels were used in adsorption application against methylene blue (MB) and congo red (CR) dyes. The effect of three factors on the adsorption process was taken into consideration, pH, concentration, and time.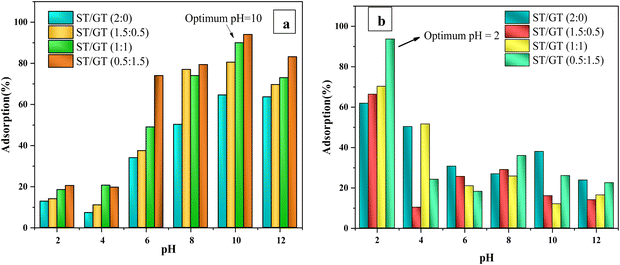 | ||
| Fig. 7 Comparative analysis of percentage adsorption on ST/GT hydrogels at different pH (a) methylene blue (b) congo red. | ||
The results indicated that although all hydrogel blends functioned best in alkaline media, at pH 10, the hydrogels incorporated with GT showed much better results relative to unmodified ones. ST/GT (2![[thin space (1/6-em)]](https://www.rsc.org/images/entities/char_2009.gif) :
:![[thin space (1/6-em)]](https://www.rsc.org/images/entities/char_2009.gif) 0) showed maximum removal efficiency of 64.54% at pH 10 whereas ST/GT (1.5
0) showed maximum removal efficiency of 64.54% at pH 10 whereas ST/GT (1.5![[thin space (1/6-em)]](https://www.rsc.org/images/entities/char_2009.gif) :
:![[thin space (1/6-em)]](https://www.rsc.org/images/entities/char_2009.gif) 0.5) and (1
0.5) and (1![[thin space (1/6-em)]](https://www.rsc.org/images/entities/char_2009.gif) :
:![[thin space (1/6-em)]](https://www.rsc.org/images/entities/char_2009.gif) 1) showed enhanced adsorption with 80.51% and 90% removal efficiency, respectively. The highest adsorption percentage recorded was 94%, which was given by ST/GT (0.5
1) showed enhanced adsorption with 80.51% and 90% removal efficiency, respectively. The highest adsorption percentage recorded was 94%, which was given by ST/GT (0.5![[thin space (1/6-em)]](https://www.rsc.org/images/entities/char_2009.gif) :
:![[thin space (1/6-em)]](https://www.rsc.org/images/entities/char_2009.gif) 1.5) at pH 10. All the blends showed their maximum adsorption at this pH which was then concluded to be the optimized pH for the adsorption of methylene blue on ST/GT hydrogels. The poor functioning of blended hydrogels in acidic media was due to the protonation of its binding sites (–OH and –COOH). The surface charge of hydrogel got positive leading to electrostatic repulsion with MB. On the contrary, in alkaline media, deprotonating of sites had led to the formation of O− and –COO−. Electrostatic attraction alleviated the adsorption of MB.
1.5) at pH 10. All the blends showed their maximum adsorption at this pH which was then concluded to be the optimized pH for the adsorption of methylene blue on ST/GT hydrogels. The poor functioning of blended hydrogels in acidic media was due to the protonation of its binding sites (–OH and –COOH). The surface charge of hydrogel got positive leading to electrostatic repulsion with MB. On the contrary, in alkaline media, deprotonating of sites had led to the formation of O− and –COO−. Electrostatic attraction alleviated the adsorption of MB.
Fig. 7(b) depicts the comparative analysis of adsorption percentages of the prepared hydrogels against CR dye. From the results, it was clear that all the hydrogels showed their best performance in acidic media, at pH 2. ST/GT (2![[thin space (1/6-em)]](https://www.rsc.org/images/entities/char_2009.gif) :
:![[thin space (1/6-em)]](https://www.rsc.org/images/entities/char_2009.gif) 0) hydrogel removed 50.26% of CR dye from its aqueous solution, whereas the modified hydrogels gave relatively better results. ST/GT (1.5
0) hydrogel removed 50.26% of CR dye from its aqueous solution, whereas the modified hydrogels gave relatively better results. ST/GT (1.5![[thin space (1/6-em)]](https://www.rsc.org/images/entities/char_2009.gif) :
:![[thin space (1/6-em)]](https://www.rsc.org/images/entities/char_2009.gif) 0.5) and (1
0.5) and (1![[thin space (1/6-em)]](https://www.rsc.org/images/entities/char_2009.gif) :
:![[thin space (1/6-em)]](https://www.rsc.org/images/entities/char_2009.gif) 1) showed enhanced adsorption with 66.31% and 70% removal efficiency, respectively. The highest removal efficiency in acidic media was 93.68% at pH 2 and this was given by ST/GT (0.5
1) showed enhanced adsorption with 66.31% and 70% removal efficiency, respectively. The highest removal efficiency in acidic media was 93.68% at pH 2 and this was given by ST/GT (0.5![[thin space (1/6-em)]](https://www.rsc.org/images/entities/char_2009.gif) :
:![[thin space (1/6-em)]](https://www.rsc.org/images/entities/char_2009.gif) 1.5). As the pH increased, no significant improvement in the adsorption efficiency was observed. Thus, for blended hydrogels, the optimized pH was 2 against CR. The removal efficiency of hydrogels was found to get better in an acidic medium owing to the protonation of binding sites. Eventually, anionic dye molecules get attached from their negative centers (−SO3) to the hydrogel's surface. In an alkaline environment, no noticeable rise in removal efficiencies was due to similar surface charges, owing to the deprotonated binding sites of ST/GT hydrogels and anionic dye molecules.
1.5). As the pH increased, no significant improvement in the adsorption efficiency was observed. Thus, for blended hydrogels, the optimized pH was 2 against CR. The removal efficiency of hydrogels was found to get better in an acidic medium owing to the protonation of binding sites. Eventually, anionic dye molecules get attached from their negative centers (−SO3) to the hydrogel's surface. In an alkaline environment, no noticeable rise in removal efficiencies was due to similar surface charges, owing to the deprotonated binding sites of ST/GT hydrogels and anionic dye molecules.
From the results of the pH effect, it can be concluded that adsorption was a surface phenomenon, where the charge on the surface of the adsorbent greatly influenced the adsorbent-adsorbate interaction.
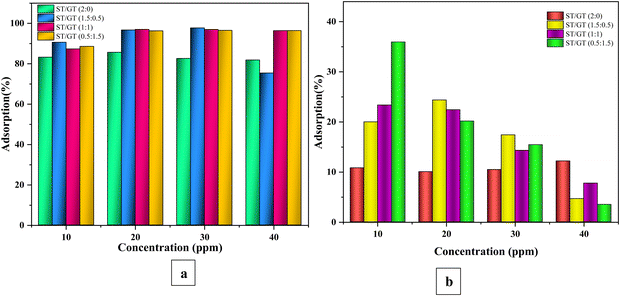 | ||
| Fig. 8 Comparative analysis of percentage adsorption by ST/GT hydrogels with different initial (a) MB concentration (b) CR concentration. | ||
ST/GT (2![[thin space (1/6-em)]](https://www.rsc.org/images/entities/char_2009.gif) :
:![[thin space (1/6-em)]](https://www.rsc.org/images/entities/char_2009.gif) 0) showed a gradual and slow rise in adsorption up till the dye concentration was 20 ppm. The maximum recorded adsorption was 85.6%, after which it became constant. Due to the limited sites available, early saturation was achieved. However, for ST/GT (1.5
0) showed a gradual and slow rise in adsorption up till the dye concentration was 20 ppm. The maximum recorded adsorption was 85.6%, after which it became constant. Due to the limited sites available, early saturation was achieved. However, for ST/GT (1.5![[thin space (1/6-em)]](https://www.rsc.org/images/entities/char_2009.gif) :
:![[thin space (1/6-em)]](https://www.rsc.org/images/entities/char_2009.gif) 0.5, 1
0.5, 1![[thin space (1/6-em)]](https://www.rsc.org/images/entities/char_2009.gif) :
:![[thin space (1/6-em)]](https://www.rsc.org/images/entities/char_2009.gif) 1, 0.5
1, 0.5![[thin space (1/6-em)]](https://www.rsc.org/images/entities/char_2009.gif) :
:![[thin space (1/6-em)]](https://www.rsc.org/images/entities/char_2009.gif) 1.5) the dye concentration and adsorption went proportional with each other till 30 ppm. No noticeable rise in adsorption efficiency was recorded at 40 ppm. For ST/GT (1.5
1.5) the dye concentration and adsorption went proportional with each other till 30 ppm. No noticeable rise in adsorption efficiency was recorded at 40 ppm. For ST/GT (1.5![[thin space (1/6-em)]](https://www.rsc.org/images/entities/char_2009.gif) :
:![[thin space (1/6-em)]](https://www.rsc.org/images/entities/char_2009.gif) 0.5), the highest adsorption recorded was 97.7%. ST/GT (1
0.5), the highest adsorption recorded was 97.7%. ST/GT (1![[thin space (1/6-em)]](https://www.rsc.org/images/entities/char_2009.gif) :
:![[thin space (1/6-em)]](https://www.rsc.org/images/entities/char_2009.gif) 1) and ST/GT (0.5
1) and ST/GT (0.5![[thin space (1/6-em)]](https://www.rsc.org/images/entities/char_2009.gif) :
:![[thin space (1/6-em)]](https://www.rsc.org/images/entities/char_2009.gif) 1.5) hydrogel showed the maximum adsorption of 96.98% and 96.5%, respectively. This enhanced removal efficiency is ascribed to the vacant sites available for the uptake of MB molecules. To conclude, 20 ppm and 30 ppm are the optimum concentrations for unmodified and modified hydrogels, respectively, for adsorptive removal of MB.
1.5) hydrogel showed the maximum adsorption of 96.98% and 96.5%, respectively. This enhanced removal efficiency is ascribed to the vacant sites available for the uptake of MB molecules. To conclude, 20 ppm and 30 ppm are the optimum concentrations for unmodified and modified hydrogels, respectively, for adsorptive removal of MB.
Fig. 8(b) depicts the comparative analysis of adsorption percentages of the prepared hydrogels at different initial concentrations of CR dye. It was clear that the change in the initial concentration of CR dye did not show a significant impact on the hydrogels. For ST/GT (2![[thin space (1/6-em)]](https://www.rsc.org/images/entities/char_2009.gif) :
:![[thin space (1/6-em)]](https://www.rsc.org/images/entities/char_2009.gif) 0), the adsorptive removal efficiency reached from 10.8 to 12.17% as the solution concentration reached from 10 ppm to 40 ppm. No noticeable improvement was recorded. For modified hydrogels (1.5
0), the adsorptive removal efficiency reached from 10.8 to 12.17% as the solution concentration reached from 10 ppm to 40 ppm. No noticeable improvement was recorded. For modified hydrogels (1.5![[thin space (1/6-em)]](https://www.rsc.org/images/entities/char_2009.gif) :
:![[thin space (1/6-em)]](https://www.rsc.org/images/entities/char_2009.gif) 0.5, 1
0.5, 1![[thin space (1/6-em)]](https://www.rsc.org/images/entities/char_2009.gif) :
:![[thin space (1/6-em)]](https://www.rsc.org/images/entities/char_2009.gif) 1, 0.5
1, 0.5![[thin space (1/6-em)]](https://www.rsc.org/images/entities/char_2009.gif) :
:![[thin space (1/6-em)]](https://www.rsc.org/images/entities/char_2009.gif) 1.5), the removal efficiency dropped with the increase in CR concentration. The highest adsorption recorded was 35.94% shown by ST/GT (0.5
1.5), the removal efficiency dropped with the increase in CR concentration. The highest adsorption recorded was 35.94% shown by ST/GT (0.5![[thin space (1/6-em)]](https://www.rsc.org/images/entities/char_2009.gif) :
:![[thin space (1/6-em)]](https://www.rsc.org/images/entities/char_2009.gif) 1.5) in 10 ppm of dye concentration. Thus, 10 ppm of initial CR dye concentration was the optimized parameter for adsorptive removal with 0.025 g of hydrogel.
1.5) in 10 ppm of dye concentration. Thus, 10 ppm of initial CR dye concentration was the optimized parameter for adsorptive removal with 0.025 g of hydrogel.
From the results, contradictory behavior of ST/GT hydrogel in the adsorption of MB and CR dye was spotted. At constant ST/GT hydrogel concentration, efficient adsorption was achieved with MB. This is because the high concentration of dye molecules provided a considerable extent of thrust force that overcame resistances faced during the pollutant transfer from the liquid phase (dye solution) to a solid phase (adsorbent surface).24 However, in the case of CR dye, external mass transfer resistance dominated the boundary layer of fluid adjacent to the hydrogel surface. The sites and pores on hydrogel were agglomerated by adsorbed dye molecules. Consequently, the probability of adsorbed CR molecules to diffuse deeper and the mobility of upcoming molecules diminished. The slower movement of CR molecules through the boundary layer led to reduced adsorption rates.
The Table 2 shows the comparative analysis of calculated and experimental qe values and R2 values of applied isotherm models with MB dye.
| Methylene blue | |||||
|---|---|---|---|---|---|
| Types of isotherms | Parameters | ST/GT (2![[thin space (1/6-em)]](https://www.rsc.org/images/entities/char_2009.gif) : :![[thin space (1/6-em)]](https://www.rsc.org/images/entities/char_2009.gif) 0) 0) |
ST/GT (1.5![[thin space (1/6-em)]](https://www.rsc.org/images/entities/char_2009.gif) : :![[thin space (1/6-em)]](https://www.rsc.org/images/entities/char_2009.gif) 0.5) 0.5) |
ST/GT (1![[thin space (1/6-em)]](https://www.rsc.org/images/entities/char_2009.gif) : :![[thin space (1/6-em)]](https://www.rsc.org/images/entities/char_2009.gif) 1) 1) |
ST/GT (0.5![[thin space (1/6-em)]](https://www.rsc.org/images/entities/char_2009.gif) : :![[thin space (1/6-em)]](https://www.rsc.org/images/entities/char_2009.gif) 1.5) 1.5) |
| Langmuir | q ecal (mg g−1) | 40.160 | 5.771 | 6.296 | 5.483 |
| q eexp (mg g−1) | 37.93 | 39.71 | 39.58 | 39.59 | |
| K L (L mg−1) | 1.00 | 1.00 | 1.00 | 1.01 | |
| R 2 | 0.2373 | 0.9987 | 0.9050 | 0.9502 | |
| Freundlich | K f (mg g−1) | 4.153 | 12.770 | 8.5814 | 6.278 |
| R 2 | 0.9232 | 0.7449 | 0.5299 | 0.5505 | |
| n | 0.608 | 0.710 | 0.888 | 0.629 | |
| Congo red | |||||
| Langmuir | q ecal (mg g−1) | 21.55 | 26.10 | 16.33 | 14.34 |
| q eexp (mg g−1) | 10.55 | 10.8 | 11.76 | 10.81 | |
| K L (mg g−1) | 1.00 | 1.00 | 1.00 | 1.00 | |
| R 2 | 0.864 | 0.316 | 0.753 | 0.932 | |
| Freundlich | K f (mg g−1) | 1.3907 | 1.802 | 0.175 | 0.327 |
| R 2 | 0.9643 | 0.9180 | 0.9755 | 0.9110 | |
| n | 1.722 | 1.713 | 0.4590 | 0.5358 | |
Results showed that ST/GT (2![[thin space (1/6-em)]](https://www.rsc.org/images/entities/char_2009.gif) :
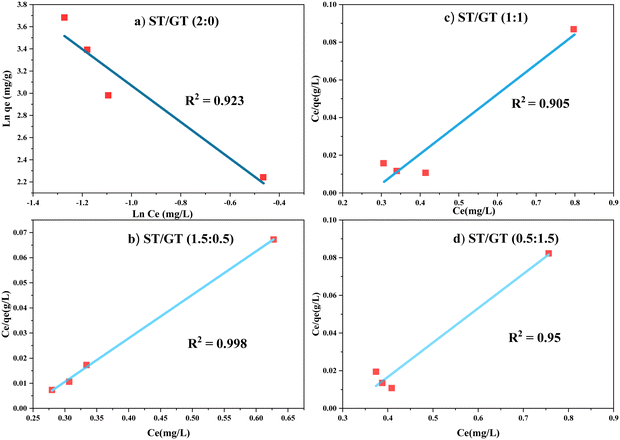
:![[thin space (1/6-em)]](https://www.rsc.org/images/entities/char_2009.gif) 0) (Fig. 9a) obeyed Freundlich isotherm. The value of the linear regression coefficient (R2) was closer to unity (R2 = 0.9232) than obtained in Langmuir isotherm (R2 = 0.2373). This verified that adsorption of MB was multilayered and the surface was heterogeneous consisting of a finite number of active sites with different binding energies. The value of n was smaller than 1 (n < 0.608 < 1) which indicated that the surface of hydrogel was unfavorable for adsorption. However, the hydrogels constituting gum; ST/GT (1.5
0) (Fig. 9a) obeyed Freundlich isotherm. The value of the linear regression coefficient (R2) was closer to unity (R2 = 0.9232) than obtained in Langmuir isotherm (R2 = 0.2373). This verified that adsorption of MB was multilayered and the surface was heterogeneous consisting of a finite number of active sites with different binding energies. The value of n was smaller than 1 (n < 0.608 < 1) which indicated that the surface of hydrogel was unfavorable for adsorption. However, the hydrogels constituting gum; ST/GT (1.5![[thin space (1/6-em)]](https://www.rsc.org/images/entities/char_2009.gif) :
:![[thin space (1/6-em)]](https://www.rsc.org/images/entities/char_2009.gif) 0.5, 1
0.5, 1![[thin space (1/6-em)]](https://www.rsc.org/images/entities/char_2009.gif) :
:![[thin space (1/6-em)]](https://www.rsc.org/images/entities/char_2009.gif) 1, 0.5
1, 0.5![[thin space (1/6-em)]](https://www.rsc.org/images/entities/char_2009.gif) :
:![[thin space (1/6-em)]](https://www.rsc.org/images/entities/char_2009.gif) 1.5) (Fig. 9(b)–(d)) agreed well with Langmuir isotherm. The values of R2 were close to unity; 0.9987 for ST/GT (1.5
1.5) (Fig. 9(b)–(d)) agreed well with Langmuir isotherm. The values of R2 were close to unity; 0.9987 for ST/GT (1.5![[thin space (1/6-em)]](https://www.rsc.org/images/entities/char_2009.gif) :
:![[thin space (1/6-em)]](https://www.rsc.org/images/entities/char_2009.gif) 0.5), 0.9053 for ST/GT (1
0.5), 0.9053 for ST/GT (1![[thin space (1/6-em)]](https://www.rsc.org/images/entities/char_2009.gif) :
:![[thin space (1/6-em)]](https://www.rsc.org/images/entities/char_2009.gif) 1), and 0.9502 for ST/GT (0.5
1), and 0.9502 for ST/GT (0.5![[thin space (1/6-em)]](https://www.rsc.org/images/entities/char_2009.gif) :
:![[thin space (1/6-em)]](https://www.rsc.org/images/entities/char_2009.gif) 1.5). This indicated that the distribution of active site on the surface of hydrogel was homogeneous and all sites had the same binding energy leading to the formation of monolayer. The value of RL was found to be smaller than 1 (0 < 0.032 < 1), which indicated favorable adsorption. The values of empirical constant K are mentioned in table. The value of qmax calculated via this model was found to be far away from the experimental value. This deviation is noticed in real adsorption systems and occurs when adsorbed molecules interact with one another.25
1.5). This indicated that the distribution of active site on the surface of hydrogel was homogeneous and all sites had the same binding energy leading to the formation of monolayer. The value of RL was found to be smaller than 1 (0 < 0.032 < 1), which indicated favorable adsorption. The values of empirical constant K are mentioned in table. The value of qmax calculated via this model was found to be far away from the experimental value. This deviation is noticed in real adsorption systems and occurs when adsorbed molecules interact with one another.25
The fitting results of both isotherms showed a discrepancy in the adsorption of MB by hydrogel that depended greatly on GT. For unmodified ST-based hydrogel (2![[thin space (1/6-em)]](https://www.rsc.org/images/entities/char_2009.gif) :
:![[thin space (1/6-em)]](https://www.rsc.org/images/entities/char_2009.gif) 0), the adsorption model followed the Freundlich isotherm. This indicated that all the active sites did not have equivalent energies. When all the sites having similar binding energies were occupied, the adsorbate molecules started interacting with the sites having dissimilar energies. Consequently, a multilayer of adsorbate was formed on the adsorbent surface. However, modification of the hydrogels with gum altered the binding energies of the adsorbent. Now the blended hydrogel carried equivalent binding energies for all sites, therefore, they had homogeneous surfaces and adhered to monolayer adsorption, thus, following the Langmuir isotherm model.
0), the adsorption model followed the Freundlich isotherm. This indicated that all the active sites did not have equivalent energies. When all the sites having similar binding energies were occupied, the adsorbate molecules started interacting with the sites having dissimilar energies. Consequently, a multilayer of adsorbate was formed on the adsorbent surface. However, modification of the hydrogels with gum altered the binding energies of the adsorbent. Now the blended hydrogel carried equivalent binding energies for all sites, therefore, they had homogeneous surfaces and adhered to monolayer adsorption, thus, following the Langmuir isotherm model.
Table 2 shows the comparative analysis of calculated and experimental qe values and R2 values of applied isotherm models with CR dye. ST/GT (2![[thin space (1/6-em)]](https://www.rsc.org/images/entities/char_2009.gif) :
:![[thin space (1/6-em)]](https://www.rsc.org/images/entities/char_2009.gif) 0) (Fig. 10e), obeyed the Freundlich isotherm model.
0) (Fig. 10e), obeyed the Freundlich isotherm model.
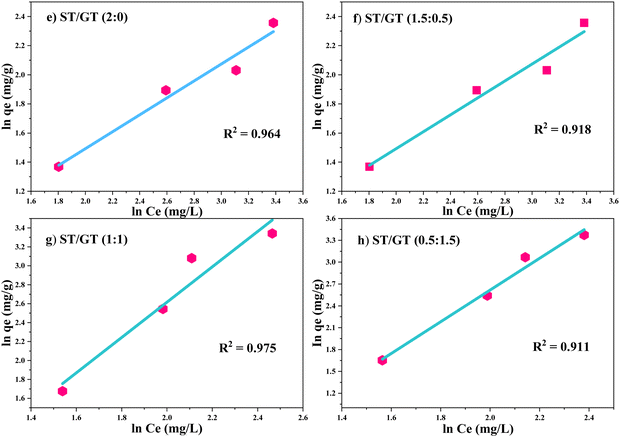 | ||
Fig. 10 Freundlich isotherm model fitting in adsorption of CR dye of (e) ST: GT (2![[thin space (1/6-em)]](https://www.rsc.org/images/entities/char_2009.gif) : :![[thin space (1/6-em)]](https://www.rsc.org/images/entities/char_2009.gif) 0) f) ST/GT (1.5 0) f) ST/GT (1.5![[thin space (1/6-em)]](https://www.rsc.org/images/entities/char_2009.gif) : :![[thin space (1/6-em)]](https://www.rsc.org/images/entities/char_2009.gif) 0.5) (g) ST/GT (1 0.5) (g) ST/GT (1![[thin space (1/6-em)]](https://www.rsc.org/images/entities/char_2009.gif) : :![[thin space (1/6-em)]](https://www.rsc.org/images/entities/char_2009.gif) 1) (h) ST/GT (0.5 1) (h) ST/GT (0.5![[thin space (1/6-em)]](https://www.rsc.org/images/entities/char_2009.gif) : :![[thin space (1/6-em)]](https://www.rsc.org/images/entities/char_2009.gif) 1.5). 1.5). | ||
The value of R2 was close to unity (R2 = 0.964). Value n was higher than 1 (n > 1.72 > 1) manifesting that the surface is favorable for adsorption. ST/GT (1.5![[thin space (1/6-em)]](https://www.rsc.org/images/entities/char_2009.gif) :
:![[thin space (1/6-em)]](https://www.rsc.org/images/entities/char_2009.gif) 0.5) (Fig. 10f) agreed well with the Freundlich isotherm model. R2 was close to unity (R2 = 0.918). n was higher than 1 (n > 1.713 > 1) which depicts favorable adsorption. The data for ST/GT (1
0.5) (Fig. 10f) agreed well with the Freundlich isotherm model. R2 was close to unity (R2 = 0.918). n was higher than 1 (n > 1.713 > 1) which depicts favorable adsorption. The data for ST/GT (1![[thin space (1/6-em)]](https://www.rsc.org/images/entities/char_2009.gif) :
:![[thin space (1/6-em)]](https://www.rsc.org/images/entities/char_2009.gif) 1) (Fig. 10g) went in agreement with the Freundlich model with R2 closer to 1 (R2 = 0.975). n was smaller than 1 (n < 0.459 < 1) that illustrated unfavorable for adsorption. ST/GT (0.5
1) (Fig. 10g) went in agreement with the Freundlich model with R2 closer to 1 (R2 = 0.975). n was smaller than 1 (n < 0.459 < 1) that illustrated unfavorable for adsorption. ST/GT (0.5![[thin space (1/6-em)]](https://www.rsc.org/images/entities/char_2009.gif) :
:![[thin space (1/6-em)]](https://www.rsc.org/images/entities/char_2009.gif) 1.5) (Fig. 10h) also followed Freundlich isotherm. The value of R2 was 0.911. A small value of n (n < 0.535 < 1) recommends that the surface of hydrogel was unfavorable for adsorption. The values of empirical constant Kf are mentioned in Table 2. From the results, it was clear that after the formation of the first layer of dye molecules on the hydrogel's surface, further adsorption occurred via indirect contact with the active site (secondary adsorption), thereby, forming a multilayer on it.
1.5) (Fig. 10h) also followed Freundlich isotherm. The value of R2 was 0.911. A small value of n (n < 0.535 < 1) recommends that the surface of hydrogel was unfavorable for adsorption. The values of empirical constant Kf are mentioned in Table 2. From the results, it was clear that after the formation of the first layer of dye molecules on the hydrogel's surface, further adsorption occurred via indirect contact with the active site (secondary adsorption), thereby, forming a multilayer on it.
The isotherm study of hydrogel blends depicted distinct adsorption patterns with MB and CR dye. This variation was caused by the surface charge of the dye molecules. Hydrogel being negatively charged surface resulted in faster and more efficient adsorption via monolayer formation with cationic dye molecules (in the case of MB). Whilst adsorption of CR was complicated by similar surface charges leading to multiple layers of adsorbed dye molecules and slower adsorption rates.
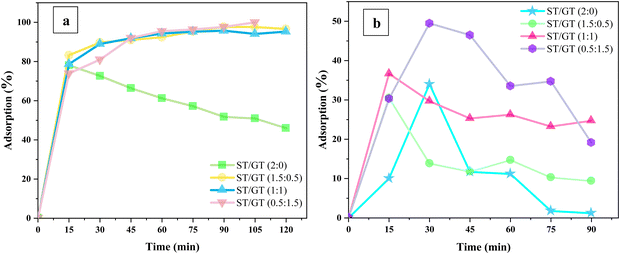 | ||
| Fig. 11 Effect of contact time of ST/GT hydrogels on the adsorption of (a) MB (b) CR dye for the adsorption of methylene blue dye. | ||
During the adsorption of MB dye, modified ST/GT hydrogels performed better than the unmodified ones; ST/GT (2![[thin space (1/6-em)]](https://www.rsc.org/images/entities/char_2009.gif) :
:![[thin space (1/6-em)]](https://www.rsc.org/images/entities/char_2009.gif) 0) showed elevated adsorption in the first 15 min only, due to free active sites. After that, adsorption values started decreasing due to the desorption of dye molecules from the surface. For a contact time of 120 minutes, the total adsorption recorded was 46.01%. On the contrary, the adsorption rates were higher for the hydrogels blended with GT. With the ST/GT (1.5
0) showed elevated adsorption in the first 15 min only, due to free active sites. After that, adsorption values started decreasing due to the desorption of dye molecules from the surface. For a contact time of 120 minutes, the total adsorption recorded was 46.01%. On the contrary, the adsorption rates were higher for the hydrogels blended with GT. With the ST/GT (1.5![[thin space (1/6-em)]](https://www.rsc.org/images/entities/char_2009.gif) :
:![[thin space (1/6-em)]](https://www.rsc.org/images/entities/char_2009.gif) 0.5) hydrogel, within 15 minutes, the adsorption percentage reached 83% and continued to rise to 96.63% in 90 minutes. After that, it gradually became constant. Within 120 minutes, the total adsorption recorded was 96.34%. GT introduced additional active sites in the form of –OH and –COOH groups that were responsible for the swelling and entrapment of MB dye molecules. Similarly, ST/GT (1
0.5) hydrogel, within 15 minutes, the adsorption percentage reached 83% and continued to rise to 96.63% in 90 minutes. After that, it gradually became constant. Within 120 minutes, the total adsorption recorded was 96.34%. GT introduced additional active sites in the form of –OH and –COOH groups that were responsible for the swelling and entrapment of MB dye molecules. Similarly, ST/GT (1![[thin space (1/6-em)]](https://www.rsc.org/images/entities/char_2009.gif) :
:![[thin space (1/6-em)]](https://www.rsc.org/images/entities/char_2009.gif) 1) also displayed a gradual increase in adsorption to 95% within 90 min and then became constant after all sites were occupied. In the case of ST/GT (0.5
1) also displayed a gradual increase in adsorption to 95% within 90 min and then became constant after all sites were occupied. In the case of ST/GT (0.5![[thin space (1/6-em)]](https://www.rsc.org/images/entities/char_2009.gif) :
:![[thin space (1/6-em)]](https://www.rsc.org/images/entities/char_2009.gif) 1.5), 97.66% adsorption was achieved and it continued to escalate after 90 min. Within 120 minutes, 100% of adsorption was achieved successfully. The continual rise suggests that the adsorbent still had free binding sites, and the equilibrium stage was not reached yet. This is dedicated to the increased number of –OH and –COOH groups that enhanced the extent of adsorption.
1.5), 97.66% adsorption was achieved and it continued to escalate after 90 min. Within 120 minutes, 100% of adsorption was achieved successfully. The continual rise suggests that the adsorbent still had free binding sites, and the equilibrium stage was not reached yet. This is dedicated to the increased number of –OH and –COOH groups that enhanced the extent of adsorption.
As for the adsorption of CR dye, the efficiency of ST/GT hydrogels was not very promising. In the case of ST/GT (2![[thin space (1/6-em)]](https://www.rsc.org/images/entities/char_2009.gif) :
:![[thin space (1/6-em)]](https://www.rsc.org/images/entities/char_2009.gif) 0), owing to the availability of binding sites, adsorption increased linearly until 30 min. After saturation, the rate of adsorption and desorption became equivalent and adsorption reached the equilibrium stage. Within a contact time of 90 minutes, the maximum adsorption recorded was 34%. However, for ST/GT (1.5
0), owing to the availability of binding sites, adsorption increased linearly until 30 min. After saturation, the rate of adsorption and desorption became equivalent and adsorption reached the equilibrium stage. Within a contact time of 90 minutes, the maximum adsorption recorded was 34%. However, for ST/GT (1.5![[thin space (1/6-em)]](https://www.rsc.org/images/entities/char_2009.gif) :
:![[thin space (1/6-em)]](https://www.rsc.org/images/entities/char_2009.gif) 0.5), a linear rise was observed during 15 minutes of contact time. Then a gradual decrease was followed by equilibrium. Removal efficiency was 30%. A similar trend was shown by ST/GT (1
0.5), a linear rise was observed during 15 minutes of contact time. Then a gradual decrease was followed by equilibrium. Removal efficiency was 30%. A similar trend was shown by ST/GT (1![[thin space (1/6-em)]](https://www.rsc.org/images/entities/char_2009.gif) :
:![[thin space (1/6-em)]](https://www.rsc.org/images/entities/char_2009.gif) 1) with 36.37% of adsorption efficiency. ST/GT (0.5
1) with 36.37% of adsorption efficiency. ST/GT (0.5![[thin space (1/6-em)]](https://www.rsc.org/images/entities/char_2009.gif) :
:![[thin space (1/6-em)]](https://www.rsc.org/images/entities/char_2009.gif) 1.5) showed relatively higher removal efficiency i.e. 49% attributed to the high concentration of gum that led to an increase in the total number of free binding sites. To conclude, no significant enhancement in the removal efficiency of CR dye was recorded.
1.5) showed relatively higher removal efficiency i.e. 49% attributed to the high concentration of gum that led to an increase in the total number of free binding sites. To conclude, no significant enhancement in the removal efficiency of CR dye was recorded.
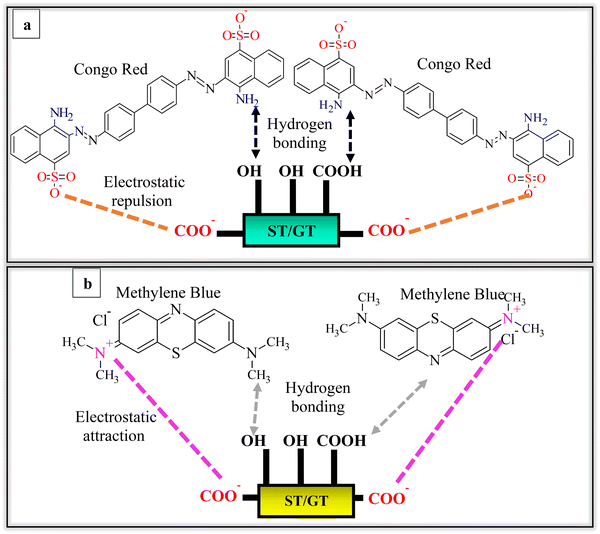
The apparent discrepancy in the removal efficiencies of hydrogels against MB and CR dye was eminent. This was due to the anionic character of hydrogel inherited from GT. In the case of MB, interaction took place among cationic nitrogen atoms in the amine (of MB) and anionic binding sites of the hydrogel (Fig. 12b). Thus, electrostatic attraction also assisted in adsorption besides hydrogen bonding. However, CR has active sulphonate groups that provide anionic charge to them. Due to similar surface charges, there existed electrostatic repulsion between binding sites and dye molecules (Fig. 12a). As a result, the probability of further adsorption was reduced. The repulsive force also hindered the mobility of upcoming molecules by allowing external mass transfer resistances. Subsequently, after initial 15–20 min, contact time became insignificant and did not effect the adsorption anymore. Thus, the adsorption efficiency of hydrogel with CR dye was poor relative to MB dye.
To evaluate the kinetic parameters, pseudo 1st order and 2nd order models were applied to data of time effect (Fig. 13). The fitting results of both models are mentioned in the table. The experimental data obtained good fitting for the pseudo 2nd order model for the adsorption of MB and CR dye. In the adsorption of MB, the value of the linear regression coefficient (R2) was close to unity (R2 > 0.99) for all hydrogel blends, which was quite high relative to the pseudo first-order model (R2 < 0.88). Similarly, the data for the adsorption of CR agreed well with pseudo 2nd order with R2 close to 1 ((R2 > 0.94) than pseudo 1st order (R2 < 0.88). A rational agreement existed between experimental and calculated adsorption capacities (qe). The constants obtained from the intercepts and slopes of both models are summarized in Table 3. The table also shows the comparative analysis of calculated and experimental qe and R2 values of applied kinetic models.
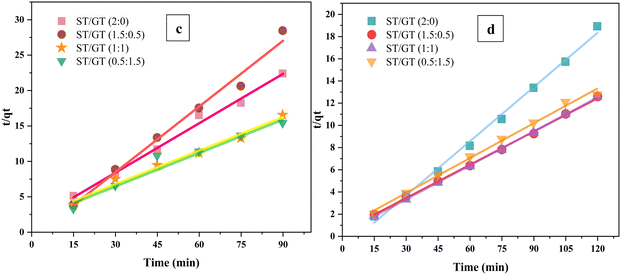 | ||
| Fig. 13 Pseudo 2nd order kinetic plots of ST/GT hydrogels on the adsorption of (c) MB dye (d) CR dye for the adsorption of methylene blue dye. | ||
| Methylene blue | |||||
|---|---|---|---|---|---|
| Order of reaction | Parameters | ST/GT (2![[thin space (1/6-em)]](https://www.rsc.org/images/entities/char_2009.gif) : :![[thin space (1/6-em)]](https://www.rsc.org/images/entities/char_2009.gif) 0) 0) |
ST/GT (1.5![[thin space (1/6-em)]](https://www.rsc.org/images/entities/char_2009.gif) : :![[thin space (1/6-em)]](https://www.rsc.org/images/entities/char_2009.gif) 0.5) 0.5) |
ST/GT (1![[thin space (1/6-em)]](https://www.rsc.org/images/entities/char_2009.gif) : :![[thin space (1/6-em)]](https://www.rsc.org/images/entities/char_2009.gif) 1) 1) |
ST/GT (0.5![[thin space (1/6-em)]](https://www.rsc.org/images/entities/char_2009.gif) : :![[thin space (1/6-em)]](https://www.rsc.org/images/entities/char_2009.gif) 1.5) 1.5) |
| Pseudo-first order | q e (mg g−1) | 5.11 × 10⁻¹ | 8.687 × 10⁻¹ | 0.7406 | 1.1787 |
| K 1 | 1.29 × 10⁻⁴ | 9.6 × 10⁻⁵ | −7 × 10⁻⁵ | −7.25 × 10⁻⁵ | |
| R 2 | 0.8569 | 0.8992 | 0.1800 | 0.1291 | |
| Pseudo-second order | q ecal (mg g−1) | 6.138 | 10.003 | 9.773 | 9.544 |
| q eexp (mg g−1) | 6.343 | 9.751 | 9.523 | 9.931 | |
| K 2 | 2.1 × 10⁻² | 2.23 × 10⁻² | 0.0506 | 1.52 × 10⁻² | |
| R 2 | 0.9956 | 0.9999 | 0.9989 | 0.993 | |
| Congo red | |||||
| Pseudo-first order | q e (mg g−1) | 0.5279 | 1.0331 | 0.3858 | 0.1222 |
| K 1 | 2 × 10⁻⁴ | 3 × 10⁻⁴ | 7 × 10⁻⁵ | 0.0003 | |
| R 2 | 0.1533 | 0.3135 | 0.0595 | 0.8106 | |
| Pseudo-second order | q ecal (mg g−1) | 4.29 | 3.23 | 6.331 | 6.361 |
| q eexp (mg g−1) | 4.019 | 3.164 | 5.443 | 5.846 | |
| K 2 | 0.0378 | 0.1177 | 0.0126 | 0.013 | |
| R 2 | 0.9890 | 0.9823 | 0.9810 | 0.9436 | |
The deeper insight of adsorption kinetics and time effect showed that initially, the interaction among binding sites of hydrogel and free dye molecules was very abrupt, but after saturation point, the reaction slowed down due to limited available active sites of hydrogel and free dye molecules. Consequently, the concentration of both, hydrogel and dye played a significant role in the rate-determining step. Both species interacted with each other through chemisorption in rate rate-limiting step. Eventually, forming a monolayer of dye molecules on the surface of the hydrogel. The enthalpy of chemisorption is high and occurs at all temperatures.
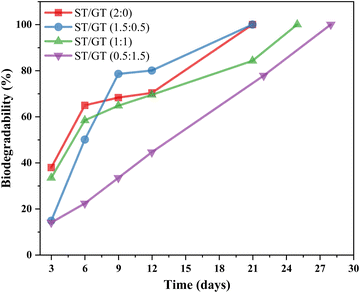 | ||
| Fig. 14 Comparative analysis of percentage biodegradability of ST/GT hydrogels at different time intervals. | ||
In the case of ST/GT (2![[thin space (1/6-em)]](https://www.rsc.org/images/entities/char_2009.gif) :
:![[thin space (1/6-em)]](https://www.rsc.org/images/entities/char_2009.gif) 0), the weight loss was quite rapid. Within 3 days, about 38% of the hydrogel had been degraded. Degradation reached 70% after 12 days. Complete degradation occurred in nearly 21 days. ST/GT (1.5
0), the weight loss was quite rapid. Within 3 days, about 38% of the hydrogel had been degraded. Degradation reached 70% after 12 days. Complete degradation occurred in nearly 21 days. ST/GT (1.5![[thin space (1/6-em)]](https://www.rsc.org/images/entities/char_2009.gif) :
:![[thin space (1/6-em)]](https://www.rsc.org/images/entities/char_2009.gif) 0.5), the initial degradation began slowly and after 3 days, about 15% of the degradation was observed. The rate of weight loss increased later on and in nearly 12 days, 80% of hydrogel had been degraded by the microbial species present in soil. Complete degradation occurred in nearly 21 days. ST/GT (1
0.5), the initial degradation began slowly and after 3 days, about 15% of the degradation was observed. The rate of weight loss increased later on and in nearly 12 days, 80% of hydrogel had been degraded by the microbial species present in soil. Complete degradation occurred in nearly 21 days. ST/GT (1![[thin space (1/6-em)]](https://www.rsc.org/images/entities/char_2009.gif) :
:![[thin space (1/6-em)]](https://www.rsc.org/images/entities/char_2009.gif) 1) showed much delayed degradation and complete weight loss was attained after 25 days. In the case of ST/GT (0.5
1) showed much delayed degradation and complete weight loss was attained after 25 days. In the case of ST/GT (0.5![[thin space (1/6-em)]](https://www.rsc.org/images/entities/char_2009.gif) :
:![[thin space (1/6-em)]](https://www.rsc.org/images/entities/char_2009.gif) 1.5), degradation was the slowest. The first 3 days proceeded with only 14% weight loss and after 12 days the weight loss % reached 44%. Complete degradation was accomplished within 28 days.
1.5), degradation was the slowest. The first 3 days proceeded with only 14% weight loss and after 12 days the weight loss % reached 44%. Complete degradation was accomplished within 28 days.
Results are suggestive of the slow degradation of gum-modified hydrogel relative to the unmodified one revealing the fact that GT did influence the degradation behavior. All the prepared hydrogels were biodegradable and complete weight loss was achieved within 21–28 days. Hydrolyzation and depolymerization broke down the hydrogel into its counterparts. The moisture content absorbed by hydrogels from soil allowed faster degradation by enzymatic actions. These results were found to be better than reported data in the literature.13
4 Conclusion
In this research, superabsorbent ST/GT hydrogels were successfully synthesized using the solution casting method. The morphology and chemical composition analysis revealed a porous hydrogel structure with polymeric chains interconnected via hydrogen bonds. TGA-DSC analysis indicated that the incorporation of GT reduced the thermal stability of the blended hydrogels. The high swelling capacity suggested enhanced retention of pollutants and prevention of leaching back into the water. Adsorption studies demonstrated that the removal efficiency of ST/GT hydrogels was significantly higher than that of ST-based hydrogels, with a maximum removal efficiency of 97% for MB compared to 46% for CR at neutral pH, indicating a selectivity towards cationic dyes. Kinetic studies revealed that both hydrogel and dye concentrations were crucial in the rate-determining step, with the adsorption process following a pseudo-second order model, indicating chemisorption. Isotherm studies showed monolayer adsorption for MB and multilayer adsorption for CR. Biodegradability tests confirmed that the hydrogels could completely decompose within 28 days, preventing environmental accumulation and eliminating disposal costs, making this approach economical. This research highlights the novel use of GT in water treatment, demonstrating its potential for targeted pollutant removal and broad-scale water quality improvement.Author contributions
Dr Sana Ahmad: conceptualization, supervision, preparation of final draft. Saleha Imran: methodology, investigation, write – up of first draft.Data availability
The raw data can be provided by the corresponding author on demand.Conflicts of interest
The authors declare no conflict of interest.Acknowledgements
The authors thank Lahore College for Women University for providing the infrastructure and basic chemicals/instruments to carry out this project.References
- S. Thakur, B. Sharma, A. Verma, J. Chaudhary, S. Tamulevicius and V. K. Thakur, Int. J. Polym. Anal. Charact., 2018, 23, 621 CrossRef CAS
.
- M. T. Yagub, T. K. Sen, S. Afroze and H. M. Ang, Adv. Colloid Interface Sci., 2014, 209, 172 CrossRef CAS PubMed
.
- A. Ali and S. Ahmed, J. Agric. Food Chem., 2018, 66, 6940 CrossRef CAS PubMed
.
- M. R. Guilherme, F. A. Aouada, A. R. Fajardo, A. F. Martins, A. T. Paulino, M. F. Davi and E. C. Muniz, Eur. Polym. J., 2015, 72, 365 CrossRef CAS
.
- V. Van Tran, D. Park and Y. C. Lee, Environ. Sci. Pollut. Res., 2018, 25, 24569 CrossRef CAS PubMed
.
- M. F. Akhtar, M. Hanif and N. M. Ranjha, Saudi Pharm. J., 2016, 24, 554 CrossRef PubMed
.
- I. Alemzadeh and M. Vossoughi, Chem. Eng. Process., 2002, 41, 707 CrossRef CAS
.
- Y. Fan and F. Picchioni, Carbohydr. Polym., 2020, 241, 116350 CrossRef CAS PubMed
.
- P. M. Visakh, A. P. Mathew, K. Oksman and S. Thomas, Polysaccharide Build. Blocks, 2012, 287 CAS
.
- H. Ismail, M. Irani and Z. Ahmad, Int. J. Polym. Mater. Polym. Biomater., 2013, 62, 411 CrossRef CAS
.
- M. Singh, C. J. Raorane, D. Shastri, V. Raj, S. C. Kim and M. Tuteja, Polym. J., 2022, 14, 3648 CAS
.
- M. George and T. E. Abraham, Int. J. Pharm., 2007, 335, 123 CrossRef CAS PubMed
.
- B. S. Kaith, R. Jindal and V. Kumar, Polym. Degrad. Stab., 2015, 115, 24 CrossRef
.
- S. Sethi, B. S. Kaith, M. Kaur, N. Sharma and V. Kumar, Cellulose, 2020, 27, 4565 CrossRef CAS
.
- N. A. Maziad, S. El-Hamouly, S. A. Rizk and N. R. Nasef, J. Biosci. Med., 2018, 6, 33 CAS
.
- A. Graca, I. Rufino, A. M. Martins, S. Raposo, H. M. Ribeiro and J. Marto, Int. J. Pharm., 2023, 638, 122941 CrossRef CAS PubMed
.
- S. Y. Yang and C. Y. Huang, J. App. Polym. Sci., 2008, 109, 2452 CrossRef CAS
.
- D. Yun, H. Cai, Y. Liu, L. Xiao, J. Song and J. Liu, RSC Adv., 2019, 9, 30905 RSC
.
- J. E. Martin-Alfonso, E. Cikova and M. J. Omastova, Composites, Part B, 2019, 169, 79 CrossRef CAS
.
- H. A. Heydary, E. Karamian, E. Poorazizi, A. Khandan and J. Heydaripour, Procedia Manuf., 2015, 11, 176 CAS
.
- S. Naderizadeh, A. Shakeri, H. Mahdavi, N. Nikfarjam and N. Taheri Qazvini, Starke, 2019, 71, 1800027 CrossRef
.
- B. Singh and V. Sharma, Carbohydr. Polym., 2014, 101, 928 CrossRef CAS PubMed
.
- V. Kumar, H. Mittal and S. M. Alhassan, Int. J. Biol. Macromol., 2019, 132, 1252 CrossRef PubMed
.
- W. C. Wanyonyi, J. M. Onyari and P. M. Shiundu, Energy Procedia, 2014, 50, 862 CrossRef CAS
.
-
M. Pauline, Doran. Bioprocess Engineering Principles, Academic Press, 2nd edn, 2013, pp. 445 Search PubMed
.
| This journal is © The Royal Society of Chemistry 2024 |

