 Open Access Article
Surface engineering: binary Mg,Fe-LDH·xFe3O4 nanocomposites for improved magnetic solid-phase extraction of pharmaceuticals from aqueous solution†
Tetiana
Hubetska
ab,
Victor
Demchenko
a and
Natalia
Kobylinska
 *a
*a
aA.V. Dumansky Institute of Colloid and Water Chemistry, National Academy of Sciences of Ukraine, 42 Acad. Vernadskoho Blvd, Kyiv, 03142, Ukraine. E-mail: kobilinskaya@univ.kiev.ua
bNanomaterials and Nanotechnology Research Center (CINN-CSIC), Avda. de la Vega 4-6, El Entrego, 33940, Spain
First published on 12th September 2024
Abstract
In this work, binary Mg,Fe-LDH·xFe3O4 (x = 0 to 2.0) nanocomposites were prepared via the in situ growth of Mg,Fe-layered double hydroxides (LDHs) onto magnetite nanoparticles and applied for the removal of diclofenac motives. These materials were prepared by a simple prolonged sonication method and systematically characterized by several techniques (e.g. XRD, VRM, SEM, FTIR, TEM, etc.). The XRD patterns of the magnetic nanocomposites confirm the formation of both LDHs and magnetic phases. The intricate surface functional groups of the starting components played pivotal roles in the formation of magnetic composites, according to FTIR spectra. The hexagonal plate-like morphology of the Mg,Fe-LDHs and Mg,Fe-LDH·xFe3O4 samples is evident from TEM data. The Mg,Fe-LDH·1.0Fe3O4 nanocomposite exhibited high agglomeration of the magnetite nanoparticles, which broke their layered structure. Various influencing factors (e.g., concentration, pH medium, and contact time) that are known to influence the adsorption properties of materials were systematically studied to clarify the mechanism of the adsorption process. To assess the safety of the adsorbents, the effect of the adsorbed DCF on the release of metal ions from the LDHs structure was also monitored. Moreover, the Mg,Fe-LDH·xFe3O4 (x = 0.1 to 1.0) nanocomposites can be quickly separated from the 400 mL solution by an external NdFeB magnet before and after the magnetic solid-phase extraction process. The capacity of the magnetic nanocomposites to adsorb diclofenac increased with increasing solution pH. At 25 °C and pH = 7.5, the maximum adsorption capacities for Mg,Fe-LDH·0.1Fe3O4 and Mg,Fe-LDH·0.3Fe3O4 were 153.2 mg g−1 (0.48 mmol g−1) and 143.2 mg g−1 (0.45 mmol g−1), respectively, which do not exceed the capacities for the starting Mg,Fe-LDHs (158.1 mg g−1). Further results indicated that the adsorption isotherm for diclofenac anion retention could be fitted to the Langmuir equation. The FTIR and XRD data indicate that organic molecules are adsorbed on the obtained materials by electrostatic and complex-forming processes without significant anion-exchange reactions. Moreover, after 3 regeneration cycles, the magnetic nanocomposites still retained a highly ordered structure and morphology with a magnetic response.
1. Introduction
Diclofenac (2-[2-(2,6-dichloroanilino) phenyl] acetic acid, DCF)1 and its metabolites (e.g., 4′-hydroxydiclofenac (4′-OH-DCF) or 5-hydroxylated DCF (5-OH-DCF)2) have been frequently detected in various water sources, usually as emerging compounds,3 because of their widespread human and veterinary use since the 1970s.4 Most of the diclofenac-containing drugs (up to 75%) enter the surface water, groundwater and soil samples.2 Long-term exposure to these contaminants has been shown to have a negative impact on ecosystem health and sustainability.1 It has also been proved that DCF is not readily biodegradable.5 Several years ago, DCF (among 17 organic compounds) was included in the watch list for European Union monitoring in different aquatic compartments (namely, effluents of wastewater, surface water, and groundwater), defined in Decision 2015/495/EU.4Currently, chemists and technologists are actively investigating the determination and removal of DCF from water sources.6 So far, many methods have been widely reported to remove emerging pollutants from aqueous solutions, such as nanofiltration,7 photocatalysis,8,9 and adsorption10 as a low-cost and feasible option in large-scale approach. However, each method has its advantages and disadvantages. For example, photooxidation processes have been extensively used for the water treatment of organic compounds including pharmaceuticals, but these techniques are associated with problems such as excessive time requirements with noneffective energy consumption.
To date, many adsorptive materials (e.g., clay minerals, carbon-based materials, magnetic materials, etc.) have been reported in the literature for pharmaceuticals removal.10–12 Compared to other reported conventional sorbents, synthetic clays (currently known as layered double hydroxides (LDHs)) have aroused increasing attention in environmental conservation because of their low-cost and simple synthesis of layered structures.13 Furthermore, LDHs have a greater hydrophilic character and resistance to high pH solution.14 The sorption purification process is affected by the composition of the hydrotalcite, which determines the layer charge, the nature of the anion present in the interlayer, and the amount of water molecules in the interlayer.13 These characteristics determine the accessibility of the anionic interlayer species. Hence, they should influence the adsorption of the anionic pollutants when using these materials as sorbents.15 The most common types of LDHs as sorbents are Mg,Al-, Mg,Fe-LDHs.16 These two materials stand out in water treatment processes due to their high crystallinity and the simplicity of the preparation methods.15 Many studies have shown that under the same conditions, the crystallinity of Mg,Fe-LDHs is slightly poorer than that of the Mg,Al-LDHs. However, from a safety perspective, (Ksp(Al(OH)3) = 1.3 × 10⁻³³) and (Ksp(Fe(OH)3) = 4.0 × 10−38) differ by almost five orders of magnitude.17 Nevertheless, to some extent, unmodified LDHs exhibited low removal efficiency for contaminants owing to their limited functional groups. For example, the equilibrium adsorption capacity of Zn,Fe-LDHs, Mg,Al-LDHs (or calcined at 500 °C) and Zn,Al-LDHs to diclofenac was reported to be only 74.50 mg g−1,18 123 mg g−1 (or 1494 mg g−1),19 and 500 mg g−1,20 respectively. At the same time, the hybrid LDHs-based materials for the carbons,21 polymers,22,23 clays,24 metal oxides20,25 and industrial wastes26 are found to be effective in the removal of DCF from aqueous solutions.
Furthermore, the LDHs used for water treatment as sorbents are usually powders. Thus, it is difficult to separate the sorbent from a suspension without a centrifugation process.23 This disadvantage limits the applicability of LDHs when a large number of samples are considered. In such a process, automation would be desirable. Magnetic solid phase extraction (MSPE) technology (i.e., applying an external magnetic field to perform the removal and preconcentration of emerging pollutants) has attracted much attention for improving the manufacturability of the sorption process.27 Thus, an area of increased research interest is the impartion of magnetic properties to materials to enhance the purification and preconcentration process by sorbents from aqueous solution or other liquid.14 Introducing magnetic properties to 2D-layered materials enables effective manipulation of the powders in the aqueous solution for dispersion or separation processes.
Various types of LDHs containing magnetic nanoparticles (Fe3O4(mainly), γ-Fe3O4, MFe2O4 (M = Co, Mg, Mn, etc.)), such as Mg,Al-,28–31 Mg,Fe-,32 CuFeNi-,33 Zn,Cr-,34 and Ca,Al-LDHs,35 have been prepared by several scientific groups. The resulting magnetic composites have been typically used for controlled drug and gene delivery,16,31 and as heterogeneous catalysts.29,34 At present, these composites have been explored for their applications in environmental remediation30,32,33 and photocatalysis.34 Currently, the study of magnetic LDHs-based materials for the removal of pharmaceuticals is still in the early stage.35 The design of a cost-effective and eco-friendly approach for the synthesis of nanocomposites for MSPE based on LDH materials remains a challenge. Thus, understanding the removal mechanisms of organic anions on the surfaces of LDHs is important for remediating many of these pollutants in water and wastewater treatments.
In this work, a MSPE procedure based on the Mg,Fe-layered double hydroxides (Mg,Fe-LDHs) decorated with magnetite nanospheres was established and applied to the removal of pharmaceutical pollutants. The main objectives were as follows: (1) to fabricate Mg,Fe-LDH·xFe3O4 nanocomposites with a molar ratio (x) from 0 to 2.0; (2) to find the suitable molar ratio of Mg,Fe-LDHs to Fe3O4 for effective MSPE of DCF molecules; (3) to determine the influencing factors in the MSPE experiments using the feasibilities of the magnetic nanocomposites; and (4) to evaluate the potential for sustainable application of the nanocomposites in regeneration studies. The predominant factors affecting the MSPE efficiency were taken into account, and the developed procedure was successfully applied to the preconcentration and uptake of DCF from aqueous solution.
2. Experimental part
2.1. Materials
All of the chemicals used were of analytical grade, and used without further purification. The following materials were used in this study: magnesium nitrate hexahydrate (Mg(NO3)2·6H2O, 98.0%), iron(II) chloride tetrahydrate (99%) (Merck), iron(III) chloride anhydrous (99%), ammonium hydroxide (NH3·H2O, 25%) (Merck), ethanol (96.0%), and urea (CH4N2O, 96.0%) were purchased from Sigma-Aldrich. Diclofenac sodium standard was obtained from the Center of Quality Control of Drugs, Ukraine. A stock standard solution of the drug (20 μg mL−1) was prepared by dissolving appropriate amounts of diclofenac sodium in deionized water. Purified water was obtained with a Milli-Q apparatus.111355.0100 ICP multi-element standard solution IV (Certipur® Certified Reference Material, HC73962555) 23 elements (Ag, Al, B, Ba, Bi, Ca, Cd, Co, Cr, Cu, Fe, Ga, In, K, Li, Mg, Mn, Na, Ni, Pb, Sr, Tl, Zn) in diluted HNO3 (Suprapur® 6.5%) 1000 mg L−1 were obtained from Merck KGaA (Darmstadt, Germany).
Stock solutions of NO3−, SO42−, and PO43− ions were prepared using NaNO3, Na2SO4, and Na2HPO4 salts (Sigma-Aldrich, 99.99%) dried at 150 °C for 3 hours and double distilled water by weight (AB-204S, Mettler Toledo). Humic acid sodium salt (C9H8Na2O4, tech. 50–60%, 226.139 g mol−1, Thermo Scientific Chemicals) was used as humic acid (HA).
A NdFeB magnet (1.0 cm × 1.5 cm × 1.5 cm) was used for the magnetic solid phase extraction procedure.
2.2. Synthesis of the samples
![[thin space (1/6-em)]](https://www.rsc.org/images/entities/char_2009.gif) :
:![[thin space (1/6-em)]](https://www.rsc.org/images/entities/char_2009.gif) 1 was prepared via hydrothermal method. Initially, urea (0.4000 g), Mg(NO3)2·6H2O (2.2312 g) and Fe(NO3)3·9H2O (1.1718 g) were dissolved in 50 mL of a water mixture. The resulting mixture was sonicated for 15 min, and transferred to a 100 mL Teflon-lined autoclave that is heated at 180 °C for 12 h. The product obtained upon cooling to room temperature was transferred into a glass. One half of the resulting product was washed into a glass up to a near-neutral pH value and dried at 50 °C for further characterization. The other half was dispersed in 25 mL of deionized water to form a stable aqueous dispersion with a required concentration of brown product for further use.
1 was prepared via hydrothermal method. Initially, urea (0.4000 g), Mg(NO3)2·6H2O (2.2312 g) and Fe(NO3)3·9H2O (1.1718 g) were dissolved in 50 mL of a water mixture. The resulting mixture was sonicated for 15 min, and transferred to a 100 mL Teflon-lined autoclave that is heated at 180 °C for 12 h. The product obtained upon cooling to room temperature was transferred into a glass. One half of the resulting product was washed into a glass up to a near-neutral pH value and dried at 50 °C for further characterization. The other half was dispersed in 25 mL of deionized water to form a stable aqueous dispersion with a required concentration of brown product for further use.
Similarly, other magnetic nanocomposites (Mg,Fe-LDH·0.1Fe3O4, Mg,Fe-LDH·0.5Fe3O4, Mg,Fe-LDH·1.0Fe3O4 and Mg,Fe-LDH·2.0Fe3O4) were prepared by varying the amount of Fe3O4 in the reaction mixture.
2.3. Methods of samples characterization
The ratio of crystalline phases in the magnetic nanocomposites was evaluated by XRD data using the general structure analysis system (GSAS-II software package).39
2.4. Analytical techniques
For all of the tests, the concentrations of metal ions in the solutions were analyzed using a flame atomic absorption spectrometer (C-115M) with an air–acetylene burner.The UV-visible spectroscopic measurements in the present work were performed on a SPECORD® 250 Plus (Analytik Jena GmbH + Co. KG) spectrophotometer operated at a resolution of 1 nm. The measurements were carried out in a quartz cell of 10 mm path length (volume 3.0 mL). Spectral recording was carried out in absorbance units at the UV wavelength range of 190–320 nm (Fig. S1, ESI†). Absorbance peaks of the DCF solution appeared at 199 nm and 276 nm. Standard diclofenac solutions in the concentration range of 0.5–40 mg L−1 were employed to determine the intensity of the absorbance peak at 276 nm.18 The calibration curve of the DCF solutions was obtained through linear fitting of the absorbance peak intensity (Fig. S2, ESI†). The all-test solutions were filtered with a 0.22 μm membrane (nylon) prior to the determination of the DCF concentration.
The pH measurements were performed using an Inolab Level 2 pH/ionomer (WTW).
2.5. Adsorption experiments
The pH of the solution was controlled from 5.0 to 11.0 via 0.1 M HCl and 0.1 M NaOH. Additionally, the solution pH was periodically evaluated utilizing a pH meter, and kept constant by adding drops of 0.1, 0.05 or 0.01 M HCl or NaOH solutions, as needed.
| qt (mmol g−1) = (C0 − Ct)·V/m |
The DCF removal efficiency (R, %) and adsorption capacity (qe, mmol g−1) were calculated according to the following formula:
| R (%) = (C0 − Ce)/C0 |
| qe (mmol g−1) = (C0 − Ce)·V/m |
2.6. Desorption (regeneration) experiments
To check the reusability of the adsorption process, the DCF-loaded adsorbents were first stirred overnight with 100 mL NaNO3 (or Na2CO3) solution (100 mg L−1). Then, the absorbance of the solution was measured to determine the concentration of released DCF. The effect of DCF release was controlled by spectrophotometry and TGA analysis. After thorough and repeated washing steps with distilled water until neutral pH, the adsorbent was magnetically separated and dried at 50 °C for the next experiments.2.7. Release of metal ions and effect of co-existing ions
The effect of adsorbed DCF on the release of metal ions from the starting Mg,Fe-LDHs matrix was controlled using the AAS method. The release of Mg(II) and Fe(III) ions into solution from Mg,Fe-LDH·xFe3O4 nanocomposites and different interferent ions was also studied.The release of metal ions was monitored in 50-mL centrifuge tubes consisting of magnetic solids, oxygen-free double-distilled water, 100 mg L−1 ICP multi-element standard solution IV and a pre-determined concentration of DCF. Simultaneously, the influence of inorganic anions and humic acids (0.1 mg mL−1) were also investigated under the same conditions.
2.8. Sample preparation of environmental water samples
The environmental samples (artesian, urban river and lake waters) were collected from 28 June to 05 August 2024 in Kyiv (Ukraine), from an artesian well (20 meters deep) in the city district area, Dnipro River (near the center of Kyiv), and Vira Lake (near a pharmaceutical plant). A 1-mL volume of 65% nitric acid per 1 L of the water samples was added for stabilization. The stabilized water samples were refrigerated in glass bottles at 4 °C.Subsequently, 50 mg of magnetic adsorbent was added to 250 mL of each water sample with spiked amounts of target analyte; the pH of the suspensions was adjusted to 7.2–7.8, and it was stirred for 5 hours at room temperature. The solid phase was isolated from the suspension with the NdFeB magnet, and the target analyte and metal contents were determined in the supernatant solution by spectrophotometry and AAS methods. The water samples were filtered with a 0.45 μm membrane prior to the determination of DCF and metal ions.
3. Results and discussion
3.1. Synthesis and characterization of materials
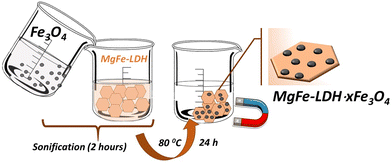
The Mg,Fe-LDH·xFe3O4 (x = 0.1, 0.3, 0.5 and 1.0) nanocomposites were synthesized using a multi-step method. The illustration of the formation of the Mg,Fe-LDH·xFe3O4 nanocomposites is shown in Scheme 1.In the first stage, Mg,Fe-LDHs nanoplates grew directly by hydrothermal method. Then, magnetite nanoparticles were prepared through an easy in situ coprecipitation approach, and used as the new nano-supports. In the second stage, Fe3O4 was dispersed in the Mg,Fe-LDHs suspension via ultrasonic agitation to obtain a uniform material. The electrostatic attraction between Fe3O4 and Mg,Fe-LDHs combined with ultrasonic treatment provided a strong driving force for the effective assembly of Fe3O4 nanoparticles on Mg,Fe-LDHs nanoplates (Scheme 1). The step-by-step reaction procedures to synthesize the magnetic nanocomposites were controlled by various instrumental methods.
The SEM images indicated that the as-synthesized material was composed of bulk-like aggregated structures after drying (Fig. S3, ESI†). These data also reveal that the starting Mg,Fe-LDHs material and most of the nanocomposites have a classical layered structure.19 SEM images of the magnetic nanocomposites revealed that the solid surface was also rough, and the particles agglomerated to varying extents. This might be due to the magnetic dipole moment interaction between the magnetite cores. Furthermore, TEM images were recorded to observe the morphology of all materials to be prepared, and to confirm the combination of Mg,Fe-LDHs with the Fe3O4 cores (Fig. 1). Mg,Fe-LDHs consist of well-dispersed plates with hexagonal morphology and sizes in a range of ca. 80–105 nm (Fig. 1a). The electron micrograph of the Mg,Fe-LDH·xFe3O4 nanocomposites shows the Mg,Fe-LDHs maintaining the external shape. However, a noticeable network of black points appears in the plate surfaces, which can be ascribed to the Fe3O4 nanoparticles. The average size of the Fe3O4 nanoparticles was ca. 20–25 nm. This is higher than the average diameter (10 nm) of bare Fe3O4 (Fig. 1b) because there was a small amount of agglomeration in several magnetic nanoparticles. It is also noteworthy that the plate morphology of the Mg,Fe-LDHs sample was found to be stable when subjected to stirring or ultrasound treatment during the preparation of the magnetic nanocomposites (Fig. 1c–e). The TEM images of the Mg,Fe-LDH·2.0Fe3O4 sample exhibited formed particles with irregularly shaped sheets and conglomerates of Fe3O4 nanoparticles on the surface of the sheets (Fig. 1f).
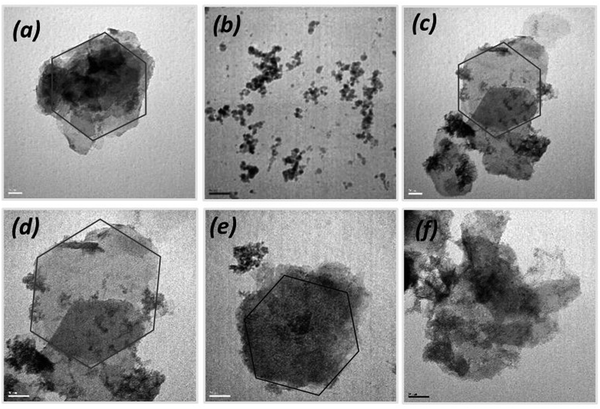 | ||
| Fig. 1 TEM images of Mg,Fe-LDHs (a), Fe3O4 (b), Mg,Fe-LDH·0.1Fe3O4 (c), Mg,Fe-LDH·0.3Fe3O4 (d), Mg,Fe-LDH·0.5Fe3O4 (e), and Mg,Fe-LDH·2.0Fe3O4 (f) samples. | ||
XRD analysis was used to determine the crystalline phase structure and purity of the prepared magnetic nanocomposites and corresponding homophases (Fig. 2). The XRD pattern of the starting Mg,Fe-LDHs exhibits a typical two-dimensional lamellar structure with rhombohedral symmetry (3R-polytype) and major diffraction peaks consistent with the (003), (006), (012) and (110) lattice planes, demonstrating the successful synthesis of crystalline hydrotalcite-like materials with the general formula [Mg6Fe2(CO3)(OH)16]·4H2O according to JCPDS: 38-0486. This effect indicated that the interlayer anion of the obtained Mg,Fe-LDHs was carbonate because most LDHs containing CO32− ions had this symmetry. The diffraction pattern of the Fe3O4 sample matches perfectly with the spinel type phase (250540-ICSD), with the main diffraction peaks consistent with the (220), (311), (222), (400), (422), (511), (440) and (533) lattice planes. Crystalline phases of impurities were not observed. All diffraction peaks of Mg,Fe-LDHs and Fe3O4 nanoparticles can be observed in the Mg,Fe-LDH·0.3Fe3O4 samples. This confirms the formation of the magnetic nanocomposites. The (003) peak intensity of Mg,Fe-LDHs coincides with the highly intense peak of Fe3O4. It should be noted here that the main (003) peak of the harmonica-like 2D-structure of Mg,Fe-LDHs phase is higher in intensity compared to the (311) peak of magnetite. Therefore, it is understood that the fraction of Fe3O4 is lower than Mg,Fe-LDHs. The increase in the formation of the magnetic phase is due to the addition of a higher concentration of magnetite, leading to the formation of aggregates, which broke the layered structure of the magnetic nanocomposite (Mg,Fe-LDH·2.0Fe3O4 sample). However, by increasing the stoichiometry of Fe3O4 in the magnetic nanocomposites, the relative intensities of the diffraction peaks corresponding to Fe3O4 start to uncontrollably increase. It has been also confirmed that no changes occur when varying the amount of magnetite phase in the crystalline layered structure before x = 1.0 (Fig. S4, ESI†).
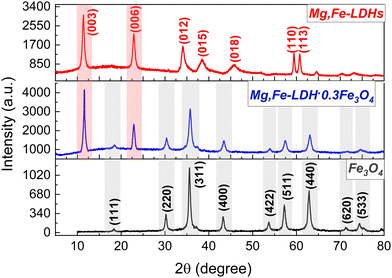 | ||
| Fig. 2 Powder XRD patterns of the initial components (Fe3O4 and Mg,Fe-LDHs) and the resulting magnetic nanocomposite (Mg,Fe-LDH·0.3Fe3O4). | ||
The crystal lattice parameters of the obtained materials were calculated from the XRD data (Table 1). Parameter a represents the average intermetallic distance calculated from the position of the (110) reflection, and parameter c corresponds to 3d(003). The basal spacing of the starting Mg,Fe-LDHs equals 7.7761 Å based on the (003) plane. The d(003) values of the obtained magnetic nanocomposites were found to range from 7.7763 Å to 7.7923 Å. The crystallite sizes (D, Å) for the Fe3O4 and Mg,Fe-LDH·xFe3O4 samples were determined by Scherrer equation37 from the characteristic peaks (311) and (003) of the crystal plane Fe3O4 and Mg,Fe-LDHs phases, respectively. These XRD results are consistent with those reported in the literature for these compounds prepared by other routes.15
| Sample | Magnetite | Hydrotalcite | |||
|---|---|---|---|---|---|
| D (311), Å | d (003), Å | a = b, Å | c, Å | D (003), Å | |
| Notes. a = 2d(110) and represents the average distance between cations; c = 3d(003) and is related to the thickness of the interlayer distance. | |||||
| Mg,Fe-LDHs | — | 7.7761 | 3.1095 | 23.3284 | 33.5 |
| Mg,Fe-LDH·0.1Fe3O4 | 14.2 | 7.7763 | 3.1098 | 23.3296 | 20.2 |
| Mg,Fe-LDH·0.3Fe3O4 | 13.3 | 7.7769 | 3.1101 | 23.3298 | 32.2 |
| Mg,Fe-LDH·0.5Fe3O4 | 12.5 | 7.7773 | 3.1107 | 23.3310 | 21.2 |
| Mg,Fe-LDH·1.0Fe3O4 | 14.0 | 7.7784 | 3.1121 | 23.3423 | 36.7 |
| Mg,Fe-LDH·2.0Fe3O4 | 14.2 | 7.7923 | 3.1045 | 23.3331 | 25.5 |
| Fe3O4 | 12.2 | — | — | — | — |
Fig. 3a shows the magnetic hysteresis loops of the Fe3O4 nanoparticles and the corresponding magnetic nanocomposites. All of the obtained samples present superparamagnetic properties. The synthesized magnetic nanocomposites have almost zero coercivity and remanence, thus proving their superparamagnetic properties.40 These properties of the nanocomposites can be explained in that the Fe3O4 nanoparticles consist of small crystallite aggregates, which have LDHs shells around each other. The saturation magnetization of pristine Fe3O4 is 75.87 emu g−1, which is lower than that of the bulk magnetite (92 emu g−1).41 Upon increasing the stoichiometric ratio of Fe3O4, the specific saturation magnetizations of the magnetic nanocomposites initially linearly increases and then levels off (Fig. 3b). This might be due to the bonding of the diamagnetic materials (inorganic layered materials) to the nanoparticles surface, hence quenching their magnetic moment. In addition, the disordered surface region of the prepared magnetic nanoparticles increases the surface spin disorientation. This might lead to the reduction of the effective magnetic moment. Conversely, the saturation magnetization of the highest Fe3O4-loading nanocomposite (Mg,Fe-LDH·2.0Fe3O4) is 67.49 emu g−1, which is below the value obtained for pristine Fe3O4. The magnetic nanocomposite with x = 0.1 has the lowest magnetization (38.03 emu g−1), which is ∼2 times less compared to the pristine magnetite; it still can be used even under a relatively low external magnetic field.
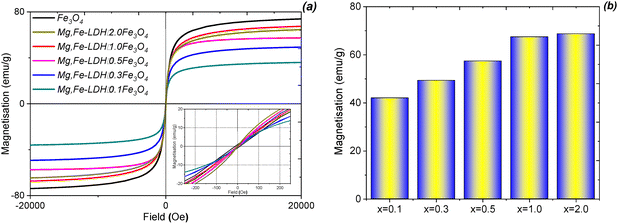 | ||
| Fig. 3 Magnetic hysteresis loops (a) and variation of the magnetizations (b) for the Fe3O4 and Mg,Fe-LDH·xFe3O4 (x = 0 to 2) samples. | ||
The pristine Fe3O4 can be separated quickly and efficiently under a magnetic field in just 10 s, and re-dispersed immediately once the external magnetic field is off. Although the magnetization of Mg,Fe-LDH·xFe3O4 decreases as a result of functionalization, the magnetic responses of Mg,Fe-LDH·0.3Fe3O4 and Mg,Fe-LDH·0.5Fe3O4 are sufficiently high for practical applications. This confirmed that Fe3O4 and Mg,Fe-LDHs were assembled into the nanocomposites, rather than just mechanically mixed.
The textural parameters of the materials are a very important characteristic in the adsorption process. In this way, the specific surface area (SBET), the total pore volume (Vtot), and pore size distribution (D) of the obtained solids are measured using N2 adsorption/desorption at 77 K (Fig. 4).
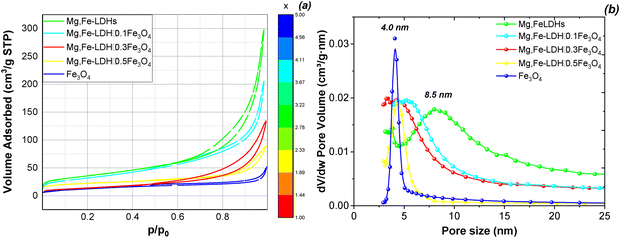 | ||
| Fig. 4 N2 adsorption/desorption isotherms (a) and pore size distribution (b) of the initial components and corresponding magnetic nanocomposites. | ||
As presented in Fig. 4a, the adsorption/desorption isotherms of the Mg,Fe-LDHs and corresponding magnetic nanocomposites are of type II, according to the IUPAC classification.42 The isotherms exhibit a low closed H3-type hysteresis loop above the relative pressure of 0.6 due to the mesopores structure and capillary condensation process, accompanied by multilayers when starting the adsorptive cycle.
The N2 adsorption/desorption data show that the SBET of the bare Mg,Fe-LDHs is 120.0 m2 g−1 (Table 2), which is greater than that reported by Silva et al. (84.0 m2 g−1).15 Quite differently, the specific surface area of bare Fe3O4 is less than 50 m2 g−1 and there is a very narrow distribution of the pore size (4.0 nm), as shown in Fig. 4b. At the same time, all magnetic layer-structured nanoadsorbents show a lower SBET than bare Mg,Fe-LDHs. The Mg,Fe-LDH·0.1Fe3O4 nanocomposite has a specific surface area of 108.4 m2 g−1 and a broad pore size distribution of 6.0–6.3 nm, while the Mg,Fe-LDH·0.5Fe3O4 sample has a SBET of 45.0 m2 g−1 and a narrow pore size distribution close to 4.07 nm. These results are in agreement with the different morphologies of the nanocomposites, i.e., Mg,Fe-LDH·0.5Fe3O4 with the compact parallel stacking Mg,Fe-LDHs shell plates may possess a small SBET compared to Mg,Fe-LDH·0.1Fe3O4 with relatively loose vertically oriented Mg,Fe-LDHs shell plates.
| Samples | S BET (m2 g−1) | V tot (cm3 g−1) | D (nm) |
|---|---|---|---|
| Mg,Fe-LDHs | 120.0 | 0.21 | 8.54 |
| Mg,Fe-LDH·0.1Fe3O4 | 108.4 | 0.20 | 6.23 |
| Mg,Fe-LDH·0.3Fe3O4 | 70.3 | 0.19 | 5.72 |
| Mg,Fe-LDH·0.5Fe3O4 | 65.0 | 0.18 | 4.97 |
| Mg,Fe-LDH·1.0Fe3O4 | 45.0 | 0.18 | 4.07 |
| Fe3O4 | 42.0 | 0.17 | 4.05 |
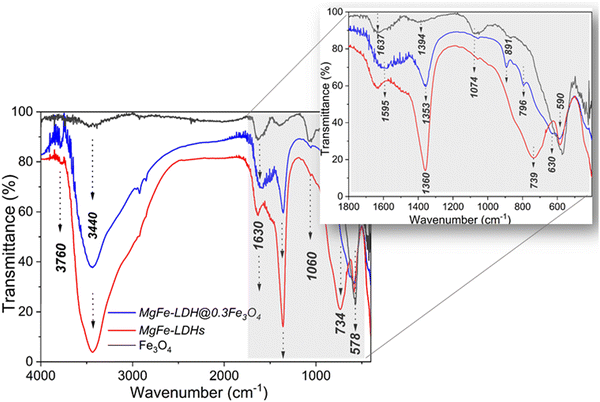
The FTIR spectra of the starting components (Mg,Fe-LDHs and Fe3O4) and corresponding magnetic nanocomposites (Mg,Fe-LDH·0.3Fe3O4 as example) are illustrated in Fig. 5. The strong and broad absorption peak in all FTIR spectra between 3600 and 3300 cm−1 is due to the hydrogen-bonded ν(OH) vibrations, both from the brucite-like layers and from the interlayer water molecules. The interlayer water molecules also give rise to the broad absorption vibration (δ(H2O)) with medium intensity that is close to 1630 cm−1. Moreover, the hydrogen bonding of the water with interlayer CO32− ions also gives rise to a shoulder at 1354 cm−1 in the spectrum of the Mg,Fe-LDHs sample. The very intense absorption band at 1361 cm−1 in the Mg,Fe-LDH·0.3Fe3O4 spectrum corresponds to the ν3 mode of the interlayer CO32− species. Thus, this band was shifted to higher wavenumbers after contact with magnetite nanoparticles. Furthermore, when compared to ν(OH) of H2O molecules, the strong and narrow band of ν3(CO32−) for Mg,Fe-LDHs compared to Mg,Fe-LDH·0.3Fe3O4 indicates a higher symmetry of the arrangement of interlayer CO32− ions between the layers of Mg,Fe-LDHs, and thus higher crystallinity of that sample.
For all samples, the stretching modes at shorter frequency (below 800 cm−1) are due to lattice vibrations, involving metal–oxygen stretching bonds (Fig. 5). The peaks located at 739 cm−1 and 584 cm−1 shown in the spectrum of Mg,Fe-LDHs are the stretching vibration of the Mg(II)–O and Fe(III)–O bonds of brucite-like layers, respectively. Furthermore, the FTIR spectrum of the Fe3O4 nanoparticles shows two typical bands of Fe–O bonds: one at about 428 cm−1 that is attributed to the stretching modes of the octahedral sites of the Fe(II)–O bonds, and the other at about 578 cm−1 that is attributed to the stretching vibrations of the octahedral and tetrahedral sites (Fe(III)–O). These vibrations were shifted to higher wavenumbers to 445 cm−1 and 584 cm−1, respectively, after the Fe3O4 was loaded onto the Mg,Fe-LDHs. Furthermore, there was a new band observed at 570 cm−1, which was assigned to the Fe(III)–O stretching vibration of Fe3O4. The M–O vibrational modes of the magnetic nanocomposites that lie below 1000 cm−1 are shifted in position in association with the different atomic weights of the Mg(II), Fe(II) and Fe(III) ions and their bond strengths with oxygen. The 1380 cm−1 band shifted to a higher wavenumber (1438 cm−1), which is attributed to the interaction between Fe3O4 and the interlayer anions of Mg,Fe-LDHs. Thus, the FTIR spectrum of the Mg,Fe-LDH·0.3Fe3O4 sample indicates a mixture of MgFe-LDHs and Fe3O4 phases.
EDX, AAS and TGA analyses were combined to obtain the chemical composition of the prepared solids. The EDX spectra in Fig. S4 (ESI†) demonstrated the presence of O, Mg, Fe, Na and Cl elements in Mg,Fe-LDHs. Of these, Na and Cl are attributed to several impurities, and Mg, Fe, and O are derived from the target Mg,Fe-LDHs sample. It can be seen from Table 3 that the Mg(II)/Fe(III) molar ratios of the Mg,Fe-LDHs was about 2.9, which was equal to those of the starting reaction mixture (3.0), suggesting complete coprecipitation of the metal cations on the brucite layers during hydrothermal treatment. However, the molar ratios of the samples by both methods are quite different. The Mg(II)/Fe(III) ratios by EDX analysis are obviously lower than the AAS one, indicating the possible Fe3O4-rich surface of the sorbents. Meanwhile, the Mg(II)/Fe(III) molar ratios of Mg,Fe-LDH·0.1Fe3O4 and Mg,Fe-LDH·0.5Fe3O4 are much larger than the corresponding AAS ones (0.76 and 0.15). For Mg,Fe-LDHs, the Mg(II) species is even undetected on the surface owing to its much thicker Fe3O4 layer, as mainly illustrated by the TEM data (Fig. 1c–f). These observations clearly demonstrate the clear structure of these magnetic nanoadsorbents involving the Mg,Fe-LDHs plate-like particles with different amounts of variously oriented growth of the magnetic nanoparticles on their surface.
| Sample | EDX analysis | AAS analysis | ||||||
|---|---|---|---|---|---|---|---|---|
| Composition (%) | ||||||||
| Mg(II) | Fe(III) | Cl(I) | Mg(II)/Fe(III) | Mg(II) | Fe(III) | Na(I) | Mg(II)/Fe(III) | |
| Mg,Fe-LDHs | 55.2 | — | 15.2 | — | 51.4 | 17.7 | 12.1 | 2.9 |
| Mg,Fe-LDH·0.1Fe3O4 | 41.3 | 34.3 | 13.2 | 0.95 | 32.15 | 14.06 | 10.6 | 1.24 |
| Mg,Fe-LDH·0.3Fe3O4 | 21.1 | 22.9 | 3.11 | 1.12 | 21.13 | 24.11 | 8.51 | 1.12 |
| Mg,Fe-LDH·0.5Fe3O4 | 31.1 | 26.1 | 14.3 | 1.19 | 33,4 | 43.8 | 5.26 | 0.76 |
| Mg,Fe-LDH·1.0Fe3O4 | 22.1 | 21.4 | 9.3 | 1.05 | 21,3 | 39.5 | 1.29 | 0.85 |
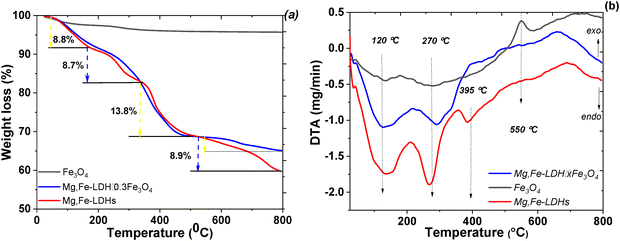
The TGA analysis of the as-synthesized materials was performed under an inert atmosphere (Fig. 6). The total weight loss of the bare Fe3O4 is 4.4% (Fig. 6a) for the whole temperature range because of the slow removal of all kinds of adsorbed water. Accordingly, the TG curves of the Mg,Fe-LDHs and Mg,Fe-LDH·0.3Fe3O4 samples exhibit four degradation steps. The first step corresponds to the removal of physically bonded water from the interlayer space (25–170 °C), and a weight loss of 8.8% is observed on both TG curves for this stage. The second one (in the temperature interval of 170–340 °C) is related to the dehydration of the brucite-like layers, where the TG curve shows a major weight loss of 8.7%. The next weigh loss of 13.8% also occurred at the temperature range of 340–530 °C, which is due to the decomposition of the interlayer carbonate ions. The last weight loss of 8.9% occurred at high temperature (≥530 °C), and can be ascribed to the dehydroxylation (or the collapse) of the hydroxide layers. The total weight losses of the prepared Mg,Fe-LDHs and Mg,Fe-LDH·0.3Fe3O4 samples were measured to be 40.2% and 34.7%, respectively.
As in Fig. 6b, the DTA profile of the samples shows three main peaks at 120 °C, 270 °C and 395 °C (and an edge at 550 °C). The peaks at 165 °C and the edge of 270 °C originated from the interlayer water loss and dehydration, respectively. The peak at 395 °C can be ascribed to the dehydroxylation and decomposition of anionic carbonates. Generally, the mass loss processes were endothermic, thus supporting a water vaporization mechanism. The DTA results for the initial Mg,Fe-LDHs were similar to those of the magnetic nanocomposite.
To complete the characterization study, the stoichiometric coefficients of the materials were derived using the Mg/Fe ratio determined by AAS (Table 3), the amount of CO2 and H2O lost between 250 °C and 800 °C determined by TGA (Fig. 6a), and considering the electroneutrality of the solids. The uncertainties are based on the assumption that the analytical accuracy of the used AAS technique is ±5% for Mg and Fe, and that the trueness of the TGA analysis is well below 5%. In this case, for sample Mg,Fe-LDH·0.3Fe3O4 containing carbonate ions, the following formula Mg0.74Fe0.26(OH)2[(CO32−)0.2·2H2O]·0.3(Fe3O4) is calculated.
To identify the chemical composition and phases formed from the solids, the solids obtained upon TGA of Mg,Fe-LDH·0.3Fe3O4 at temperatures ranging from 100 to 800 °C were also analyzed by XRD analysis (Fig. S5, ESI†). The products can be indexed to MgFe2O4 (spinel phase), MgO, and FeO, and the removal of interlayer water, hydroxyl and carbonate groups can be described as follows:
1st stage:
| Mg0.74Fe0.26(OH)2[(CO32−)0.2·2H2O]·0.3(Fe3O4) → Mg0.74Fe0.26(OH)2[(CO32−)0.2]·0.3(Fe3O4) + 2H2O |
2nd stage:
| Mg0.74Fe0.26(OH)2[(CO32−)0.2]·0.3(Fe3O4) → Mg0.74Fe0.26O[(CO32−)0.2]·0.3(Fe3O4) + H2O |
3rd stage:
| Mg0.74Fe0.26O[(CO32−)0.2]·0.3(Fe3O4) → Mg0.72Fe0.28O(Fe3O4)0.3 (or(MgO)0.37(FeO)0.3(MgFe23O4.1)0.37) + 0.2CO2 |
In fact, the results of the XRD patterns, N2 isotherms, FTIR spectra, VRM, TGA, TEM and SEM/EDX analyses indicate the existence of Fe3O4 in the layered structure of Mg,Fe-LDHs of the obtained Mg,Fe-LDH·xFe3O4 (0 < x < 1.0) nanocomposites, thereby making them the most suitable materials for MSPE.
3.2. Adsorption performance for pharmaceuticals
To obtain magnetic nanocomposites with the appropriate adsorption performance toward target DCF molecules, several parameters were optimized including the pH of the medium, removal and equilibrium parameters. The Mg,Fe-LDHs and Mg,Fe-LDHs·0.3Fe3O4 samples were selected as the representative adsorbents because they demonstrate essentially different properties in the removal experiments.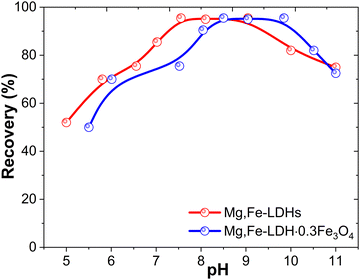 | ||
| Fig. 7 Effect of the pH value on the recovery of DCF by the initial Mg,Fe-LDHs and Mg,Fe-LDH·0.3Fe3O4 (conditions: V = 200 mL, C = 500 ng mL−1 and weight 50 mg). | ||
As presented in Fig. 7, it was found that the pH of the solution has a major effect on the adsorption capacity in the entire range of studied pH values. The Mg,Fe-LDHs do not exhibit an obvious adsorption when the pH value is below 6. This may be explained by the fact that the Mg,Fe-LDHs have positive charges below the pHPZC (9.94, Fig. S7, ESI†), and efficient interaction occurs between DCF and the surface of the brucite-like layer motifs. Thus, the surface of Mg,Fe-LDHs carries a positive charge below pHPZC, facilitating the adsorption of DCF through electrostatic forces. Conversely, at pH values above the pHPZC, the surface of Mg,Fe-LDHs becomes negatively charged. This may lead to electrostatic repulsion with DCF molecules, resulting in decreased adsorption capacity (Fig. 7). This further demonstrates the participation of electrostatic interactions in the adsorptive removal of DCF on the Mg,Fe-LDHs. This effect was also observed with a slight shift to basic pH for the magnetic nanocomposites. It has been shown that DCF was efficiently absorbed at pH 7.0–8.5 and 7.5–9.5 for the Mg,Fe-LDHs and Mg,Fe-LDH·0.3Fe3O4 samples. The high removal of DCF at pH (6.7–7.5) could be due to the hydrogen bonding formation and metal complexation. So, the DCF motifs mainly carboxylic-interact with the Fe(III) ions of the matrix, and form complexes based on coordination bonds.25 The formation of the Fe(III)-ligand coordination bonds is based on the theory of “hard and soft acids and bases” (HSAB). The HSAB principle states that Fe(III) ions as hard Lewis acids prefer to combine with hard bases, such as water (donor atom, O) molecules and DCF (N,O donor atoms) anions to generate stable complexes. The surface complexes involve the bonding of several Lewis base species to one Lewis acid center.
Therefore, a pH value of 7.5–8.5 was chosen as an optimum value for subsequent experiments. The pH of environmental water is usually around 7.5–9.0; in this case, it is not necessary to adjust the solution pH for practical applications of the adsorbents.
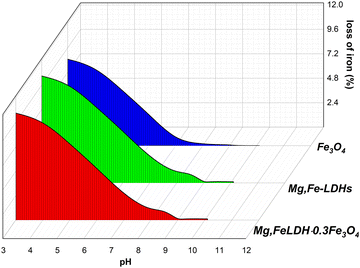 | ||
| Fig. 8 Effect of the pH value on the stability of the obtained materials after 24 hours contact time. | ||
According to AAS analysis, the maximum leaching amount of Fe3+ ions from Mg,Fe-LDHs at DCF sorption under the studied pH solution was found to be 0.004 mg L−1 (0.1 g solid added to 50 mL solution). However, the maximum leaching of Mg2+ ions was found to be significant, indicating that the material may not be safe under all conditions.
Based on the above main properties of the obtained materials, the nanocomposites Mg,Fe-LDH·0.3Fe3O4 and Mg,Fe-LDH·0.5Fe3O4, which can form a stable colloidal suspension in aqueous solution and good extraction by NdFeB magnet, were chosen for studying the adsorption properties.
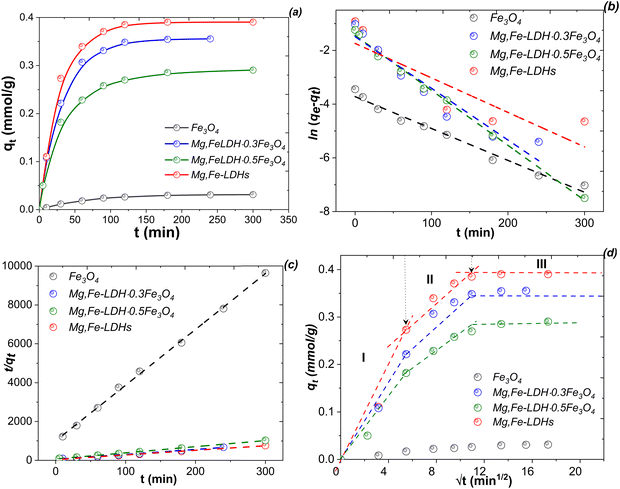
Pseudo-first order and pseudo-second order models were used to fit the adsorption kinetic data (Fig. 10b and c), and the parameters are summarized in Table 4. Correlation coefficients (R2 > 0.98) of the pseudo-second order kinetic model obtained from the DCF adsorption were higher than that for the pseudo-first order kinetic model. When the second-order model is applied, the rate constant (k2) varies from 1.2054 to 0.1842 g mmol−1 min−1. Moreover, the calculated adsorption capacities obtained from this kinetic model were approximately close to the experimental data. Therefore, the adsorption of DCF on the above materials could be dominated by the chemisorption process44 with a rate-limiting step at all-time intervals. Similar results have been obtained for the adsorption of DCF by the Zn,Al-LDH·xBi2O320 and CS@PANI@Mg,Al-LDH21 composites.
| Sample | q expe (mmol g−1) | Pseudo-first order model | Pseudo-second order model | ||||
|---|---|---|---|---|---|---|---|
| q cale (mmol g−1) | k 1 (min−1) | R 2 | q cale (mmol g−1) | k 2 (g mmol−1 min−1) | R 2 | ||
| q expe and qcale are the experimental and calculated adsorption capacity at equilibrium, respectively (mmol g−1); k1 and k2 are the pseudo-first-order and pseudo-second-order rate constants, respectively. | |||||||
| Mg,Fe-LDHs | 0.38 | 0.22 | 0.022 | 0.8612 | 0.42 | 0.1842 | 0.9919 |
| Mg,Fe-LDH·0.3Fe3O4 | 0.37 | 0.23 | 0.019 | 0.9251 | 0.38 | 0.1868 | 0.9823 |
| Mg,Fe-LDH·0.5Fe3O4 | 0.29 | 0.31 | 0.022 | 0.9012 | 0.31 | 0.2027 | 0.9946 |
| Fe3O4 | 0.03 | 0.08 | 0.013 | 0.9529 | 0.03 | 1.2051 | 0.9898 |
However, the removal of DCF on the obtained nanomaterials was not expected to only follow typical kinetic models, and a number of other mechanisms might be governing the adsorption processes. In this context, to demonstrate the molecular diffusion effect, the Weber–Morris (or intra-particles diffusion) kinetic model45 is applied. The plots and values of the corresponding rate constants are presented in Fig. 10d and Table S1 (ESI†), respectively. In Fig. 10d, the graphs do not have a linear fitting plot, indicating that the removal process was controlled by several factors. The fitting plots contain three different regions, which is consistent with various step adsorption processes. The first stage involves rapid adsorption (∼75%) on the surface of the materials within a period of the initial 60 min. The rate constant (Ki) is larger in the obtained magnetic nanocomposites than the pristine Mg,Fe-LDHs due to the large specific surface area (Table 2). The second stage involves a decrease in the slope of the fitting line, suggesting a reduction in the adsorption sites of the adsorbents as they are consumed, resulting in a decrease in the adsorption rate. This effect also suggests that the process is primarily adsorption in the exterior surface, along with some absorption inside the interlayer space. In the third stage, the slope of the fitting line is nearly zero, indicating a lack of adsorption sites, and the adsorption process reaches the equilibrium state.
The intercept (C) values of the obtained adsorbents are observed between 0.0005 mmol g−1 (I stage) and 0.3781 mmol g−1 (III stage) (Table S1, ESI†). It is known45 that with a greater value of C, there is a greater boundary layer effect in the sorption process. In this case, the effect of the boundary layer thickness is very important for the sorption in the III stage compared to the sorption in the I stage. This observation also indicates that the intra-particles diffusion of the DCF species is not the dominating factor controlling the mechanism of the adsorption process.
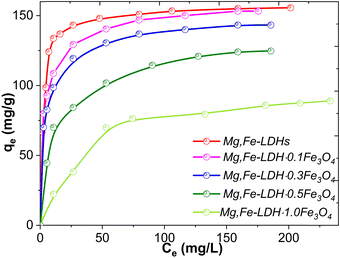 | ||
| Fig. 11 Adsorption isotherms of DCF onto Mg,Fe-LDHs and the corresponding magnetic nanocomposites at room temperature (conditions: pH = 7.5 ± 0.1, m/V = 1.00 g L−1, time = overnight). | ||
The experimental adsorption capacities toward DCF for the Mg,Fe-LDHs, Mg,Fe-LDH·0.1Fe3O4, Mg,Fe-LDH·0.3Fe3O4, Mg,Fe-LDH·0.5Fe3O4 and Mg,Fe-LDH·1.0Fe3O4 samples were 158.1 mg g−1 (0.49 mmol g−1), 153.2 mg g−1 (0.48 mmol g−1), 143.2 mg g−1 (0.45 mmol g−1), 124.3 mg g−1 (0.38 mmol g−1), and 89.1 mg g−1 (0.28 mmol g−1), respectively (Fig. 11 and Fig. S8, ESI†). The starting Mg,Fe-LDHs exhibit the highest adsorption performance due to the positive charge on the surface, and resulting in electrostatic repulsions between the DCF ions and Mg,Fe-LDHs. With increasing Fe3O4 amount, the adsorption capacity of the magnetic nanocomposites decreased, which may be attributed to the Mg,Fe-LDHs being stacked randomly on the surface of Fe3O4 and blocking the interlayer. This is not beneficial for removing DCF motifs in the magnetic solid-phase extraction process from aqueous solution.
The isotherm models are a serious justification for evaluating the interaction between the organic molecules on the surface adsorbents and DCF in the solution at the equilibrium state.10,21 To further understand the adsorption mechanism of DCF by adsorbents, we used four classic adsorption model fits, Langmuir, Freundlich, Temkin and Redlich–Peterson. The Langmuir model represents a uniform surface property of the adsorbent, where only one molecule can be adsorbed at each adsorption site. The Freundlich model represents a non-uniform surface property, where a multimolecular overlay can be formed on the adsorption sites. The Redlich and Peterson model47 describes the low and high concentration limits of the Langmuir and Freundlich equations. The fitting curves of the isotherm adsorption models of the obtained adsorbents for DCF removal are plotted in Fig. S9 (ESI†) with the parameters shown in Table 5.
| Model | Parameter | Mg,Fe-LDHs | Mg,Fe-LDH·0.1Fe3O4 | Mg,Fe-LDH·0.3Fe3O4 | Mg,Fe-LDH·0.5Fe3O4 | Mg,Fe-LDH·1.0Fe3O4 | Fe3O4 |
|---|---|---|---|---|---|---|---|
| q m and KL are the Langmuir constants related to the capacity of adsorbents and energy of adsorption, respectively; KF is the partitioning Freundlich coefficient, and 1/n is the dimensionless reaction order (commonly less than 1); bt is the Temkin constant related to the heat of sorption, AT is the equilibrium binding constant corresponding to the maximum binding energy; KRP is the Redlich–Peterson adsorption capacity constant; aRP is the Redlich–Peterson isotherm constant; and β is an exponent (dimensionless) between 0 and 1. | |||||||
| Langmuir | K L, (L mg−1) | 0.42 | 0.22 | 0.2 | 0.08 | 0.03 | 0.09 |
| q m, (mg g−1) | 156.25 | 156.24 | 147.06 | 133.33 | 102.04 | 30.4 | |
| R 2 | 0.9999 | 0.9997 | 0.9997 | 0.9997 | 0.9989 | 0.994 | |
| Freundlich | K F, (mg1−1/n L1/n g−1) | 81.4 | 72.88 | 63.61 | 33.08 | 9.6 | 7.41 |
| 1/n | 0.14 | 0.15 | 0.17 | 0.27 | 0.43 | 0.29 | |
| R 2 | 0.7546 | 0.9644 | 0.9598 | 0.9449 | 0.8971 | 0.9532 | |
| Temkin | A T (L mg−1) | 154.04 | 37.82 | 22.4 | 1.74 | 1.61 | 1.52 |
| b t , (J mol−1) | 153.84 | 138.07 | 138.94 | 111.67 | 112.84 | 453.01 | |
| R 2 | 0.832 | 0.9838 | 0.9822 | 0.988 | 0.9424 | 0.9838 | |
| Redlich–Peterson | K RP (L mg−1) | 3.65 | 7.13 | 0.40 | 0.19 | 0.16 | 0.14 |
| a RP (L mg−1)β | 0.41 | 0.49 | 0.12 | 0.22 | 0.13 | 0.67 | |
| β | 0.75 | 0.76 | 0.29 | 0.17 | 0.48 | 0.52 | |
| R 2 | 0.9579 | 0.9690 | 0.9998 | 0.9899 | 0.9999 | 0.9888 | |
The Langmuir isotherm equation (R2 ≥ 0.9940) displayed a better goodness of fit than the other tested equations, suggesting monolayer adsorption, and the calculated capacity (qm, Table 5) values of the obtained adsorbents from the Langmuir equation is very close to the values of the equilibrium experimental quantity adsorbed, as shown in Fig. 11. The KL values for DCF adsorption on the above adsorbents were all between 0 and 1, thereby confirming the dominant chemisorption process. According to the Freundlich equation at constant system pH, the adsorption isotherms of DCF on solids exhibited a nonlinear characteristic (1/n < 1), and also indicated a minimum interaction between the adsorbed DCF motifs. The nonlinearity of the sorption behaviors indicated specific interactions with functional groups on the obtained sorbents. Due to the low correlation coefficients (R2 ≥ 0.7546), the Freundlich equation was mainly ignored. The Temkin isotherm equation indicates the chemisorption process because the bt value was higher than 20 kJ mol−1.48 The linear fitting of the equilibrium data indicated that the experimental adsorption isotherm obtained for Mg,Fe-LDH 0.5Fe3O4 was best fitted to the Redlich–Peterson model, with the highest R2 parameter (shown in Table 5).
| No. | Sorbent | Adsorption performance (qm, mg g−1; time, min; pH medium, etc.) | Ref. |
|---|---|---|---|
| Notes. CS – carbon sphere; PmPD – Poly(m-phenylenediamine). | |||
| Pristine LDHs materials | |||
| 1 | Zn,Fe-LDH | 74.5 mg g−1; time 30 min, the pseudo-second order kinetic model. | 18 |
| 2 | MgAl-LDH (or calcined at 500 °C) | 123 mg g−1 (or 1494 mg g−1) | 19 |
| 3 | MgAl-LDH | 104 mg g−1; m/V = 5/20 mg mL−1 | 22 |
| 4 | Zn,Al-LDH (or calcined at 500 °C) | 94.32 mg g−1 (737.02 mg g−1), t = 20 min, the pseudo-second order kinetic model; pH = 7.0, V = 50 mL, m = 50 mg, T = 22 °C. | 24 |
| 5 | (Co, Mg, Ni and Zn),Al-LDHs | 38 mg g−1, 78 mg g−1, 16 mg g−1 and 150 mg g−1; 0.1–0.4 mg L−1, 298 K, pH 6; pseudo-second order linear reaction. | 26 |
| 6 | Mg,Fe-LDHs | 158.1 mg g−1, pH = 7.5, Langmuir isotherm model, suggesting the chemisorption process. | This study |
| LDHs-based composites | |||
| 7 | Zn,Al-LDH·xBi2O3 | 500 mg g−1 (Zn,Al-LDH·1.0Bi2O3); | 20 |
| 8 | CS@PANI@Mg,Al-LDH | 618.16 mg g−1, pH = 5.5 ± 0.1, m/V = 0.5 g L−1; t = 2–4 h, the pseudo-second order kinetic model; Langmuir isotherm model, suggesting the monolayer adsorption. | 21 |
| 9 | MgAl-LDH/PmPD | 588 mg g−1, Kd = 1.3 × 10⁴ mL g−1, time 2 h, pseudo-second order kinetic model. | 22 |
| 10 | Cellulose acetate/Mg–Al-LDH | pH = 7, the CA membrane retained only 2.7% of the drug due to a lack of electrostatic interaction between the neutral polymer and the negatively charged DCF molecule. | 23 |
| 11 | Fe3O4/cellulose/ionomer/CaAl–LDHs | 258 mg g−1, t = 2 min, Langmuir model (at low concentration) and Freundlich model (at high concentration level). | 35 |
| 12 | Mg,Fe-LDH·xFe3O4 (x = 0.1, 0.3, 0.5, 1.0 and 2.0) | 153.2 mg g−1 (0.48 mmol g−1), 143.2 mg g−1 (0.45 mmol g−1), 124.3 mg g−1 (0.38 mmol g−1), 89.1 mg g−1 (0.28 mmol g−1) and 76.1 mg g−1 (0.23 mmol g−1); m/V = 1.0 g L−1; pH = 7.5, Langmuir isotherm model, suggesting the chemisorption process. | This study |
At pH0 of 7.5, the maximum adsorption capacity of the starting Mg,Fe-LDHs towards DCF is 158.1 mg g−1, and this capacity can be much higher than those reported in other works for pristine LDHs (Table 6). This outcome was ascribed to the fact that the specific reaction (e.g., complex-formation) of the brucite-like structure of Mg,Fe-LDHs with DCF took place during the adsorption process. It is obvious that the performances of the prepared nanocomposites are at a satisfactory level with respect to the adsorption capacity among the reported LDHs-based hybrid materials. Thus, these prepared materials could be well suited for practical applications.
3.3. Adsorption mechanisms
To elucidate the interaction mechanisms between DCF and Mg,Fe-LDHs (or magnetic Mg,Fe-LDH·0.3Fe3O4), XRD and FTIR analyses were conducted, as shown in Fig. 12.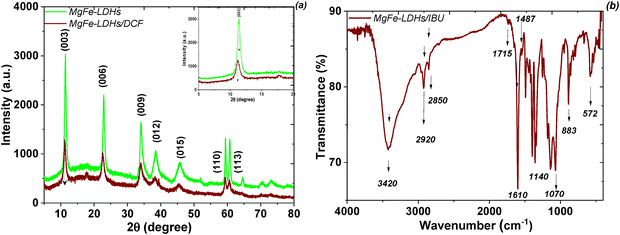 | ||
| Fig. 12 XRD patterns (a) and FTIR spectra (b) of Mg,Fe-LDHs before and after adsorption of DCF ions. | ||
By comparison of the XRD patterns before and after the adsorption of DCF (Fig. 12a), we can see that some diffraction-angle peaks are decreased (11.40° to 11.24°, 22.95° to 22.63°) and some peaks are increased (56.67° to 59.92°), while other peaks remained unchanged. The diffraction angle at 39.4588° in the XRD pattern after adsorption belongs to DCF. The basal peak (2θ = 36.2169°) position in the drug-containing product (Mg,Fe-LDHs/DCF, Fig. 12a) corresponds to an interlayer layer distance of 7.8598 Å, which is slightly higher than that of Mg,Fe-LDH by 0.00917. This means that the diclofenac ions mainly are not intercalated in the interlayer space of the layered structure. The 2θ values of the highly intense peaks for the initial Mg,Fe-LDHs and Mg,Fe-LDHs/DCF products are 36.3559° and 36.2169°, respectively. This effect is probably due to the interactions of the organic groups with the surface of the material and complexation of the layer-formed metal cations (Mg(II) and Fe(III)) of the Mg,Fe-LDHs plates. The results obtained from XRD analysis are consistent with the previously reported data.18
The FTIR spectra of Mg,Fe-LDHs before and after DCF adsorption were also recorded (Fig. 12b). Generally, the spectrum of DCF exhibited typical peaks at 3380 cm−1, 3030 cm−1, 1585 cm−1, 1556 cm−1, 1451 cm−1, 1289 cm−1, ν(C–NAr), and 750 cm−1 due to the ν(N–H), ν(C–HAr), δ(C![[double bond, length as m-dash]](https://www.rsc.org/images/entities/char_e001.gif) CAr), δ(N–H), ν(COO−) and ν(C–Cl) stretching vibrations, respectively. After DCF sorption, the peaks corresponding to ν(N–H), ν(COO), and ν(C–Cl) were shifted. This change indicated the existence of a chemical interaction between DCF and Mg,Fe-LDHs. Complexation between the
CAr), δ(N–H), ν(COO−) and ν(C–Cl) stretching vibrations, respectively. After DCF sorption, the peaks corresponding to ν(N–H), ν(COO), and ν(C–Cl) were shifted. This change indicated the existence of a chemical interaction between DCF and Mg,Fe-LDHs. Complexation between the ![[double bond, length as m-dash]](https://www.rsc.org/images/entities/char_e001.gif) N–H and –COOH groups of DCF and the metal ions of the brucite-like layers may have occurred.25 Additionally, the wide peak of the ν(O–H) stretching vibration of Mg,Fe-LDHs near 3440 cm−1 was shifted to 3396 cm−1, which was probably attributed to the formation of N⋯O and O⋯HO hydrogen bonding between DCF and the brucite-like layers of the Mg,Fe-LDHs plates. Based on the FTIR data of Mg,Fe-LDHs before and after adsorption, the uptake mechanism could be explained via electrostatic interaction, hydrogen bonding, and complexation interactions (Scheme 2). Moreover, adsorption takes place at the surface of the magnetic nanocomposites through electrostatic forces of attraction for DCF, accompanied by intercalation of CO32− anions from aqueous solution, which consequently remained unchanged by DCF via anion exchange according to XRD data.
N–H and –COOH groups of DCF and the metal ions of the brucite-like layers may have occurred.25 Additionally, the wide peak of the ν(O–H) stretching vibration of Mg,Fe-LDHs near 3440 cm−1 was shifted to 3396 cm−1, which was probably attributed to the formation of N⋯O and O⋯HO hydrogen bonding between DCF and the brucite-like layers of the Mg,Fe-LDHs plates. Based on the FTIR data of Mg,Fe-LDHs before and after adsorption, the uptake mechanism could be explained via electrostatic interaction, hydrogen bonding, and complexation interactions (Scheme 2). Moreover, adsorption takes place at the surface of the magnetic nanocomposites through electrostatic forces of attraction for DCF, accompanied by intercalation of CO32− anions from aqueous solution, which consequently remained unchanged by DCF via anion exchange according to XRD data.
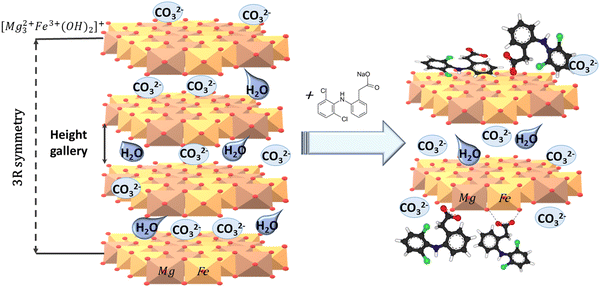 | ||
| Scheme 2 Schematic presentation of the adsorption mechanisms of DCF onto Mg,Fe-LDHs (or Mg,Fe-LDH·xFe3O4) samples. | ||
3.4. Regeneration of the adsorbents
Reusability is one of the key factors for evaluating the economic viability of novel sorbents. For this purpose, the Mg,Fe-LDH·0.3Fe3O4 nanocomposite was selected as a model sample. The adsorption capacity of the Mg,Fe-LDH·0.3Fe3O4 magnetic nanocomposite for three consecutive adsorption–desorption cycles is presented in Fig. 13. The regeneration studies for the nanocomposite reveal that 69–79% of the adsorbed analytes can be removed by washing (within 300 min) the DCF-adsorbed nanocomposites once with Na2CO3 (or NaNO3) solution. During the adsorption/desorption process, the non-renewable nature of the complexation reaction is the main reason for the gradual decrease in the removal of DCF ions. Thus, upon several repeated inorganic salts-treatment processes, the exhausted magnetic adsorbents can be regenerated.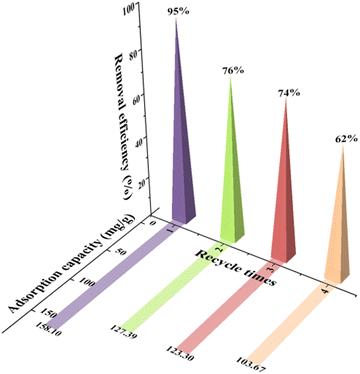 | ||
| Fig. 13 Reusability of the Mg,Fe-LDH·0.3Fe3O4 sample for the adsorption/desorption of DCF in aqueous solution. | ||
3.5. Multicomponent model solution study
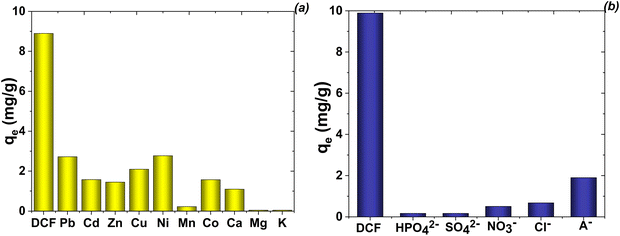
Under real conditions, the effective removal of a pollutant from the water matrix is significantly affected by the presence of other components with various concentrations.1,6 To conduct the selectivity study of the proposed magnetic adsorbents, the effect of interfering ions on the adsorption process was characterized using a multicomponent model solution (simulated water). Under the optimized experimental conditions, the effects of both cations (multi element ICP standard solution contains 23 elements) and anions (Cl−, NO3− HPO43−, SO42− and humic acids (A–)) on the adsorption of DCF were investigated. In this sense, various coexisting ions (approximately 4 mg L−1 of each component) were added to 50 mL aqueous solutions containing DCF with a concentration of 10 mg L−1 (Fig. 14).The mono- and doubly-charged cations showed different effects of the removal of DCF motifs on the adsorbents (Fig. 14a). Among them, Na+ and K+ ions only showed a minor influence on the adsorption of DCF. Alkaline earth metals (especially Ca2+ ions) were shown to have a relatively significant effect. Pb2+, Ni2+, Co2+ and other double-charged ions will cause interference if its concentration is more than 10 times over the DCF solution (Fig. 14a). Generally, double-charged cations had a greater influence than monocharged cations. Although the divalent cations showed insignificant effects on the adsorption of the target analyte, AAS showed that the concentration of Mg(II) ions in solution was significantly increased after the adsorption procedure. The mechanisms of these doubly-charged cations affecting the adsorption process would be integrated, including the effect of ionic strength, the effect of competitive adsorption, and the effect of isomorphic substitution with matrix Mg(II) ions. From Fig. 14b, it can be observed that the potentially interfering anions have no significant effect on the removal of DCF by the proposed procedure using the Mg,Fe-LDH·0.3Fe3O4 sample. A slight reduction in the sorption of DCF can be observed in the presence of Cl− and NO3−, and the interference effect was much stronger in the presence of humic acid.
To demonstrate the applicability of the developed procedure for real-time wastewater treatment, tests were performed at high concentrations of co-existing ions. In this case, the tolerance limit was taken as the concentration of the co-existing ions causing a variation in the intensity of DCF within ±25%. The tolerable ratio of each species concentration was as follows: 1000-fold for K+ and Na+ (from their nitrate salts); 10-fold for Pb2+, Cu2+, Cd2+, Zn2+, Al3+, Mn2+, Ni2+, and Co2+ (from their nitrate salts); and 20-fold for Mg2+ and Ca2+ (from their nitrate salts); 100-fold for PO43−, Cl−, NO3− and SO42− (from their sodium salts) ions.
3.6. Application to real water samples
The adsorption potential of the magnetic nanocomposites was explored via the removal of DCF in three real samples (artesian water, river water, and lake water (near pharmaceutical manufacturing plant)) by adding the samples with various DCF concentrations. The adsorption capacity data and the recoveries for spiked samples are shown (Fig. 15).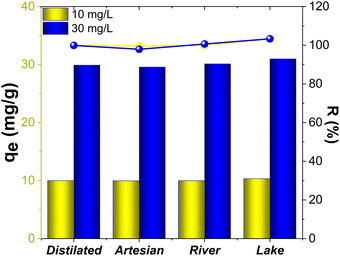 | ||
| Fig. 15 Analytical results and recovery of DCF on Mg,Fe-LDH·0.3Fe3O4 in various real samples under the optimum conditions. | ||
As illustrated in Fig. 15, DCF was removed entirely from all studied water samples. The average values of recovery on the spiked DCF in different samples ranged from 98.5% to 103.3%.
The good magnetic and adsorptive parameters of the obtained materials indicate that the proposed procedure has potential for MSPE of other pharmaceuticals from aqueous solution. As a result, the as-synthesized composites appear to be a promising platform for the removal of emerging organic pollutants from water media, and mainly without the use of an anion exchanger.
4. Conclusions
In summary, the Mg,Fe-LDH·xFe3O4 (x = 0.1, 0.3, 0.5, 1.0 and 2.0) nanocomposites as an efficient sorbent were synthesized via sonification treatment of both components. The molar ratio of Mg,Fe-LDHs/Fe3O4 had a significant effect on the 2D-layered structure and specific surface area of the magnetic nanocomposites. The Mg,Fe-LDH·xFe3O4 samples with 0.1 ≤ x ≤ 1.0 have a high magnetic saturation, and are well suited for magnetic solid phase extraction of pharmaceuticals from aqueous solution. High adsorption capacities of magnetic nanocomposites were obtained toward diclofenac sodium as a model pharmaceutical. The optimum pH for the removal of diclofenac by magnetic nanocomposites is about 7.5. The removal effectivity of diclofenac anions by Mg,Fe-LDH·xFe3O4 samples decreases with increasing Fe3O4-loading on the chemical composition of adsorbents. Analyte adsorption of the obtained nanocomposites is described by the Langmuir adsorption isotherm model, suggesting the monolayer adsorption process, whereas the Weber–Morys model indicates that the adsorption of diclofenac mainly occurs on the external surface. Conversely, the adsorption kinetic data for pollutants were well fitted to the pseudo-second-order model. Simultaneously, based on the XRD and FTIR data of samples before and after adsorption, the removal mechanism could be explained through electrostatic interaction (including hydrogen bonding) between adsorbents and diclofenac motifs, and complexation reactions in a heterogeneous system. With the overcoming of certain limitations related to the chemical composition of nanocomposites and excess double-charged inorganic cations in solution, they are poised to become a ubiquitous tool for environmental remediation efforts.Author contributions
Tetiana Hubetska: investigation, visualization, formal analysis, software; Victor Demchenko: formal analysis, investigation, data curation; Natalia Kobylinska – investigation, original draft, conceptualization. All authors have read and agreed to the published version of the manuscript.Data availability
ESI,† is available in the additional files, and further supporting data are available from the authors on request.Conflicts of interest
There are no conflicts to declare.Acknowledgements
The authors gratefully acknowledge the support of MINECO (Spain) for MCI-21-PID2020-113558RB-C41 and PID2020-119130 GB-I00 grants, providing materials characterization facilities. Dr Natalia Kobylinska would like to thank the European Chemistry School for Ukrainians.References
- P. Sathishkumar, R. A. A. Meena, T. Palanisami, V. Ashokkumar, T. Palvannan and F. L. Gu, Occurrence, interactive effects and ecological risk of diclofenac in environmental compartments and biota – a review, Sci. Total Environ., 2020, 698, 134057, DOI:10.1016/j.scitotenv.2019.134057.
- S. Schmidt, H. Hoffmann, L. A. Garbe and R. J. Schneider, Liquid chromatography–tandem mass spectrometry detection of diclofenac and related compounds in water samples, J. Chromatogr. A, 2018, 1538, 112–116, DOI:10.1016/j.chroma.2018.01.037.
- M. Patel, R. Kumar, K. Kishor, T. Mlsna, C. U. Pittman and D. Mohan, Pharmaceuticals of emerging concern in aquatic systems: chemistry, occurrence, effects, and removal methods, Chem. Rev., 2019, 119, 3510–3673, DOI:10.1021/acs.chemrev.8b00299.
- M. O. Barbosa, N. F. F. Moreira, A. R. Ribeiro, M. F. R. Pereira and A. M. T. Silva, Occurrence and removal of organic micropollutants: an overview of the watch list of EU Decision 2015/495, Water Res., 2016, 94, 257–279, DOI:10.1016/j.watres.2016.02.047.
- J. Schwaiger, H. Ferling, U. Mallow, H. Wintermayr and R. D. Negele, Toxic effects of the non-steroidal anti-inflammatory drug diclofenac. Part I: histopathological alterations and bioaccumulation in rainbow trout, Aquat. Toxicol., 2004, 68, 141–150, DOI:10.1016/j.aquatox.2004.03.014.
- A. Jakimska, A. Kot-Wasik and J. Namieśnik, The Current State-of-the-Art in the Determination of Pharmaceutical Residues in Environmental Matrices Using Hyphenated Techniques, Crit. Rev. Anal. Chem., 2014, 44, 277–298, DOI:10.1080/10408347.2013.835244.
- D. I. de Souza, A. Giacobbo, E. da, S. Fernandes, M. A. S. Rodrigues, M. N. de Pinho and A. M. Bernardes, Experimental design as a tool for optimizing and predicting the nanofiltration performance by treating antibiotic-containing wastewater, Membranes, 2020, 10, 1–15, DOI:10.3390/membranes10070156.
- F. Méndez-Arriaga, S. Esplugas and J. Giménez, Degradation of the emerging contaminant ibuprofen in water by photo-Fenton, Water Res., 2010, 44, 589–595, DOI:10.1016/j.watres.2009.07.009.
- H. Wang, S. Wang, Y. Liu, Y. Fu, P. Wu and G. Zhou, Degradation of diclofenac by Fe(II)-activated bisulfite: kinetics, mechanism and transformation products, Chemosphere, 2019, 237, 124518, DOI:10.1016/j.chemosphere.2019.124518.
- M. S. Shamsudin, S. F. Azha and S. Ismail, A review of diclofenac occurrences, toxicology, and potential adsorption of clay-based materials with surfactant modifier, J. Environ. Chem. Eng., 2022, 10, 107541, DOI:10.1016/j.jece.2022.107541.
- F. Poorsharbaf Ghavi, F. Raouf and A. Dadvand Koohi, A Review on Diclofenac Removal from Aqueous Solution, Emphasizing on Adsorption Method, Iran. J. Chem. Chem. Eng., 2020, 39, 141–154 Search PubMed.
- T. S. Hubetska, A. S. Mestre, N. G. Kobylinska and A. P. Carvalho, Steam Activation of Acid-Chars for Enhanced Textural Properties and Pharmaceuticals Removal, Nanomaterials, 2022, 12, 3480, DOI:10.3390/nano12193480.
- F. Cavani, F. Trifirb and A. Vaccari, Hydrotalcite-type anionic clays: preparation, properties and applications, Catal. Today, 1991, 11, 173–301, DOI:10.1016/0920-5861(91)80068-K.
- L. Zhou, J. Liu, A. Lu, J. Shen, J. Xu and H. Jiang, Controllable synthesis of cubic magnetic MgFe2O4 derived from MgFe-LDHs for efficient removal of methyl orange, Chem. Eng. J., 2022, 428, 131174, DOI:10.1016/j.cej.2021.131174.
- A. F. da Silva, J. L. da, S. Duarte and L. Meili, Different routes for MgFe/LDH synthesis and application to remove pollutants of emerging concern, Sep. Purif. Technol., 2021, 264, 118353, DOI:10.1016/j.seppur.2021.118353.
- V. Rives, M. del Arco and C. Martín, Intercalation of drugs in layered double hydroxides and their controlled release: a review, Appl. Clay Sci., 2014, 88–89, 239–269, DOI:10.1016/j.clay.2013.12.002.
- J. W. Boclair and P. S. Braterman, Layered double hydroxide stability. 1. Relative stabilities of layered double hydroxides and their simple counterparts, Chem. Mater., 1999, 11, 298–302, DOI:10.1021/cm980523u.
- H. A. Younes, R. Khaled, H. M. Mahmoud, H. F. Nassar, M. M. Abdelrahman, F. I. Abo El-Ela and M. Taha, Computational and experimental studies on the efficient removal of diclofenac from water using ZnFe-layered double hydroxide as an environmentally benign absorbent, J. Taiwan Inst. Chem. Eng., 2019, 102, 297–311, DOI:10.1016/j.jtice.2019.06.018.
- B. A. Jimenez-López, R. Leyva-Ramos, E. Mendoza-Mendoza, D. E. Villela-Martínez and D. H. Carrales-Alvarado, Adsorption of diclofenac from water solution on layered double hydroxide Mg/Al/CO3 synthesized from sulphate salts and calcined, Environ. Nanotechnol., Monit. Manage., 2023, 20, 100782, DOI:10.1016/j.enmm.2023.100782.
- P. Kumari, B. Pal and R. K. Das, Superior adsorptive removal of eco-toxic drug diclofenac sodium by Zn–Al LDH·xBi2O3 layer double hydroxide composites, Appl. Clay Sci., 2021, 208, 106119, DOI:10.1016/j.clay.2021.106119.
- H. Xu, S. Zhu, M. Xia and F. Wang, Rapid and efficient removal of diclofenac sodium from aqueous solution via ternary core-shell CS@PANI@LDH composite: experimental and adsorption mechanism study, J. Hazard. Mater., 2021, 402, 123815, DOI:10.1016/j.jhazmat.2020.123815.
- T. Xiong, X. Yuan, H. Wang, Z. Wu, L. Jiang, L. Leng, K. Xi, X. Cao and G. Zeng, Highly efficient removal of diclofenac sodium from medical wastewater by Mg/Al layered double hydroxide-poly(m-phenylenediamine) composite, Chem. Eng. J., 2019, 366, 83–91, DOI:10.1016/j.cej.2019.02.069.
- M. D. Raicopol, C. Andronescu, S. I. Voicu, E. Vasile and A. M. Pandele, Cellulose acetate/layered double hydroxide adsorptive membranes for efficient removal of pharmaceutical environmental contaminants, Carbohydr. Polym., 2019, 214, 204–212, DOI:10.1016/j.carbpol.2019.03.042.
- N. Boukhalfa, M. Boutahala and N. Djebri, Synthesis and characterization of ZnAl-layered double hydroxide and organo-K10 montmorillonite for the removal of diclofenac from aqueous solution, Adsorpt. Sci. Technol., 2017, 35, 20–36, DOI:10.1177/0263617416666548.
- Y. Zhao, F. Liu and X. Qin, Adsorption of diclofenac onto goethite: adsorption kinetics and effects of pH, Chemosphere, 2017, 180, 373–378, DOI:10.1016/j.chemosphere.2017.04.007.
- L. Santamaría, F. Devred, E. M. Gaigneaux, M. A. Vicente, S. A. Korili and A. Gil, Effect of the surface properties of Me2+/Al layered double hydroxides synthesized from aluminum saline slag wastes on the adsorption removal of drugs, Microporous Mesoporous Mater., 2020, 309, 110560, DOI:10.1016/j.micromeso.2020.110560.
- M. Sajid and I. Ihsanullah, Magnetic layered double hydroxide-based composites as sustainable adsorbent materials for water treatment applications: progress, challenges, and outlook, Sci. Total Environ., 2023, 880, 163299, DOI:10.1016/j.scitotenv.2023.163299.
- R. Ran Shan, L. Guo Yan, K. Yang, Y. Feng Hao and B. Du, Adsorption of Cd(II) by Mg–Al–CO3- and magnetic Fe3O4/Mg–Al–CO3-layered double hydroxides: kinetic, isothermal, thermodynamic and mechanistic studies, J. Hazard. Mater., 2015, 299, 42–49, DOI:10.1016/j.jhazmat.2015.06.003.
- H. Zhang, G. Zhang, X. Bi and X. Chen, Facile assembly of a hierarchical core@shell Fe3O4@CuMgAl-LDH (layered double hydroxide) magnetic nanocatalyst for the hydroxylation of phenol, J. Mater. Chem. A, 2013, 1, 5934–5942, 10.1039/c3ta10349h.
- X. L. Wu, L. Wang, C. L. Chen, A. W. Xu and X. K. Wang, Water-dispersible magnetite-graphene-LDH composites for efficient arsenate removal, J. Mater. Chem., 2011, 21, 17353–17359, 10.1039/c1jm12678d.
- S. Barkhordari and A. Alizadeh, Fabrication of pH-sensitive chitosan/layered double hydroxide (LDH)/Fe3O4 nanocomposite hydrogel beads for controlled release of diclofenac, Polym. Bull., 2022, 79, 5533–5548, DOI:10.1007/s00289-021-03761-3.
- X. Hong, C. Ding, M. Shi, Z. Ding, P. Du, M. Xia and F. Wang, Easy separation dual-function Cu2O@LDH@Fe3O4 adsorbent for the removal of Cr(VI) under dark conditions: experimental and mechanistic study, Sep. Purif. Technol., 2024, 332, 125734, DOI:10.1016/j.seppur.2023.125734.
- Y. You, G. Xu, X. Yang, Y. Liu, X. Ma and Y. Ji, Cu–Fe–Ni layered hydroxides/magnetic biochar composite as peroxymonosulfate activator for removal of enrofloxacin, Colloids Surf., A, 2024, 683, 133082, DOI:10.1016/j.colsurfa.2023.133082.
- D. Chen, Y. Li, J. Zhang, J. Z. Zhou, Y. Guo and H. Liu, Magnetic Fe3O4/ZnCr-layered double hydroxide composite with enhanced adsorption and photocatalytic activity, Chem. Eng. J., 2012, 185–186, 120–126, DOI:10.1016/j.cej.2012.01.059.
- M. Hossein Beyki, M. Mohammadirad, F. Shemirani and A. A. Saboury, Magnetic cellulose ionomer/layered double hydroxide: an efficient anion exchange platform with enhanced diclofenac adsorption property, Carbohydr. Polym., 2017, 157, 438–446, DOI:10.1016/j.carbpol.2016.10.017.
- R. Massart, Preparation of Aqueous Magnetic Liquids in Alkaline and Acidic Media, IEEE Trans. Magn., 1981, 17, 1247–1248 CrossRef.
- A. L. Patterson, The Scherrer formula for X-ray particle size determination, Phys. Rev., 1939, 56, 978–982, DOI:10.1103/PhysRev.56.978.
- J. Park and J. R. Regalbuto, A Simple, Accurate Determination of Oxide PZC and the Strong Buffering Effect of Oxide Surfaces at Incipient Wetness, J. Colloid Interface Sci., 1995, 175(1), 239–252, DOI:10.1006/jcis.1995.1452.
- B. H. Toby and R. B. Von Dreele, GSAS-II: the genesis of a modern open-source all purpose crystallography software package, J. Appl. Crystallogr., 2013, 46, 544–549, DOI:10.1107/S0021889813003531.
- A. V. Samrot, C. S. Sahithya, J. Selvarani A, S. K. Purayil and P. Ponnaiah, A review on synthesis, characterization and potential biological applications of superparamagnetic iron oxide nanoparticles, Curr. Res. Green Sustainable Chem., 2021, 4, 100042, DOI:10.1016/j.crgsc.2020.100042.
- T. Arun, K. Prakash and R. Justin Joseyphus, Synthesis and magnetic properties of prussian blue modified Fe nanoparticles, J. Magn. Magn. Mater., 2013, 345, 100–105, DOI:10.1016/j.jmmm.2013.05.058.
- M. Thommes, K. Kaneko, A. V. Neimark, J. P. Olivier, F. Rodriguez-Reinoso, J. Rouquerol and K. S. W. Sing, Physisorption of gases, with special reference to the evaluation of surface area and pore size distribution (IUPAC Technical Report), Pure Appl. Chem., 2015, 87, 1051–1069, DOI:10.1515/pac-2014-1117.
- H. C. B. Hansen and R. M. Taylor, Formation of synthetic analogues of double metal-hydroxy carbonate minerals under controlled pH conditions: I. The synthesis of pyroaurite and reevesite, Clay Miner., 1990, 25, 161–179 CrossRef CAS.
- Y. S. Ho and G. McKay, Pseudo-second order model for sorption processes, Process Biochem., 1999, 34(5), 451–465, DOI:10.1016/S0032-9592(98)00112-5.
- W. J. Weber and J. C. Morris, Kinetics of adsorption carbon from solutions, J. Sanit. Eng. Div., Am. Soc. Civ. Eng., 1963, 89, 31–59 CrossRef.
- C. H. Giles, D. Smith and A. Huitson, A general treatment and classification of the solute adsorption isotherm. I. Theoretical, J. Colloid Interface Sci., 1974, 47, 755–765, DOI:10.1016/0021-9797(74)90252-5.
- O. Redlich and D. L. Peterson, A useful adsorption isotherm, J. Phys. Chem., 1959, 63, 1024, DOI:10.1021/j150576a611.
- K. H. Chu, Revisiting the Temkin Isotherm: Dimensional Inconsistency and Approximate Forms, Ind. Eng. Chem. Res., 2021, 60, 13140–13147, DOI:10.1021/acs.iecr.1c01788.
Footnote |
| † Electronic supplementary information (ESI) available. See DOI: https://doi.org/10.1039/d4ma00609g |
| This journal is © The Royal Society of Chemistry 2024 |

