 Open Access Article
Enhancing lithium-ion conductivity: impact of hausmannite nanofiller on PVDF–HFP/PEG blend nanocomposite polymer electrolytes
Khizar Hayat
Khan
 ab,
Aneesa
Zafar
a,
Haroon
Rashid
b,
Iftikhar
Ahmad
ac,
Gul Shahzada
Khan
d and
Hazrat
Hussain
*a
aDepartment of Chemistry, Quaid-i-Azam University Islamabad, Islamabad 45320, Pakistan. E-mail: hazrat.hussain@qau.edu.pk
bDepartment of Chemistry, Martin Luther University Halle-Wittenberg, 06120 Halle (Saale), Germany
cSustainable and Renewable Energy Engineering Department, University of Sharjah, P. O. Box 27272, Sharjah, United Arab Emirates
dDepartment of Chemistry, College of Science, University of Bahrain, Sakhir, 32038, Bahrain
First published on 14th November 2024
Abstract
A new series of PVDF–HFP/PEG-based nanocomposite polymer electrolytes (NCPEs) have been fabricated using hausmannite (Mn3O4) nanoparticles as the nanofiller and LiClO4 as the lithium-ion source via the solvent casting method. A pristine PVDF–HFP NCPE sample with 2 wt% nanofiller was also prepared for comparison. The Mn3O4 nanoparticles were synthesized by the precipitation method using CTAB as a templating agent and MnCl2·4H2O as the precursor. FTIR spectroscopy showed that while pristine PVDF–HFP forms a nonpolar α-phase, the incorporation of salt and nanofiller induced a mixed β and γ crystal phase, indicating interaction between the matrix and additives. Surface morphology studies showed that the NCPEs had a denser surface than pristine PVDF–HFP, with no PEG spherulite formation detected in polarized optical micrographs. Electrochemical impedance spectroscopy revealed that the 2% blend NCPE exhibited the highest ion conductivity of 3.1 × 10⁻⁴ S cm−1 at 80 °C, an order of magnitude higher than the pristine NCPE (5.1 × 10⁻⁵ S cm−1). Temperature-dependent ion conductivity followed Arrhenius behavior, indicating a thermally activated ion hopping mechanism. The dielectric relaxation peak shifted to higher frequency with increasing temperature, suggesting faster ion dynamics and improved conductivity.
Introduction
Lithium-ion batteries (LIBs) are widely used as a reliable power source in many portable electronic devices,1 electric vehicles,2 and in space applications,3 due to their lightweight, low cost, high-energy density and specific capacity.4 The commercial electrolytes employed in conventional LIBs are organic solvents that are highly volatile, flammable, and also associated with leakage issues.5 Moreover, lithium dendrites extending between the electrodes, could lead to short-circuiting.6 Polymers, as solid polymer electrolytes (SPEs), have been extensively investigated for the last several decades as safer alternatives to hazardous liquid electrolytes for LIBs.7 A number of polymers, including poly(ethylene oxide) (PEO),8,9 poly(vinylidenefluoride-co-hexafluoropropylene) (PVDF–HFP),10,11 poly(acrylonitrile) (PAN),12 poly(methyl methacrylate) etc.13 and various polymer blends, such as PVDF/PMMA,14 PEO/PEG-b-P(MA-POSS),9 PVDF/PEO-b-PMMA,15 and PEO/ PVDF–HFP,16etc. have been extensively explored as hosts in the fabrication of flexible SPEs.To enhance the film quality, salt dissociation, and ion conductivity, non-aqueous high dielectric constant liquids are sometimes incorporated as plasticizers into the SPE compositions.17,18 Other strategies that could be employed for improving ion conductivity and other electrochemical characteristics of the SPEs, include copolymerization,19,20 blending,21,22 network formation,23 use of branched copolymers24,25 and the addition of metal oxide nanoparticles, such as Al2O3,26 SiO2,27 and ZnO28etc. to the polymer matrix.13,29,30
PVDF–HFP has been more commonly investigated as a separator in LIBs. However, a few rare studies have also focused on PVDF–HFP as the host in SPEs and nanocomposite polymer electrolytes (NCPEs) with nanofiller dispersed in the PVDF–HFP matrix.31,32 As an example, Arwish et al.11 investigated the effect of graphene oxide (GO) nanofiller on structural, electrochemical and mechanical properties of the PVDF–HFP/Pluronic based NCPEs. The electrochemical and physical properties significantly improved with the dispersion of GO nanofiller to the PVDF/Pluronic matrix and ionic conductivity reaches 1.2 × 10⁻⁶ S cm−1 with 0.4 wt% GO addition (pristine PVDF/Pluronic SPE has an ionic conductivity of ≈0.73 × 10⁻⁶ S cm−1 at room temperature with 60 wt% Pluronic) with improved mechanical properties. Prabu et al.33 fabricated PVDF–HFP/CeO2/SIC (SIC – silicon carbide) NCPEs. The ac conductivity of the pristine PVDF–HFP (1.67 × 10⁻⁴ S cm−1) increased to 1.44 × 10⁻³ S cm−1 for 15% CeO2 and SIC filler.
Hausmannite (Mn3O4), a manganese oxide mineral (Mn2+ Mn3+2O4) is found as brownish black crystals or granular masses in contact metamorphic zones and high temperature hydrothermal veins.34 Mn3O4, with a spinel structured unit cell, has 24 cations of both trivalent and divalent forms of Mn and 32 oxygen atoms. The following structural characteristics are responsible for their intriguing physicochemical properties: (i) oxide ions are closely packed in cubic form, (ii) Mn2+ occupies the tetrahedral site, (iii) Mn3+ occupies the octahedral site, and (iv) the d4 state of the Mn(III) atoms in high spin configuration generates Jahn-Teller distortion.35 The metal oxide interacts with the polymer chains, provides a conduction pathway along the polymer matrix, decreases the crystallinity and improves the mechanical properties of the electrolyte membranes. Hausmannite nanofiller (Mn3O4) has wide ranging applications in energy storage devices, catalysis, electronics, and sensors.36
Here, we employ hausmannite (Mn3O4) NPs as the nanofiller in PVDF–HFP/PEG blend based NCPEs with LiClO4 as the source of lithium ions and with a composition of [85 wt% PVDF–HFP/15 wt% PEG/10 wt% LiClO4/x wt% Mn3O4], where x represents the weight percent of hausmannite NPs. For comparison purposes, a PVDF–HFP based pristine NCPE sample with 2 wt% nanofiller was also prepared and characterized. LiClO4 was chosen because it is highly soluble in various solvents and possesses high thermal stability and relatively low hydrophobicity. The large size of ClO4− anion helps in salt dissociation and reduces the crystallinity of the polymer host to facilitate lithium-ion transport.37 The main aim is to evaluate the effect of hausmannite nanofiller on the ion conductivity of PVDF–HFP/PEG blend based NCPEs. A detailed account of the structural, thermal, and electrical characterization has been presented.
Experimental
Materials
Poly(vinylidene fluoride-co-hexafluoropropylene) (PVDF–HFP, Mw = 400![[thin space (1/6-em)]](https://www.rsc.org/images/entities/char_2009.gif) 000 g mol−1, 99.99%), and poly(ethylene glycol) (PEG, Mw = 8000 g mol−1, 99%) were purchased from Sigma-Aldrich. Lithium perchlorate (LiClO4, 99.98%) was obtained from Analar. Manganese chloride (MnCl2·4H2O, 97%), tetrahydro furan (THF, 99%) and cetyltrimethylammonium bromide (CTAB, 99%) were obtained from Sigma-Aldrich. PVDF–HFP, PEG and LiClO4 were vacuum dried for 24 h at 50 °C before use.
000 g mol−1, 99.99%), and poly(ethylene glycol) (PEG, Mw = 8000 g mol−1, 99%) were purchased from Sigma-Aldrich. Lithium perchlorate (LiClO4, 99.98%) was obtained from Analar. Manganese chloride (MnCl2·4H2O, 97%), tetrahydro furan (THF, 99%) and cetyltrimethylammonium bromide (CTAB, 99%) were obtained from Sigma-Aldrich. PVDF–HFP, PEG and LiClO4 were vacuum dried for 24 h at 50 °C before use.
Preparation of hausmannite (Mn3O4) nanoparticles
Hausmannite nanoparticles (Mn3O4) were prepared at ambient temperature by employing the reported method.38 Typically, 0.23 M MnCl2·4H2O (4.551 g, 100 mL) was introduced to the 0.45 M (100 mL) sodium hydroxide (NaOH) aqueous solution. Then, CTAB (as the templating agent) (1.38 mM) was dispersed via moderate magnetic stirring for 24 h. The reaction mixture was filtered and the precipitate was washed several times with distilled water. The obtained product (brownish color) was dried at 80 °C for 24 h.Preparation of nanocomposite polymer electrolyte films
The preparation of PVDF–HFP/PEG blend film involves dissolving 0.425 mg of PVDF–HFP in 8 mL THF followed by the addition of 0.075 mg PEG and stirring for 24 h at 45 °C. The homogeneous solution was then cast on a Teflon Petri dish and dried at ambient temperature, followed by vacuum drying for 2–3 days at 45 °C. For the preparation of nanocomposite polymer electrolytes, additional steps of adding known amounts of salt (dissolved in THF) and nanofiller (dispersed in THF and sonicated) to the polymer solution were also involved. PVDF–HFP based pristine NCPE with 2 wt% nanofiller and PVDF–HFP/PEG based blend NCPEs of various compositions (with 2, 4, and 6 wt% Mn3O4 NPs) were prepared. The sample acronyms and their explanations are given in Table 1.| Sample ID | Compositiona |
|---|---|
| a The salt and filler were added with respect to the total weight of PVDF–HFP and PEG matrix. For example, in 2% blend NCPE, PVDF–HFP and PEG had an 85 and 15 wt% ratio, respectively. 10 wt% salt was added with respect to the total weight of the blend matrix (PVDF–HFP and PEG) and 2 wt% filler was added with respect to the total weight of the blend matrix (PVDF–HFP and PEG). | |
| PVDF–HFP | 100 wt% PVDF–HFP |
| PVDF–HFP/PEG | 85 wt% PVDF–HFP/15 wt% PEG |
| 2% Pristine NCPE | 85 wt% PVDF–HFP/10 wt% LiClO4/2 wt% Mn3O4 |
| 2% Blend NCPE | 85 wt% PVDF–HFP/15 wt% PEG/10 wt% LiClO4/2 wt% Mn3O4 |
| 4% Blend NCPE | 85 wt% PVDF–HFP/15 wt% PEG/10 wt% LiClO4/4 wt% Mn3O4 |
| 6% Blend NCPE | 85 wt% PVDF–HFP/15 wt% PEG/10 wt% LiClO4/6 wt% Mn3O4 |
Characterizations
FTIR spectra were recorded using a Bruker Tensor VERTEX 70 by KBr pellets at 4 cm−1 resolution and in the 400–4000 cm−1 range. X-ray diffraction (XRD) analysis was carried out on an X-ray Bruker diffractometer (Germany) in the range of 3 to 80° by diffraction of Cu Kα radiations at a scan rate of 5° minute−1. The average crystallite size was calculated using the Debye–Scherrer formula (eqn (1)).39,40 | (1) |
![[thin space (1/6-em)]](https://www.rsc.org/images/entities/char_2009.gif) mm min−1 with a pre-load of 0.1 N was employed. For the measurement, a sample with a total length of 20
mm min−1 with a pre-load of 0.1 N was employed. For the measurement, a sample with a total length of 20![[thin space (1/6-em)]](https://www.rsc.org/images/entities/char_2009.gif) mm, width of grip section of 6
mm, width of grip section of 6![[thin space (1/6-em)]](https://www.rsc.org/images/entities/char_2009.gif) mm, a width of 2.02
mm, a width of 2.02![[thin space (1/6-em)]](https://www.rsc.org/images/entities/char_2009.gif) mm, and a gauge length of 12
mm, and a gauge length of 12![[thin space (1/6-em)]](https://www.rsc.org/images/entities/char_2009.gif) mm was used.
mm was used.
Electrochemical impedance spectroscopy (EIS) was conducted by using a dielectric spectrometer (Broadband, Germany) employing a novo-control GmbH. A length gauge (MT25B) was used for measuring the film thickness. For EIS the electrolyte film was sandwiched between the gold-plated electrodes of diameter 20 mm and 100 μm separation distance. A frequency range of 10−2–107 Hz and 1 V potential was employed to monitor the current response. For the data acquisition, the sample was equilibrated for 20 min at 25 °C, followed by sample heating up to 80 °C under a nitrogen atmosphere in steps of 15–20 K difference.
Results and discussion
Hausmannite (Mn3O4) nanoparticles
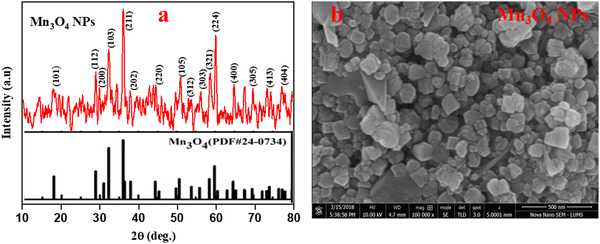
Hausmannite (Mn3O4) nanoparticles were prepared following the reported literature, employing CTAB as the templating agent and MnCl2·4H2O as the precursor.38 The XRD profile depicted in Fig. 1(a) shows that the prepared Mn3O4 is highly crystalline, with characteristic diffraction peaks, which agrees well with JCPDS Card No. 024-0734 with a tetragonal (Hausmannite) crystal structure.41 The average crystallite size of ∼30 nm was calculated from the diffraction peaks using the Debye–Scherrer approximation.42,43Fig. 1(b) depicts the SEM image of the prepared Mn3O4 NPs that reveals the cuboidal shape of the particles with some degree of agglomeration.44Water content of the prepared nanocomposite polymer electrolytes
PVDF–HFP-based pristine and PVDF–HFP/PEG blend based NCPEs with various filler content have been fabricated and characterized for their structural, electrochemical, and dielectric behaviors. However, before carrying out any structural or electrochemical studies, we quantified the water content of the prepared polymer electrolytes. Due to the hygroscopic nature of the lithium salts, there is always a possibility of water absorption by the electrolyte films. Water traces in polymer electrolytes cause various effects, e.g., the interaction between polymer matrix and water may solvate the polymer, which results in free lithium ions and likely contributes to increased ion mobility in the hydrated system.45 Additionally, water also acts as a plasticizer for polymers, thus decreasing the glass transition temperature (Tg) of the amorphous phase, reducing crystallinity, and enhancing the side chain mobility.46,47 Therefore, it is recommended to report the water content of the fabricated polymer electrolytes. As an example, Forsyth et al.48 calculated the water content in the PAN (poly(acrylonitrile)) based electrolyte and found that the electrolyte film with 35 wt% LiTf salt had a water content of 3%, whereas the film containing 65 wt% LiTf had a water content of 6%. They suggested that water entered the electrolyte film via the complexation of lithium salt with the polymer matrix. Karl Fischer titration was used in the current study to estimate the water content of the fabricated NCPE films. Karl Fischer titration is a fast method for reliably quantifying both free and bound water in the sample.49 The calculated water content of the prepared electrolyte films is in the range of 1% as given in Table 2.| Sample | Mass (mg) | Water content (%) |
|---|---|---|
| PVDF–HFP | 8.1 | 0.23 |
| PVDF–HFP/PEG | 13.3 | — |
| 2% Pristine NCPE | 11.4 | 0.42 |
| 2% Blend NCPE | 25.0 | 1.00 |
| 4% Blend NCPE | 30.0 | 1.20 |
| 6% Blend NCPE | 30.0 | 0.38 |
PVDF crystal phase and the effect of additives
PVDF is a polymorph that, based on chain conformation, self-assembles into five different crystal phases, namely, α, β, γ, δ, and ε. The most commonly observed α-phase is electro inactive with no net dipole moment in the unit cell due to antiparallel packing of dipoles, while the β and γ phases are electroactive.50 The higher content of the β and γ phase in the material is the subject of high interest for potential applications in various fields, including, sensing, electro optic devices, data storage, actuation, and energy harvesting.51 PVDF is a partially crystalline linear polymer with [–CH2–CF2–]n as the backbone. The structural repeat unit possess two dipoles, i.e., one is due to the CH2 while the other is due to the CF2 moiety.52 The PVDF crystal phase formation depends on the process employed in the sample preparation. PVDF chains generally self-assemble into a helical α-phase with a chain conformation of (TGTG) (T and G, respectively, stand for trans and gauche conformations) where chains pack into an antipolar unit cell.53 As depicted in Fig. 2, the FTIR spectrum of the prepared pristine PVDF–HFP film reveals the characteristic peaks of the α-phase at 531, 613, 761, 796, 853, 974, 1206, and 1383 cm−1.50,54 Furthermore, the peak at 872 cm−1 is due to the amorphous phase of PVDF due to the incorporation of HFP.55 The bands at 1383, 2923, 760, and 1401 cm−1 correspond to symmetric, asymmetric stretching, rocking, and deformation vibration of the CH2 group, respectively.56 The peaks at 1179 and 1147 cm−1 are assigned to symmetric and antisymmetric stretching of the CF2 group, respectively, while the peak at 613 cm−1 is due to CF2 bending and 794 cm−1 is due to CF3 stretching.57 Blending PVDF–HFP with PEG shifted some of the electro inactive nonpolar α-phase peaks to a more polar electroactive phase (γ-phase) along with the emergence of some new peaks due to PEG. Thus, the peak at 853 cm−1 shifted to 843 cm−1 due to a change in TGTG conformation to T3GT3G for the γ-phase.57 The intense peak observed at 1103 cm−1 in the PVDF–HFP/PEG blend is due to C–O–C bending.58 Thus, the FTIR spectrum confirms the formation of a mixed α and γ phase in the blend matrix.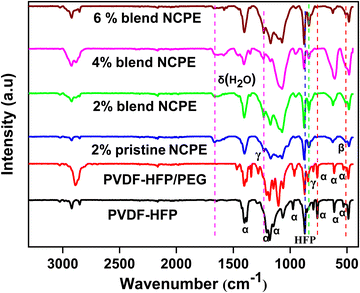 | ||
| Fig. 2 FTIR spectra of pristine PVDF–HFP, PVDF–HFP/PEG blend, pristine NCPE, and blend NCPEs with different concentrations of Mn3O4 NPs. | ||
The FTIR spectra of the pristine and blend NCPEs reveal the formation of mixed electroactive β and γ phases with no traces of the α-phase peaks. Thus, the peak appearing at 510 cm−1 is due to the β phase while the peaks at 831 and 1231 cm−1 are due to the formation of the γ phase of PVDF–HFP. This could be attributed to the ion-dipole and dipole–dipole interactions in the fabricated composite solid electrolytes50,59 Similar observation of phase shifting from the α to β and γ phase was also reported by Mallikarjun et al.60 and stated that mixed states reveal the fulfillment of the amorphous nature of the SPE.
The ion–dipole interaction of the C–O–C moiety of the PEG chain with salt in blend NCPEs is evident from the peak shift from ≈1103 cm−1 in the PVDF–HFP/PEG blend to ≈1070 cm−1 in blend NCPEs. Thus, in addition to acting as a plasticizer, PEG also interacts with Li+ cation, thus, assisting in salt dissociation and increasing the charge carrier concentration in the blend NCPEs. The peak at 624 cm−1 is due to free ClO−4 anions, indicating the dissolution of lithium salt in the polymer matrix.61 The peak observed at 1660 cm−1 is due to the bending mode of the adsorbed water molecule, due to the hygroscopic nature of LiClO4 salt.62
X-ray diffraction analysis
The structural characteristics of the fabricated films were investigated by X-ray diffraction (XRD). Fig. 3 depicts the XRD pattern of pristine PVDF–HFP, PVDF–HFP/PEG blend, and the respective NCPEs. For pristine PVDF–HFP, the XRD pattern reveals relative sharp crystalline peaks at ∼18.6°, ∼20.3°, ∼26.9°, and ∼38.9° along with a halo, which demonstrates the semicrystalline nature of PVDF–HFP.63,64 The sharp peaks correspond to the crystalline phase of PVDF–HFP due to VDF units while the halo is associated with the amorphous phase due to HFP moieties.65 The XRD patterns of α, β, and γ-phases exhibit an intense peak in the region ∼20° but only α and γ-phases display additional peaks close to ∼18°. Also, the XRD pattern of the α-phase also displays a relatively strong peak around 26°.54 However, due to the lower crystallinity of the copolymer and poorly resolved crystalline peaks, it is not usually possible to detect the correct crystal phase of the PVDF in PVDF–HFP from the XRD pattern, nevertheless, by taking clues from the FTIR spectrum of the pristine PVDF–HFP, we can safely suggest the α-phase for the pristine PVDF–HFP film.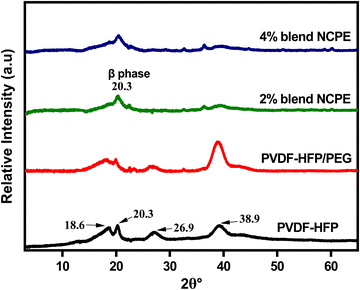 | ||
| Fig. 3 XRD patterns of pristine PVDF–HFP, PVDF–HFP/PEG blend and blend NCPEs with various concentrations of Mn3O4 NPs. | ||
Blending PEG with PVDF–HFP results in the broadening of the crystalline peaks; an indication of the decreased crystallinity of PVDF–HFP. The formation of the β-phase is evident from the appearance of a prominent peak at ∼20.3° in blend NCPEs, however, the presence of other small peaks does not rule out the existence of all three phases (α, β, and γ) in blend NCPEs. As discussed earlier, FTIR spectra also revealed the formation of mixed crystal phases for the respective samples. Additionally, no visible/distinguishable peak due to PEG could be detected in the XRD pattern of the PVDF–HFP/PEG blend and blend NCPEs that could be attributed to the uniform distribution of the PEG in the blend matrix. The absence of peaks due to undissociated LiClO4 in the XRD patterns of the NCPEs suggests the homogeneous dispersion of salt in the polymer matrix.66
DSC analysis
Pristine PVDF–HFP exhibits (Fig. 4) a strong endothermic peak at ∼142.1 °C, which is attributed to the melting temperature of the crystalline phase of PVDF–HFP. The incorporation of PEG in the matrix has only slightly affected (broadened and the peak maximum shifted to ∼140.7 °C) the melting peak of PVDF–HFP. The rather smaller effect could be attributed to phase segregation as is evident from the melting endotherm of the PEG at ∼60 °C in the DSC thermogram of the blend.67 For blend NCPEs, no PEG melting peak could be detected, which suggests a homogeneous dispersion of PEG in the blend NCPE matrix. There is a slight variation in melting temperature of the PVDF upon blending or in pristine NCPE, however, a subtle change in melting behavior could be seen for blend NCPEs. Here, the melting peak of the PVDF–HFP splits into two peaks. We can argue that the higher melting peak (Tm ∼ 151 °C) represents melting of the γ-phase crystals while the lower temperature melting peak (Tm ∼ 138 °C) could be associated with the melting of the α/β-crystalline phases. This further reinforces the FTIR and XRD data discussed above, which suggest the formation of mixed crystal phases in blend NCPEs. It is to be noted that γ-phase crystals melt at higher temperature as compared with α or β-crystalline phases (α and β crystalline phases have a similar melting temperature range).50 To calculate the % crystallinity of a semicrystalline polymer one needs the melting enthalpy of the respective polymer in 100% crystalline state.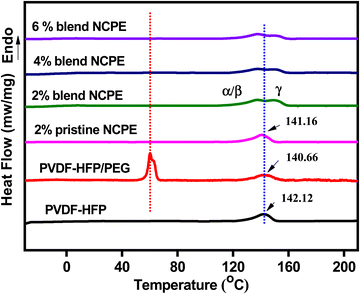 | ||
| Fig. 4 DSC thermograms of PVDF–HFP, PVDF–HFP/PEG blend, pristine NCPE and blend NCPEs with various concentrations of Mn3O4 NPs (2nd heating cycle). | ||
The PVDF in the PVDF–HFP copolymer can never be achieved in 100% crystalline state, therefore, % crystallinity cannot be calculated from the DSC data. However, we have qualitatively assessed the crystallinity of the PVDF–HFP in the fabricated samples by comparing the corresponding melting enthalpies ΔHm (mJ mg−1 of the PVDF–HFP) calculated from the respective melting peak areas as given in Table 3. There is a significant depression in melting enthalpy and hence crystallinity of the blend NCPEs as compared with the pristine PVDF–HFP or pristine NCPE. This could be attributed to the complex interaction pattern between PEG, additives: Mn3O4 NPs, and LiClO4, and PVDF–HFP that may offer a strong hinderance to the crystallization of PVDF–HFP chains.68
| Sample | T m (°C) (α, β) | T m (°C) (γ) | T c (°C) | ΔHm (mJ mg−1) |
|---|---|---|---|---|
| PVDF–HFP | 142.1 | — | 113.2 | 71 |
| PVDF–HFP/PEG | 140.7 | — | 110.8 | 48 |
| 2% Pristine NCPE | 141.2 | — | 115.0 | 64 |
| 2% Blend NCPE | 137.5 | 151.2 | 109.7 | 15 |
| 4% Blend NCPE | 137.8 | 151.3 | 108.0 | 30 |
| 6% Blend NCPE | 138.4 | 151.6 | 111.0 | 25 |
The minimum melting enthalpy and hence crystallinity was calculated for 2% blend NCPE. Further increase in the filler content seems to have the opposite effect on crystallinity. Increasing the filler content above the optimum level leads to their self-aggregation in the matrix, thus leaving the polymer chains unaffected and they can self-organize more efficiently and hence increase crystallinity.
Thermal gravimetric analysis
Thermal gravimetric analysis (TGA) was carried out under N2 atmosphere to assess the thermal stability of the prepared NCPEs, and the data are depicted in Fig. 5. Pristine PVDF–HFP initiates degradation at ∼480 °C and follows a single step degradation process. PVDF–HFP decomposes due to chain scission reactions, and inter-chain and intra-chain molecular transfer reactions.69 The PVDF–HFP/PEG blend degrades in two steps, i.e., the first degradation step at 350 °C is due to the decomposition of PEG,70 with almost 21% mass loss while the second step is due to the degradation of the PVDF–HFP at 410 °C. Three steps of degradation could be seen for the pristine and blend NCPEs. The 1st step of degradation occurs at ∼400 °C which is due to PEG degradation while the 2nd (Td2) and 3rd (Td3) decomposition steps observed at ∼550 °C and ∼590 °C are due to the PVDF–HFP chains and PVDF–HFP-salt complex, respectively. It is to be noted that both the pristine and blend NCPEs reveal weight loss at ∼400 °C, thus, one could argue that the weight loss at ∼400 °C could be associated with the degradation of both the LiClO471 and PEG. It is observed that PVDF–HFP in both the pristine and blend NCPEs exhibits higher thermal stability as compared to the pristine PVDF–HFP and PVDF–HFP/PEG blend.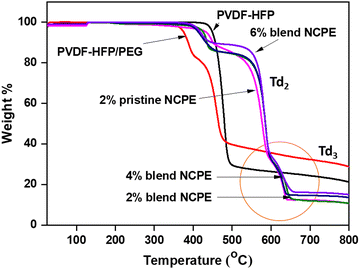 | ||
| Fig. 5 TGA thermograms of PVDF–HFP, PVDF–HFP/PEG blend, 2% pristine NCPE and blend NCPEs with various concentrations of Mn3O4 NPs. | ||
This suggests that the inert filler (Mn3O4) enhances the thermal stability of the fabricated NCPEs. A minor, sudden weight increase (<1%) is observed in the TGA curves (Fig. 5) for certain samples within the temperature range of ∼130 °C to 140 °C. Normally, the weight of a sample decreases as the temperature rises, due to the degradation of the material into gaseous products. However, in some cases, a weight gain can occur during TGA analysis. This phenomenon can have several potential causes, such as oxidation (reaction with oxygen), gas adsorption by porous materials (e.g., activated carbon), or instrumental artifacts.72–74 In our case, oxidation can be ruled out, as the TGA analysis was conducted under a nitrogen atmosphere. Additionally, nitrogen adsorption is unlikely since the sample is not porous. Therefore, the small and sudden weight increase observed in the TGA curves for some samples is most likely due to an instrumental artifact. Importantly, this effect is minimal and does not impact the overall thermal behavior or interpretation of the results. It is to be noted that for all the fabricated NCPEs no significant weight loss could be observed up to 400 °C, which ensures their safe practical application under thermally challenging conditions.
Surface morphology and composition
To find the effect of hausmannite NPs on surface morphology and distribution in the prepared electrolytes, FESEM and EDS analyses were performed. The SEM images shown in Fig. 6, reveal a more compact and smoother surface for pristine PVDF–HFP film as compared with the PVDF–HFP/PEG blend or the NCPEs. The polarized optical micrograph (inset Fig. 6(b)) of the PVDF–HFP/PEG blend film did not reveal any spherulite formation by the PEG, suggesting that no PEG surface segregation takes place in the blend film.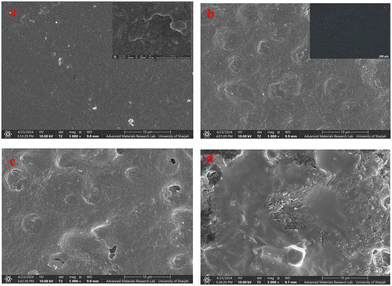 | ||
| Fig. 6 FESEM images of the (a) pristine PVDF–HFP, (b) PVDF–HFP/PEG blend (inset shows the POM micrograph of the PVDF–HFP/PEG blend), (c) 2% pristine NCPE and (d) 2% blend NCPE. | ||
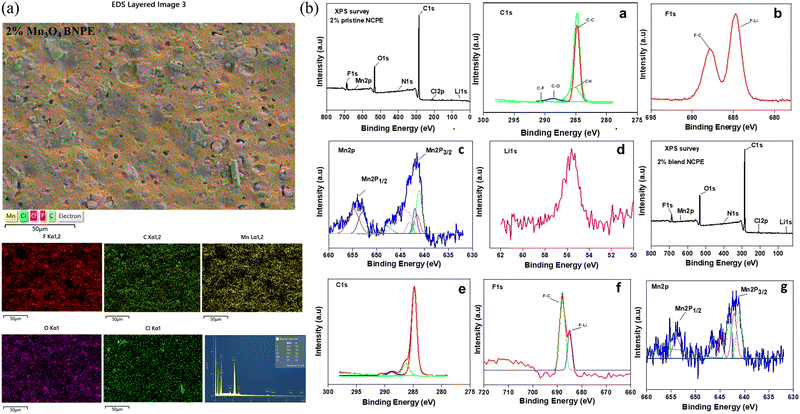
Fig. 7(a) depicts the EDS analysis of the distribution of various elements for the 2% blend NCPE exhibiting a uniform distribution of Mn (from nanofiller), Cl (from salt), O (from PEG and salt), and F (from PVDF–HFP) in the polymer matrix.
To further validate the composition and the presence of filler in the composite samples, XPS analysis was carried out. As shown in Fig. 7(b), the XPS survey of 2% pristine NCPE shows their composition, validating the presence of Mn filler. The core shell spectrum of C(1s) peak deconvolution shows two dominant peaks observed at 284.2 eV and 292.1 eV for C–C and C–F respectively, related to the PVDF–HFP polymer matrix.75 The XPS analysis of F(1s) shows two peaks occurring at 653 eV and 642 eV, related to the F–C and F–Li.76 This shows the interaction of Li+ with the polymer matrix. The binding energy of Li(1s) is 56.1 eV whereas Cl(2p) is 208.6 eV, both related to LiClO4 salt. The core shell deconvoluted spectrum for Mn(2p) is also shown in Fig. 7b(c), with two distinct peaks observed at 641 eV and 653 eV for Mn(2p)3/2 and Mn(2p)1/2 respectively, related to Mn3O4 filler.77Fig. 7b also displays the XPS survey of 2% blend NCPE, along with the core shell spectrum of C(1s), F(1s) and Mn(2p) (Fig. 7b(e–g). The binding energy of C(1s) in the 2% blend NCPE is 285.14 eV. The binding energies related to O(1s) and O(2s), respectively, are 532.7 and 25.7 eV in the 2% blend NCPE. The F(1s) and F(2s) have binding energies, respectively, of 688.0 and 27.33 eV. As shown in Fig. 7(b) and (f), the F–Li peak is intense in the 2% pristine NCPE as compared to the 2% blend NCPE. This suggests that Li+ in pristine NCPE interacts only with the F atom of the matrix whereas in the blend NCPE, the Li+ interaction occurs with both components of the matrix i.e. F of the PVDF–HFP and O of the PEG.
Tensile properties
The stress–strain curves were recorded to examine the tensile behavior of the fabricated films as shown in Fig. 8. The stress–strain curve displays two distinct regions; an initial linear region depicting the elastic behaviors, followed by the non-linear region representing the nonreversible plastic deformation region.11,78 As shown in Fig. 8, the stress–strain curve of the pristine PVDF–HFP and PVDF–HFP/PEG blend shows a sharp linear increase in stress (elastic region), reaching a maximum value followed by the irreversible strain deformation and breaking at a much lower strain value. The tensile strength data of the fabricated films are shown in Table 4.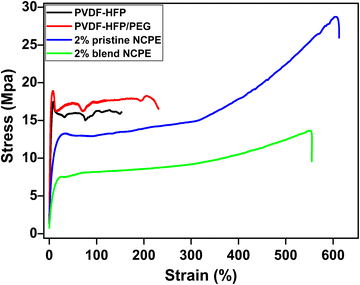 | ||
| Fig. 8 Typical stress–strain curves of the pristine PVDF–HFP, PVDF–HFP/PEG blend, 2% pristine and 2% blend NCPE. | ||
| Sample ID | Tensile strength (MPa) |
|---|---|
| PVDF–HFP | 16.2 |
| PVDF–HFP/PEG | 18.9 |
| 2% pristine NCPE | 28.7 |
| 2% blend NCPE | 13.6 |
This indicates the brittle nature of the neat PVDF–HFP and PVDF–HFP/PEG blend films. The NCPEs possess more ductile behavior as evident from the significantly higher elongation at break value as compared to pristine PVDF–HFP and the PVDF–HFP/PEG blend. The ductile behavior and excellent flexibility of the 2% blend NCPE are advantageous for better electrode/electrolyte interfacial content in lithium ion batteries.79
Electrochemical impedance spectroscopy
Electrochemical impedance spectroscopy (EIS) was employed to determine the ion conductivity of the fabricated films in the temperature range 25 °C ≤ T ≤ 80 °C.Fig. 9(a) shows the log–log plot of σ′(ω) and frequency for the 2% blend NCPE, measured at various temperatures. As shown in Fig. 9(a), the log–log plot consists of three regions: (i) the low-frequency region below the plateau is due to the electrode polarization, (ii) the higher frequency region which is above the plateau is called the ac conductivity or universal dielectric response, and (iii) the frequency independent plateau region. The dc conductivity (σo) is extracted from the plateau in the log–log plot by applying the so-called Dyre fitting function (eqn (2)).80
 | (2) |
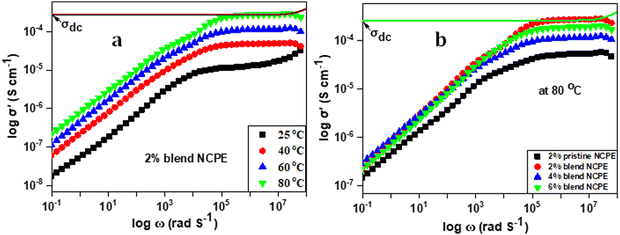 | ||
| Fig. 9 Log–log plot of (a) the 2% blend NCPE, measured at various temperatures and (b) the 2% pristine NCPE and blend NCPEs measured at 80 °C. | ||
| Sample ID | E a (eV) | σ dc (S cm−1, 80 °C) | τ(s) |
|---|---|---|---|
| PVDF–HFP | — | — | — |
| PVDF–HFP/PEG | — | — | — |
| 2% Pristine NCPE | 0.23 | 5.1 × 10⁻⁵ | 5.93 × 10⁻⁸ |
| 2% Blend NCPE | 0.16 | 3.1 × 10⁻⁴ | 5.24 × 10⁻⁸ |
| 4% Blend NCPE | 0.24 | 1.12 × 10⁻⁴ | 6.32 × 10⁻⁸ |
| 6% Blend NCPE | 0.27 | 1.85 × 10⁻⁴ | 6.55 × 10⁻⁸ |
It is evident from Fig. 9(a) that the dc conductivity increases with increasing temperature as manifested by the shifting of the plateau along the y-axis with increasing temperature. The maximum ion conductivity was calculated to be 3.1 × 10⁻⁴ S cm−1 at 80 °C. This could be attributed to faster segmental mobility and faster ion dynamics at higher temperatures. Fig. 9(b) and Table 5 reveal that 2% blend NCPE displays the maximum ion conductivity which decreases with further increase in filler content. For NCPEs, there is always an optimum filler concentration above which the ion conductivity deteriorates and this trend is attributed to the filler aggregation above the optimum concentration.8,11 The aggregates block the conduction pathways of the ions that result in lowering ion conductivity. As discussed above for 4% and 6% blend NCPEs the DSC data revealed slightly higher crystallinity as compared with the 2% blend NCPE and that was attributed to the filler aggregation in the matrix.
The data also reveal a significantly higher ion conductivity for blend NCPE as compared with the pristine NCPE with the same composition (2% nanofiller). For example, ion conductivity was measured to be 5.1 × 10⁻⁵ S cm−1 for the 2% pristine NCPE, while for the 2% blend NCPE the value was found to be 3.1 × 10⁻⁴ S cm−1, which is an order of magnitude higher than that for the 2% pristine NCPE. As discussed above PEG has a dual role in blend NCPEs. It acts as a plasticizer that reduces the PVDF–HFP crystallinity and by interacting with lithium salt it facilitates its dissociation that in turn results in a higher charge carrier concentration. Furthermore, it is a better conductor of lithium ions as compared with the pristine PVDF–HFP. Thus, we can conclude that the blend PVDF–HFP/PEG matrix offers a more robust ion conducting environment as compared with the pristine PVDF–HFP based NCPE. There are many reports on the incorporation of metal oxides as a nanofiller in PVDF–HFP for improving the ion conductivity.81–83 Subramania et al.84 incorporated a ZrO2 nanofiller into PVDF–HFP based polymer electrolytes and electrochemical properties were analyzed at the optimum nanofiller content (8% ZrO2). Nidhi et al.85 fabricated PVDF–HFP based NCPEs by incorporating various ceramic oxide nanofillers, such as MgO, ZnO, TiO2, and Al2O3. The maximum ion conductivity of 1.25 × 10⁻⁵ S cm−1 was achieved for ZnO-based NCPEs at room temperature and the conductivity increased to 1.24 × 10⁻⁴ S cm−1 at 110 °C, which is relatively lower in comparison to blend NCPEs in the current work.
The Arrhenius equation (eqn (3)) was applied to find the temperature-dependent ion conductivity behavior of the fabricated pristine and blend NCPEs as depicted in Fig. 10.
 | (3) |
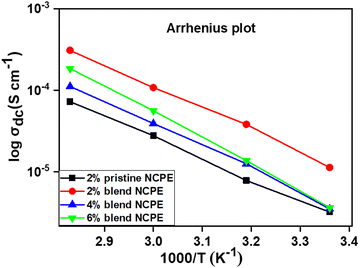 | ||
| Fig. 10 Temperature dependent Arrhenius plots of pristine NCPE and blend NCPEs with various concentrations of Mn3O4 NPs. | ||
The activation energy calculated from the respective slopes of the Arrhenius plots (Fig. 10) revealed the lowest value (0.16 eV) (Table 4) for the 2% blend NCPE among the investigated pristine and blend NCPEs, suggesting that the 2% blend NCPE matrix offers the smallest energy barrier to the ion mobility. This trend is in accordance with the ion conductivity behavior of this sample (Table 5). The exact mechanism of the ion diffusion in the blend matrix is still unclear, however, the interaction of lithium ion with PEG, and PVDF–HFP of the matrix is evident from the FTIR, XRD, and DSC data presented above. Furthermore, the temperature dependent ion conductivity follows the Arrhenius behavior. Thus, one can conclude the ion diffusion is a thermally activated process and follows the ion hopping mechanism with jumps from one coordinated site to another when voltage is applied. The presence of PEG in the matrix and the Lewis acid–base interaction between the Li+ ether oxygen of the PEG backbone offers additional ion conducting pathways in the blend matrix as compared with the pristine PVDF–HFP matrix.
Table 6 reveals the comparison of ion conductivity of some of the reported PVDF–HFP-based composite electrolytes with various nanofillers.
| Polymer matrix | Filler | Conductivity (S cm−1) | Ref. |
|---|---|---|---|
| PVDF–HFP | ZnO | 1.25 × 10⁻⁵ (room temp) | 85 |
| PVDF–HFP/Pluronic | GO | 1.2 × 10⁻⁶ (room temp) | 88 |
| PVDF–HFP/PEO | M-TiO2 | 7.21 × 10⁻⁴ (room temp) | 89 |
| PVDF–HFP | SiO2 | 7.1 × 10⁻⁴ (room temp) | 90 |
| PVDF–HFP | GO | 4.23 × 10⁻⁴ (room temp) | 91 |
| PVDF–HFP/PEG | Mn3O4 | 3.1 × 10⁻⁴ (80 °C) | This work |
Dielectric properties
The frequency and temperature-dependent dielectric behavior of the fabricated electrolytes were investigated to obtain insight into the ion transport phenomenon. Fig. 11(a) and (b) represent the dielectric constant (ε′) and dielectric loss (ε′′) as a function of frequency for the 2% blend NCPE measured at various temperatures. Both the ε′ and ε′′ sharply rise in the lower frequency regime followed with a flat tail in the higher frequency region. The lower frequency sharp increase is due to the space charge polarization phenomenon, which results from the accumulation of charge carriers at the electrode/electrolyte interface and indicates the non-Debye relaxation process.92,93 As shown in Fig. 11, both ε′ and ε′′ increase with an increase in temperature at a given frequency.94 At higher frequencies, the ions do not have enough time to align according to the direction of the electric field, hence no long range ion diffusion and accumulation takes place that results in lowering the value of both the dielectric constant and dielectric loss at higher frequencies.92,95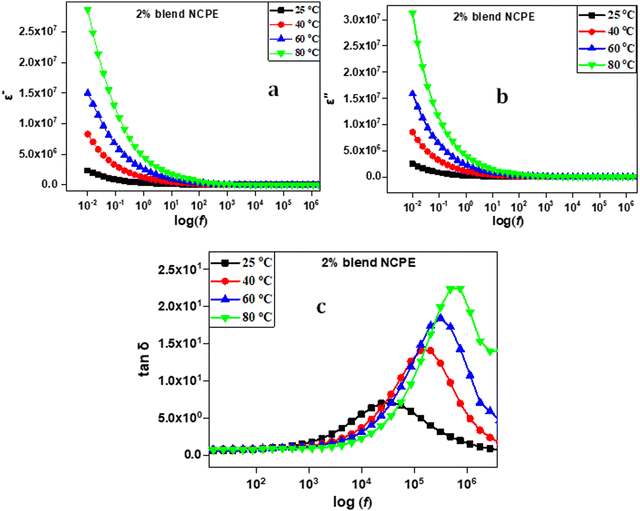 | ||
| Fig. 11 Dielectric data for the 2% blend NCPE representing frequency dependent (a) dielectric constant, (b) dielectric loss and (c) loss tangent at various temperatures. | ||
The loss tangent (tan![[thin space (1/6-em)]](https://www.rsc.org/images/entities/char_2009.gif) δ
δ![[thin space (1/6-em)]](https://www.rsc.org/images/entities/char_2009.gif) =
= ![[thin space (1/6-em)]](https://www.rsc.org/images/entities/char_2009.gif) ε′′/ε′) vs. frequency plot is also depicted in Fig. 11(c) for the 2% blend NCPE measured at various temperatures. The plots show a single dielectric relaxation peak. The relaxation peak shifts to higher frequency as the temperature increases. This finding could be attributed to the comparatively fast ion dynamics and chain segmental motion with increasing temperature that improves the ion conductivity upon heating.9
ε′′/ε′) vs. frequency plot is also depicted in Fig. 11(c) for the 2% blend NCPE measured at various temperatures. The plots show a single dielectric relaxation peak. The relaxation peak shifts to higher frequency as the temperature increases. This finding could be attributed to the comparatively fast ion dynamics and chain segmental motion with increasing temperature that improves the ion conductivity upon heating.9
Electric modulus
To further understand the ion dynamics process as a function of frequency and temperature, the dielectric data were transformed into an electric modulus formalism. The dielectric data in modulus formalism suppress the electrode polarization effect observed in the low-frequency region, therefore, any lower frequency relaxation phenomenon overlooked by the dielectric formalism can be evaluated.96,97 The complex modulus and permittivity are related by eqn (4): | (4) |
Therefore, it is useful to identify the long-range conduction processes and separate them from the localized dielectric relaxation processes by comparing the experimental data in the M* and ε* formalisms.
Fig. 12 represents the M′ and M′′ vs. frequency for the 2% blend NCPE measured at various temperatures. Both M′ and M′′ values reach zero at lower frequencies and sharply increase at higher frequencies.101 At lower frequencies, the formation of a long tail is assigned to electrode polarization that generates a large capacitance associated with the electrode/electrolyte interface and a high dielectric constant.102 At higher frequencies, the increased electric modulus value is attributed to the electrolyte bulk properties.102,103 The increase in M′′ in the higher frequency region is an indication of the conductivity relaxation process, however, the relaxation peak could not be detected as it seems to be beyond the frequency limits of the instrument.104,105
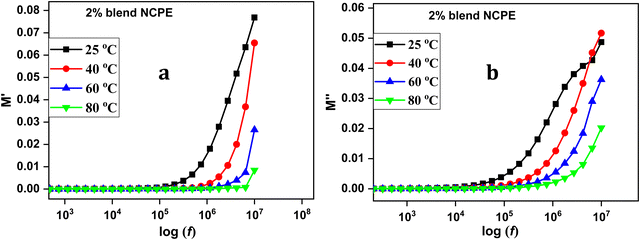 | ||
| Fig. 12 Electric modulus data (a) real part and (b) imaginary part of electric modulus of the 2% blend NCPE as a function of frequency at various temperatures. | ||
Role of PEG on the structural and electrochemical properties of the electrolyte membrane
PEG is a semicrystalline, thermoplastic polymer that can act as a plasticizer matrix when a lower molecular weight <10![[thin space (1/6-em)]](https://www.rsc.org/images/entities/char_2009.gif) 000 g mol−1 is used.106 A plasticizer reduces the intra and inter molecular interaction between the polymer chains, thus reducing the glass transition temperature and crystallinity of the polymer chains and hence the salt dissociation of the polymer matrix. Hence, PEG is regarded as the most efficient plasticizer for PVDF–HFP as it has good stability, dispersibility, and high mobility with large exclusion volumes and non-toxicity.107 In the present study, low molecular weight PEG was introduced to the PVDF–HFP matrix and various structural, morphological and electrochemical changes were observed. As shown in the FTIR data, adding PEG to the pristine PVDF–HFP matrix shifted some of the electro inactive nonpolar α-phase peaks to the polar electroactive phase. The higher content of β and γ phases in the material is the subject of high interest for potential applications in various fields, including sensing, electro optic devices, data storage, actuation, and energy harvesting.51 As shown from the DSC data, the melting temperature slightly decreased upon the addition of PEG to the PVDF–HFP matrix. In the PVDF–HFP/PEG matrix and blend NCPEs, the melting enthalpy decreased. This indicates an increase in amorphous content and decrease in crystallinity as compared with the pristine PVDF–HFP. It is suggested that PEG chains disrupt the inter PVDF–HFP chain interactions and hinder their crystallization to some extent. The EIS data also revealed a significantly higher ion conductivity for PEG based blend NCPE as compared with the pristine NCPE with the same composition (2% nanofiller). As discussed above PEG has a dual role in blend NCPEs. It acts as a plasticizer that reduces the PVDF–HFP crystallinity and by interacting with lithium salt it facilitates its dissociation that in turn results in higher charge carrier concentration and so higher ion conductivity. Furthermore, it is a better conductor of lithium ions as compared with the pristine PVDF–HFP. Thus, we can conclude that the blend PVDF–HFP/PEG matrix offers a more robust ion conducting environment as compared with the pristine PVDF–HFP based NCPE.
000 g mol−1 is used.106 A plasticizer reduces the intra and inter molecular interaction between the polymer chains, thus reducing the glass transition temperature and crystallinity of the polymer chains and hence the salt dissociation of the polymer matrix. Hence, PEG is regarded as the most efficient plasticizer for PVDF–HFP as it has good stability, dispersibility, and high mobility with large exclusion volumes and non-toxicity.107 In the present study, low molecular weight PEG was introduced to the PVDF–HFP matrix and various structural, morphological and electrochemical changes were observed. As shown in the FTIR data, adding PEG to the pristine PVDF–HFP matrix shifted some of the electro inactive nonpolar α-phase peaks to the polar electroactive phase. The higher content of β and γ phases in the material is the subject of high interest for potential applications in various fields, including sensing, electro optic devices, data storage, actuation, and energy harvesting.51 As shown from the DSC data, the melting temperature slightly decreased upon the addition of PEG to the PVDF–HFP matrix. In the PVDF–HFP/PEG matrix and blend NCPEs, the melting enthalpy decreased. This indicates an increase in amorphous content and decrease in crystallinity as compared with the pristine PVDF–HFP. It is suggested that PEG chains disrupt the inter PVDF–HFP chain interactions and hinder their crystallization to some extent. The EIS data also revealed a significantly higher ion conductivity for PEG based blend NCPE as compared with the pristine NCPE with the same composition (2% nanofiller). As discussed above PEG has a dual role in blend NCPEs. It acts as a plasticizer that reduces the PVDF–HFP crystallinity and by interacting with lithium salt it facilitates its dissociation that in turn results in higher charge carrier concentration and so higher ion conductivity. Furthermore, it is a better conductor of lithium ions as compared with the pristine PVDF–HFP. Thus, we can conclude that the blend PVDF–HFP/PEG matrix offers a more robust ion conducting environment as compared with the pristine PVDF–HFP based NCPE.
Conclusions
The fabrication and characterization of pristine PVDF–HFP and PVDF–HFP/PEG blend-based nanocomposite polymer electrolytes (NCPEs), namely (i) PVDF–HFP/LiClO4/2 wt% Mn3O4 and (ii) PVDF–HFP/PEG/LiClO4/x wt% Mn3O4, where x represents the weight percent of Mn3O4 nanofiller (ranging from 2 to 6%) has been carried out. FTIR spectroscopy confirmed the formation of a nonpolar α-crystal phase by pristine PVDF–HFP, which transformed into a mixed α and γ-phase in the PVDF–HFP/PEG blend. The α-crystal phase completely disappeared and was replaced by the β and γ crystal phase in NCPEs. This was attributed to strong interaction between the PVDF and the additives that forces the PVDF chains to pack into polar crystal phases. That was also substantiated by DSC analysis, where the melting peak of PVDF splits into two peaks corresponding to the melting of γ-phase crystals at higher temperature and β-phase crystals at lower temperature. Electrochemical impedance spectroscopy (EIS) revealed a maximum ion conductivity of 3.1 × 10⁻⁴ S cm−1 at 80 °C for the 2% blend NCPE, which is an order of magnitude higher as compared to 5.1 × 10⁻⁵ S cm−1 at 80 °C for the 2% pristine NCPE. The ion conductivity and activation energy data suggest that the PVDF–HFP/PEG blend matrix, due to the presence of PEG, offers more efficient conducting pathways for the transportation of ions as compared with the pristine PVDF–HFP matrix. The dielectric relaxation peak shifted to higher frequency (lower relaxation time) with increasing temperature, which is attributed to faster ion dynamics and conductivity with increasing temperature.Author contributions
KHK: conceptualization, investigation, formal analysis, methodology, writing – original draft; AZ: writing, formal analysis; HR: methodology, formal analysis; IA: investigation, methodology, formal analysis; GSK: methodology, investigation, formal analysis, HH: conceptualization, funding acquisition, supervision, writing – original draft.Data availability
The data that support the findings of this study are available from the corresponding author upon reasonable request.Conflicts of interest
The authors declare no competing financial interest.Acknowledgements
HH and KHK are thankful to Prof. Jörg Kressler, Department of Chemistry, Martin Luther University Halle-Wittenberg, Germany for allowing KHK to carryout sample characterization in his group. The authors would also like to thank Prof. Mario Beiner, Department of Physics, Martin Luther University Halle-Wittenberg, Germany for providing access to their Broadband Dielectric Spectrometer. The authors are also thankful to the Pakistan Council of Scientific and Industrial Research (PCSIR) for access to scientific instrumentation under the “Data Repository of Scientific Instrumentation” project.References
- B. Dunn, H. Kamath and J.-M. Tarascon, Science, 2011, 334, 928–935 CrossRef CAS PubMed.
- P. Yang and J.-M. Tarascon, Nat. Mater., 2012, 11, 560–563 CrossRef CAS PubMed.
- Y. Borthomieu, Lithium-ion batteries, Elsevier, 2014, 311–344 Search PubMed.
- J. Li, Z. Du, R. E. Ruther, S. J. An, L. A. David, K. Hays, M. Wood, N. D. Phillip, Y. Sheng and C. Mao, JOM, 2017, 69, 1484–1496 CrossRef CAS.
- J.-M. Tarascon and M. Armand, Nature, 2001, 414, 359–367 CrossRef CAS PubMed.
- X. Yang, X. Gao, C. Zhao, Q. Sun, Y. Zhao, K. Adair, J. Luo, X. Lin, J. Liang and H. Huang, Energy Storage Mater., 2020, 27, 198–204 CrossRef.
- J. W. Fergus, J. Power Sources, 2010, 195, 4554–4569 CrossRef CAS.
- K. H. Khan, Y. Golitsyn, D. Reichert, J. Kressler and H. Hussain, J. Phys. Chem. B, 2023, 127, 2066–2082 CrossRef CAS PubMed.
- K. H. Khan, M. H. Bilal, J. Kressler and H. Hussain, J. Mater. Sci., 2023, 58, 17557–17577 CrossRef CAS.
- I. Rani, S. Arwish, K. H. Khan, M. Zamurad, S. M. Shah and H. Hussain, J. Appl. Polym. Sci., 2024, e56331 CrossRef.
- S. Arwish, R. Manzoor, K. H. Khan, S. M. Shah, I. Ahmad and H. Hussain, Macromol. Chem. Phys., 2023, 224, 2300169 CrossRef CAS.
- S. W. Choi, J. R. Kim, S. M. Jo, W. S. Lee and Y.-R. Kim, J. Electrochem. Soc., 2005, 152, A989 CrossRef CAS.
- Z. Shen, Y. Cheng, S. Sun, X. Ke, L. Liu and Z. Shi, Carbon Energy, 2021, 3, 482–508 CrossRef CAS.
- H. Verma, K. Mishra and D. K. Rai, J. Electron. Mater., 2021, 51, 635–651 CrossRef.
- Q. Xiao, X. Wang, W. Li, Z. Li, T. Zhang and H. Zhang, J. Membr. Sci., 2009, 334, 117–122 CrossRef CAS.
- S. Das and A. Ghosh, J. Phys. Chem. B, 2017, 121, 5422–5432 CrossRef CAS PubMed.
- X. Ma, J. Yu, K. He and N. Wang, Macromol. Mater. Eng., 2007, 292, 503–510 CrossRef CAS.
- M. S. Michael, M. M. E. Jacob, S. R. S. Prabaharan and S. Radhakrishna, Solid State Ionics, 1997, 98, 167–174 CrossRef CAS.
- W.-S. Young and T. H. Epps III, Macromolecules, 2009, 42, 2672–2678 CrossRef CAS.
- W.-S. Young, J. N. L. Albert, A. B. Schantz and T. H. Epps III, Macromolecules, 2011, 44, 8116–8123 CrossRef CAS.
- D. Zhang, L. Zhang, K. Yang, H. Wang, C. Yu, D. Xu, B. Xu and L.-M. Wang, ACS Appl. Mater. Interfaces, 2017, 9, 36886–36896 CrossRef CAS PubMed.
- P. Pradeepa, S. Edwin, G. Sowmya, J. Kalaiselvimary and M. R. Prabhu, Mater. Sci. Eng., B, 2016, 205, 6–17 CrossRef CAS.
- N. Hasan, M. Pulst, M. H. Samiullah and J. Kressler, J. Polym. Sci., Part B: Polym. Phys., 2019, 57, 21–28 CrossRef CAS.
- T. Itoh, Y. Ichikawa, N. Hirata, T. Uno, M. Kubo and O. Yamamoto, Solid State Ionics, 2002, 150, 337–345 CrossRef CAS.
- Y. Matoba, Y. Ikeda and S. Kohjiya, Solid State Ionics, 2002, 147, 403–409 CrossRef CAS.
- E. M. Masoud, A.-A. El-Bellihi, W. A. Bayoumy and M. A. Mousa, J. Alloys Compd., 2013, 575, 223–228 CrossRef CAS.
- Y.-S. Lee, S. H. Ju, J.-H. Kim, S. S. Hwang, J.-M. Choi, Y.-K. Sun, H. Kim, B. Scrosati and D.-W. Kim, Electrochem. Commun., 2012, 17, 18–21 CrossRef CAS.
- E. R. Dyartanti, I. N. Widiasa, A. Purwanto and H. Susanto, Evergreen, 2018, 05, 19–25 CrossRef CAS.
- S.-J. Tan, X.-X. Zeng, Q. Ma, X.-W. Wu and Y.-G. Guo, Electrochem. Energy Rev., 2018, 1, 113–138 CrossRef CAS.
- S. Liu, W. Liu, D. Ba, Y. Zhao, Y. Ye, Y. Li and J. Liu, Adv. Mater., 2023, 35, 2110423 CrossRef CAS PubMed.
- K. Gohel, D. K. Kanchan, H. K. Machhi, S. S. Soni and C. Maheshwaran, Mater. Res. Express, 2020, 7, 25301 CrossRef CAS.
- G. Xi, M. Xiao, S. Wang, D. Han, Y. Li and Y. Meng, Adv. Funct. Mater., 2021, 31, 2007598 CrossRef CAS.
- V. Prabu, V. Gv, R. Jan, S. Parveen and P. K. Polym.-Plast., Technol. Mater., 2024, 1–14 Search PubMed.
- A. Baykal, H. Kavas, Z. Durmuş, M. Demir, S. Kazan, R. Topkaya and M. Toprak, Open Chem., 2010, 8, 633–638 CrossRef CAS.
- A. Sukhdev, M. Challa, L. Narayani, A. S. Manjunatha, P. R. Deepthi, J. V. Angadi, P. M. Kumar and M. Pasha, Heliyon, 2020, 6, 2405–8440 CrossRef PubMed.
- S. G. Sayyed, A. V. Shaikh, D. P. Dubal and H. M. Pathan, ES Energy Environ., 2021, 14, 3–21 CAS.
- K. Sashmitha and M. U. Rani, Polym. Bull., 2023, 80, 89–135 CrossRef CAS.
- B. G. S. Raj, A. M. Asiri, J. J. Wu and S. Anandan, J. Alloys Compd., 2015, 636, 234–240 CrossRef.
- A. K. Zak, W. H. A. Majid, M. E. Abrishami and R. Yousefi, Solid State Sci., 2011, 13, 251–256 CrossRef.
- K. Venkateswarlu, A. C. Bose and N. Rameshbabu, Phys. B, 2010, 405, 4256–4261 CrossRef CAS.
- D. N. Binjawhar, N. M. Al-Enazi, K. Alsamhary and M. Kha, Heliyon, 2024, 10, e27695 CrossRef CAS PubMed.
- P. Scherrer, Math. Klasse, 1918, 2, 98–100 Search PubMed.
- M. R. Shaik, R. Syed, S. F. Adil, M. Kuniyil, M. Khan, M. S. Alqahtani, J. P. Shaik, M. R. H. Siddiqui, A. Al-Warthan and M. A. F. Sharaf, Saudi J. Biol. Sci., 2021, 28, 1196–1202 CrossRef CAS PubMed.
- R. Tholkappiyan, A. N. Naveen, K. Vishista and F. Hamed, J. Taibah Univ. Sci., 2018, 12, 669–677 CrossRef.
- I. F. Hakem, J. Lal and M. R. Bockstaller, J. Polym. Sci., Part B: Polym. Phys., 2006, 44, 3642–3650 CrossRef CAS.
- C. S. Harris and T. G. Rukavina, Electrochim. Acta, 1995, 40, 2315–2320 CrossRef CAS.
- X. Zhang, L. Zhou, Y. Wang and Q. Zhou, Polym. Sci., Ser. A, 2018, 60, 50–56 CrossRef CAS.
- M. Forsyth, S. Jiazeng and D. R. Macfarlane, Electrochim. Acta, 2000, 45, 1249–1254 CrossRef CAS.
- S. K. MacLeod, Anal. Chem., 1991, 63, 557A–566A CAS.
- P. Martins, A. C. Lopes and S. Lanceros-Mendez, Prog. Polym. Sci., 2014, 39, 683–706 CrossRef CAS.
- E. Kabir, M. Khatun, L. Nasrin, M. J. Raihan and M. Rahman, J. Phys. D: Appl. Phys., 2017, 50, 163002 CrossRef.
- N. J. Ramer and K. A. Stiso, Polymer, 2005, 46, 10431–10436 CrossRef CAS.
- F. Bauer and R. A. Graham, Ferroelectrics, 1995, 171, 95–102 CrossRef CAS.
- A. C. Lopes, C. M. Costa, C. J. Tavares, I. C. Neves and S. Lanceros-Mendez, J. Phys. Chem. C, 2011, 115, 18076–18082 CrossRef CAS.
- P. S. Kumar, A. Sakunthala, M. V. Reddy and M. Prabu, Solid State Ionics, 2018, 319, 256–265 CrossRef.
- G. A. Guirgis, Y. E. Nashed and J. R. Durig, J. Mol. Struct., 1999, 510, 13–34 CrossRef CAS.
- Shalu, S. K. Chaurasia, R. K. Singh and S. Chandra, J. Phys. Chem. B, 2013, 117, 897–906 CrossRef CAS PubMed.
- S. Sundararajan, A. B. Samui and P. S. Kulkarni, Sol. Energy, 2017, 144, 32–39 CrossRef CAS.
- C. J. Tavares, I. C. Neves and S. Lanceros-Mendez, Ana Catarina Teixeira Castro Lopes, 2013, 1001, 111 Search PubMed.
- A. Mallikarjun, J. S. Kumar, T. Sreekanth, M. Sangeetha, M. R. Mettu, P. A. Kumar and M. J. Reddy, Mater. Today Proc., 2023, 39, 755 CAS.
- J. Stygar, G. Żukowska and W. Wieczorek, Solid State Ionics, 2005, 176, 2645–2652 CrossRef CAS.
- L. N. Sim, S. R. Majid and A. K. Arof, Solid State Ionics, 2012, 209, 15–23 CrossRef.
- S. Abbrent, J. Plestil, D. Hlavata, J. Lindgren, J. Tegenfeldt and Å. Wendsjö, Polymer, 2001, 42, 1407–1416 CrossRef CAS.
- J.-H. Cao, B.-K. Zhu and Y.-Y. Xu, J. Membr. Sci., 2006, 281, 446–453 CrossRef CAS.
- V. K. Singh and R. K. Singh, J. Mater. Chem. C, 2015, 3, 7305–7318 RSC.
- X. Tang, R. Muchakayala, S. Song, Z. Zhang and A. R. Polu, J. Ind. Eng. Chem., 2016, 37, 67–74 CrossRef CAS.
- T. Eriksson, J. Mindemark, M. Yue and D. Brandell, Electrochim. Acta, 2019, 300, 489–496 CrossRef CAS.
- A. Manuel Stephan, K. S. Nahm, M. Anbu Kulandainathan, G. Ravi and J. Wilson, J. Appl. Electrochem., 2006, 36, 1091–1097 CrossRef CAS.
- S. Ramesh, C.-W. Liew and K. Ramesh, J. Non-Cryst. Solids, 2011, 357, 2132–2138 CrossRef CAS.
- N. S. Vrandečić, M. Erceg, M. Jakić and I. Klarić, Thermochim. Acta, 2010, 498, 71–80 CrossRef.
- M. M. Markowitz, D. A. Boryta and H. Stewart Jr, Ind. Eng. Chem. Prod. Res. Dev., 1964, 3, 321–330 CAS.
- S. Samih and J. Chaouki, AIChE J., 2015, 61, 84–89 CrossRef CAS.
- H. Zhao, D. Zhu, K. S. Chaudri, S. Qiu, W. Tian and G. Su, Prog. Nucl. Energy, 2014, 71, 152–159 CrossRef CAS.
- S. V. Ushakov, S. Hayun, W. Gong and A. Navrotsky, Materials, 2020, 13, 3141 CrossRef CAS PubMed.
- S. Subianto, N. R. Choudhury and N. Dutta, Nanomaterials, 2014, 4, 1–18 CrossRef PubMed.
- Y. Zeng, L. Zhao, J. Zhang, Q. Li, D. Sun, Y. Ren, Y. Tang, G. Jin and H. Wang, Small Sci., 2023, 2300017, 1–10 Search PubMed.
- Y. Zhou, L. Guo, X. Zou and B. Xiang, Materials, 2018, 6, 881 CrossRef PubMed.
- N. Angulakshmi, S. Thomas, K. S. Nahm, M. M. Stephan and N. N. Elizabeth, Ionics, 2011, 17, 407–414 CrossRef CAS.
- Y. J. Wang and D. Kim, J. Membr. Sci., 2008, 312, 76–83 CrossRef CAS.
- J. C. Dyre, J. Appl. Phys., 1988, 64, 2456–2468 CrossRef.
- H. Li, L. Li, S. Zheng, X. Wang and Z. Ma, Materials, 2019, 12, 2813 CrossRef CAS PubMed.
- G. Vijayakumar, S. N. Karthick and A. Subramania, Int. J. Electrochem., 2011, 2011, 926383 Search PubMed.
- H. Huang and S. L. Wunder, J. Electrochem. Soc., 2001, 148, A279 CrossRef CAS.
- A. Subramania, N. T. K. Sundaram, A. R. S. Priya and G. V. Kumar, J. Membr. Sci., 2007, 294, 8–15 CrossRef CAS.
- N. Nidhi, S. Patel and R. Kumar, in AIP Conference Proceedings, AIP Conf. Proc., 2020, 2220, 0800441–0800446.
- K. M. Diederichsen, H. G. Buss and B. D. McCloskey, Macromolecules, 2017, 50, 3831–3840 CrossRef CAS.
- L. M. Carvalho, P. Guégan, H. Cheradame and A. S. Gomes, Eur. Polym. J., 2000, 36, 401–409 CrossRef CAS.
- S. Arwish, R. Manzoor, K. H. Khan, S. M. Shah, I. Ahmad and H. Hussain, Macromol. Chem. Phys., 2023, 224, 1–12 CrossRef.
- K. Prabakaran, S. Mohanty and S. K. Nayak, RSC Adv., 2015, 5, 40491–40504 RSC.
- A. Das, A. Melepurakkal, P. Sreeram, K. T. Gireesh, N. T. M. Balakrishnan, M. J. J. Fatima, A. Pullanchiyodan, J.-H. Ahn, M. V. Shelke and P. Raghavan, J. Energy Storage, 2023, 73, 109026 CrossRef.
- A. L. Ahmad, U. R. Farooqui and N. A. Hamid, Polymer, 2018, 142, 330–336 CrossRef CAS.
- S. A. Hashmi, A. K. Thakur and H. M. Upadhyaya, Eur. Polym. J., 1998, 34, 1277–1282 CrossRef CAS.
- I. M. Hodge, M. D. Ingram and A. R. West, J. Electroanal. Chem. Interfacial Electrochem., 1976, 74, 125–143 CrossRef CAS.
- M. N. Chai and M. I. N. Isa, J. Curr. Eng. Res., 2011, 1, 23–27 Search PubMed.
- N. Vijaya, S. Selvasekarapandian, G. Hirankumar, S. Karthikeyan, H. Nithya, C. S. Ramya and M. Prabu, Ionics, 2012, 18, 91–99 CrossRef CAS.
- F. S. Howell, R. A. Bose, P. B. Macedo and C. T. Moynihan, J. Phys. Chem., 1974, 78, 639–648 CrossRef CAS.
- I. M. Hodge, K. L. Ngai and C. T. Moynihan, J. Non-Cryst. Solids, 2005, 351, 104–115 CrossRef CAS.
- P. Jeevanandam and S. Vasudevan, J. Chem. Phys., 1998, 109, 8109–8117 CrossRef CAS.
- Z. Wang, W. Zhou, L. Dong, X. Sui, H. Cai, J. Zuo and Q. Chen, J. Alloys Compd., 2016, 682, 738–745 CrossRef CAS.
- E. Neagu, P. Pissis, L. Apekis and J. L. G. Ribelles, J. Phys. D: Appl. Phys., 1997, 30, 1551 CrossRef CAS.
- S. Ibrahim, S. M. M. Yasin, N. M. Nee, R. Ahmad and M. R. Johan, Solid State Commun., 2012, 152, 426–434 CrossRef CAS.
- N. Tripathi, A. Shukla, A. K. Thakur and D. T. Marx, Polym. Eng. Sci., 2020, 60, 297–305 CrossRef CAS.
- D. K. Pradhan, R. N. P. Choudhary and B. K. Samantaray, Mater. Chem. Phys., 2009, 115, 557–561 CrossRef CAS.
- S. Lanfredi, P. S. Saia, R. Lebullenger and A. C. Hernandes, Solid State Ionics, 2002, 146, 329–339 CrossRef CAS.
- F. Bordi, C. Cametti and R. H. Colby, J. Condens. Matter Phys., 2004, 16, R1423 CrossRef CAS.
- H. Shin, S. Thanakkasaranee, K. Sadeghi and J. Seo, Food Packag. Shelf Life, 2022, 34, 100966 CrossRef CAS.
- R. J. Sengwa, P. Dhatarwal and S. Choudhary, Electrochim. Acta, 2014, 142, 359–370 CrossRef CAS.
| This journal is © The Royal Society of Chemistry 2024 |

