 Open Access Article
Enhancing thermometric precision: modulating the temperature of maximum sensitivity via erbium dopant addition in Ba2GdV3O11:Tm3+/Yb3+ nano phosphors†
Ikhlas
Kachou
a,
Kamel
Saidi
 a,
Christian
Hernández-Álvarez
b,
Mohamed
Dammak
 *a and
Inocencio R.
Martín
 b
b
aLaboratoire de Physique Appliquée, Groupe des Matériaux Luminescents, Faculté des Sciences de Sfax, Département de Physique, Université de Sfax, BP 1171 Sfax, Tunisia. E-mail: madidammak@yahoo.fr; mohamed.dammak@fss.usf.tn
bUniversidad de La Laguna, Departamento de Física, MALTA-Consolider Team and IMN. Apdo. Correos 456, E-38206, San Cristóbal de La Laguna, Santa Cruz de Tenerife, Spain
First published on 3rd October 2024
Abstract
Developing luminescence sensors often prioritizes maximizing relative sensitivity to achieve optimal performance. However, a critical parameter often overlooked is the temperature at which maximum sensitivity occurs. In this study, we delve into this crucial aspect by exploring the impact of erbium doping in Tm3+/Yb3+ co-doped Ba2GdV3O11 nano phosphors. The crystal structure, microscopic morphology, and luminescence mechanism of BGVO:Yb3+/Tm3+ and Er3+/Tm3+/Yb3+ up conversion nanoparticles, as well as the temperature sensing characteristics are investigated. Under 975 nm laser excitation, the BGVO:Yb3+/Tm3+ and BGVO:Er3+/Tm3+/Yb3+ nano phosphors exhibited strong blue and green upconversion luminescence, respectively. The luminescence intensity ratio (LIR) approach was used to analyze the temperature-dependent luminescence spectra in the 300–600 K temperature range. The thermometry strategies were based on thermally coupled energy levels (TCLs) and non-thermally coupled energy levels (NTCLs) of Er3+ and Tm3+ for temperature sensing performance. In the Tm3+/Yb3+ codoped samples, the relative sensitivity typically peaks around 350 K, attributed to TCLs (1.7% K−1, 700 nm/800 nm) with generally lower relative sensitivity compared to non-TCLs (5.39% K−1, 700 nm/475 nm). However, non-TCL sensitivities in the 300–600 K range lack a clear maximum. In contrast, Er3+/Tm3+/Yb3+ samples exhibit distinct maxima in non-TCL sensitivities within this temperature range (1.91% K−1, 700 nm/550 nm), offering precise temperature determination for specific applications. Our findings underscore the potential of erbium doping to modulate temperature sensitivity peaks, crucial for optimizing performance in tailored luminescence nanosensors and offering fresh concepts for investigating alternative superior optical temperature sensing nano materials.
Introduction
Temperature is a fundamental parameter in thermodynamics, essential for scientific inquiry, climatology, industrial production, and routine tasks. However, traditional temperature sensors often face limitations due to susceptibility to electromagnetic interference and potential errors from component heating.1–5 Consequently, the development of non-contact temperature detection methods, such as fluorescence thermometry, has gained momentum.6 A key spectral characteristic utilized in fluorescence thermometry is the luminescence intensity ratio (LIR), which undergoes changes with temperature variations.7–10 LIR thermometry, also known as self-referencing radiometric thermometry, reduces reliance on external factors like excitation intensity fluctuations or electromagnetic interference.11 Luminescence nano thermometry predominantly employs optical sensors based on Ln3+ ions due to their advantageous properties.12 These sensors commonly utilize radiometric techniques, particularly assessing band intensity ratios.7,13,14 While ions like Er3+, Tm3+, and Nd3+ are frequently utilized due to their thermally coupled levels (TCLs), their relative sensitivity (Sr) to temperature is limited to specific energy differentials between TCLs, resulting in relatively low Sr values. To address this limitation, recent research has focused on utilizing band intensities from nonthermally coupled levels (non-TCLs) of different Ln3+ ions, offering theoretically limitless temperature sensitivity.7,13,14Luminescent nanothermometers use a wide range of materials, including inorganic fluorides, phosphates, vanadate doped with optically active d-block metal ions, and lanthanide ions, along with carbon dots and quantum dots.8,15,16 These matrices offer strong photoluminescence signals and can be employed to create highly efficient phosphors due to their low phonon energies and thermal stability. Lanthanide-based inorganic compounds, including nanoparticles (NPs), possess a multitude of advantageous characteristics, such as broad-range emission induced by UV, visible, or NIR irradiation, long luminescence lifetimes, narrow emission bands, large spectral shifts, stability in the (+3) oxidation state, resistance to photobleaching, and high-temperature treatment.17–19 These advantageous characteristics are primarily attributed to several factors: the forbidden nature of 4f–4f transitions in Ln3+ ions, crystal-field effects, and the shielding of 4f electrons by 5s and 5p electrons.20 Moreover, lanthanide ions (Ln3+) exhibit up conversion (UC) luminescence, which involves the emission of higher-energy photons due to multiphoton absorption of lower-energy radiation, typically in the NIR range.21,22 Lanthanide ions serve as both luminescence activators (e.g., Eu3+, Tb3+, Nd3+, Er3+, and Tm3+) and sensitizers (mostly Ce3+ and Yb3+) due to their advantageous spectroscopic characteristics, including long luminescence lifetimes, wide range of emission states, large Stokes shift, and the capacity for upconversion.23 Upconverting nanomaterials find applications in biological sensing, particularly for subcutaneous sensing, owing to their small size and the use of NIR laser excitation to avoid damaging UV radiation.24
This study investigates the influence of erbium (Er3+) doping in Tm3+/Yb3+ codoped Ba2GdV3O11 (BGVO) nano phosphors, focusing on its impact on luminescence and thermometric properties. While maximizing relative sensitivity is a primary goal in luminescence-based temperature sensing, the temperature at which maximum sensitivity occurs and the temperature uncertainty are equally crucial but often overlooked. By incorporating erbium ions as a third dopant alongside Tm3+ and Yb3+ ions, the study reveals insights into how this addition can significantly affect luminescence and thermometric properties.
We present here the inorganic nano phosphors BGVO:Yb3+/Tm3+ and tridoped Er3+/Tm3+/Yb3+, which were created for temperature sensing and exhibit strong, perceptible UC luminescence (λex = 975 nm). The produced nanomaterial exhibits both phonon-assisted emission from ytterbium ions (above ≈900 nm) and UC luminescence from thulium ions. The material's luminescence characteristics were examined in the 400–960 nm range, which includes the first biological window. The relative sensitivities and temperature resolutions for the produced nanomaterial were determined using the band intensity ratios of the emission bands of Yb3+, Er3+, and Tm3+ ions situated in that wide spectrum range.
Synthesis procedure
Synthesis of BaGdV3O11 doped Yb3+, Tm3+ and Er3+
The Ba2GdV3O11 structures doped with 2%Er3+, 1%Tm3+ and 15%Yb3+ were synthesized using the Pechini sol–gel technique. Nano phosphors are prepared by acquiring multiple chemicals, including barium nitrate [Ba(NO3)2 (99.0%)], gadolinium nitrate hexahydrate [Gd(NO3)3·6H2O (99.9%)], erbium nitrate pentahydrate [(Er(NO3)3·5H2O) (99.9%)], thulium nitrate pentahydrate [Tm(NO3)3·5H2O (99.9%)], ytterbium nitrate pentahydrate [Yb(NO3)3·5H2O (99.9%)], ammonium metavanadate [NH4VO3 (99.96%)] and citric acid [C6H8O7 (99.0%)]. To initiate the process, all the precursors are placed into an Erlenmeyer flask and stirred using a magnetic stirrer at 70 °C. Following that, citric acid is introduced, causing the solution to transition from green to blue in color. The mixture is gently swirled and then heated to 80 degrees Celsius until it undergoes hydrolysis, transforming into a sol, and ultimately forming a gel. Subsequently, the gel is subjected to calcination through annealing at 700 °C. The final product is further ground for additional analysis.Characterization
The XRD patterns were measured in the 2θ range of (20–50°) on an X-ray diffractometer (Bruker D8, Germany) with Cu Kα radiation (1.5405 Å), working at 40 kV and 30 mA for phase detection. A UV vis-NIR spectrometer (PerkinElmer Lambda 950) was used to measure UV-vis-NIR absorption. The samples’ morphologies were examined using a scanning electron microscope (JEOL, JSM 6510LV). The sample is positioned within a homemade nano heater chamber and here heating is regulated with an accuracy of ±0.5 K. Utilizing 975 nm diode laser stimulation at a consistent pump power of 30 mW, emission spectra were captured using a monochromator spectrometer (Horiba Jobin Yvon, iHR320).Results and discussion
Structural properties and particle morphology
Phase composition and crystallinity of luminous materials play a crucial role in their performance. In general, luminophores with high crystallinity exhibit both stronger and weaker luminescent characteristics. The crystallinity of the powder composed of all-nano phosphors was assessed using X-ray diffraction (XRD). Fig. S1 (ESI†) displays the powder X-ray diffraction (XRD) pattern of the BYVO:2%Er3+/1%Tm3+/15%Yb3+ and BGVO:1%Tm3+/15%Yb3+ nano phosphor. The XRD patterns are closely matched the JCPDS card no. 81-1778 for all the synthesized nano phosphors.25,26 Rietveld refinement displayed in Fig. 1a and b was done based on the XRD data of all samples. The Rietveld findings indicate that these compounds crystallized in a monoclinic system with the space group P21/c. The unit cell parameters are calculated to be a = 12.376 Å, b = 7.732 Å, c = 11.179 Å and β = 103.486°. The absence of impurity peaks in the prepared nano phosphors is confirmed by the XRD pattern. The XRD patterns remained unchanged even when the Er3+, Yb3+, and Tm3+ ions were substituted for the Y3+ site, indicating the successful incorporation of these ions into the lattice structure. This outcome can be attributed to the similarity in ionic radii among Y3+ (CN = 6; r = 0.90 Å), Er3+ (CN = 6; r = 0.95 Å), Yb3+ (CN = 6; r = 0.95 Å), and Tm3+ (CN = 6; r = 0.88 Å) ions.27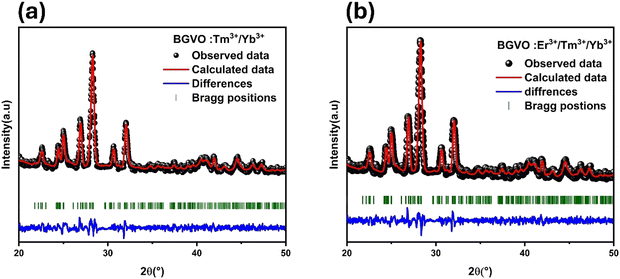 | ||
| Fig. 1 (a) Rietveld refinement of XRD data of BGVO:1%Tm3+/15%Yb3+ and (b) Rietveld refinement of XRD data of BGVO:2%Er3+/1%Tm3+/15%Yb3+. | ||
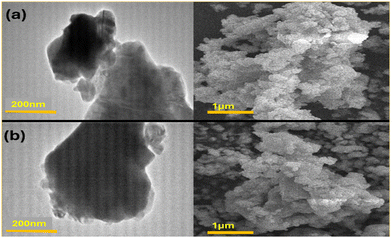
A transmission electron microscopy (TEM) technique was employed to examine the surface morphology and distribution of grain sizes. In Fig. 2, we have provided TEM images of both doped and undoped samples. It is evident that the irregular shapes observed in the images are due to the aggregation of grains with sizes ranging from 300 to 500 nm.
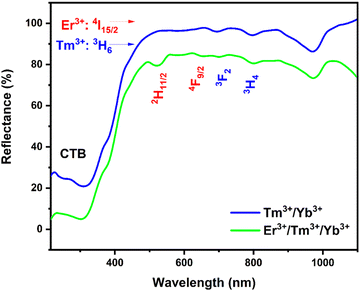
The diffuse reflectance spectra are displayed in Fig. 3 of BGVO co-doped Tm3+/Yb3+ and tri-doped Er3+/Tm3+/Yb3+ in the range (200–1100 nm). The spectrum presents an intense broad band peaking at 280 nm, which is attributed to the O2−–V5+ entity. However, this spectrum shows four distinct absorption peaks at 525, 648, 682 and 796 nm. These peaks correspond to the transitions of the Er3+ and Tm3+ ions, respectively. The 2F7/2 → 2F5/2 (Yb3+) absorption transition produces a broad absorption band with a peak at 975 nm.7
Luminescence measurements
Characteristics of emissions at ambient temperature
After being stimulated by a 975 nm laser, the synthesized nanomaterial exhibits a pronounced, easily discernible blue up-conversion (anti-Stokes) luminescence to the naked eye. Fig. 4a represents the emission spectra for the sample co-doped with Yb3+/Tm3+ when it is excited with 975 nm wavelength. The spectrum is the result of several sharp bands typical of Tm3+ ions in the spectral region of 450–850 nm and one band more than 900 nm typical of Yb3+ ions that is partially filtered by the short-pass 950 nm filter used.2 All detected bands are associated with the 4f–4f intra-configurational radiative transition of Tm3+:1G4 → 3H6 (≈470 nm), 1G4 → 3F4 (≈640 nm), 3F2,3 → 3H6 (≈700 nm), 3H4 → 3H6 (≈800 nm), and Yb3+:2F5/2 → 2F7/2 (>900 nm).28–30 This system employs Yb3+ as a sensitizer, pumping the excited states of Tm3+ (UC emitter) primarily via energy transfer UC processes when absorbed NIR light is transferred to neighboring Tm3+. The BGVO:Tm3+/Yb3+ nanomaterial demonstrates heightened near-infrared (NIR) emission at low excitation densities, offering potential utility in applications such as deep tissue imaging, optical signal amplification, and various other fields.31,32 In another way, the UC emission spectra shown in Fig. 4b of the BGVO tri-doped Tm3+, Er3+, and Yb3+ nano phosphors with a 975 nm laser diode were detected in the 450–960 nm wavelength range. Five UC emission peaks can be detected at 470, 487, 523, 538, 655, and 800 nm, associated to the 1G4 → 3H6 (Tm3+), 2H11/2 → 4I15/2 (Er3+), 4S3/2 → 4I15/2 (Er3+), the combined 1G4 → 3F4 (Tm3+)/4F9/2 → I15/2 (Er3+) and 3H4 → 3H6 (Tm3+) transitions, respectively, and of Yb3+:2F5/2 → 2F7/2 (>900 nm).28–30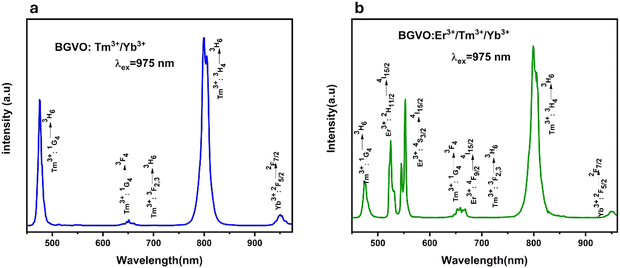 | ||
| Fig. 4 Up-conversion emission spectra (a) of the BGVO:Tm3+/Yb3+ and (b) of the BGVO:Er3+/Tm3+/Yb3+ upon 975 nm excitation. | ||
Fig. S2 (ESI†) shows these results and a rise time and a decay time for the Tm3+/Yb3+ and Er3+/Tm3+/Yb3+ doped BGVO nano phosphors have been measured using the 975 nm excitation. These curves are characteristics of upconversion processes, and the temporal evolution depends on the lifetimes of the involved intermediate levels.
To evaluate the transition mechanism of different emission peaks, we also examine the correlation between the luminous intensity of the UP (upconversion) and the power of the pump. The intensity of each emission peak in the upconversion process is determined by a power function of the power of infrared excitation. The formula is as follows:
| I = K·Pn | (1) |
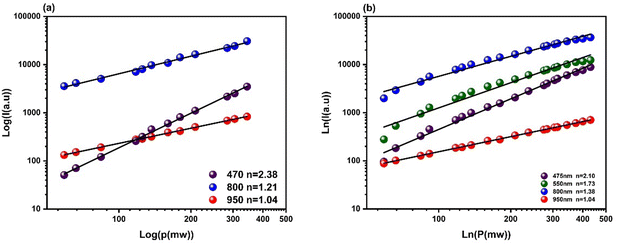 | ||
| Fig. 5 Dependence of the intensity with the pump power at 975 nm of (a) BGVO:Tm3+/Yb3+ and (b) BGVO:Er3+/Tm3+/Yb3+. | ||
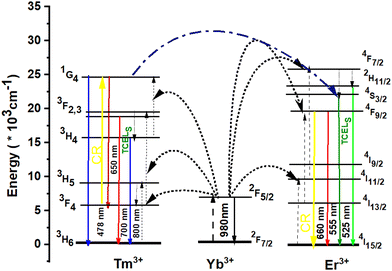
Fig. 6 shows the schematic diagram of the energy levels of Yb3+, Er3+ and Tm3+, as well as energy transfer and non-radiative transition processes. It can be seen from the figure that more effective energy conversion successively occurs from Yb3+ to Er3+ and Tm3+ under 975 nm excitation. For the UP mechanism of Yb3+ and Er3+ ions, the 2F7/2 ground state of Yb3+ ion absorbs a 975 nm photon energy and transitions to the 2F5/2 excited state. The 2F5/2 excited state of the Yb3+ ion transfers energy to the 4I11/2 energy level of Er3+, and the electrons at the 4I11/2 level of Er3+ rapidly relax to the 4I13/2 level by non-radiative transition. Er3+ at the 4I13/2 level can transfer energy with one Yb3+ in the excited state and be excited to the 4I9/2 level. Er3+ at the 4I9/2 level rapidly transitions to the ground state to produce upconverted red light. Simultaneously, Yb3+ reaches the excited state under 975 nm excitation. The energy transfer between the excited Yb3+ and Er3+ makes the Er3+ of the 4I11/2 level transition to the 2H11/2 and 4S3/2 levels. Er3+ at the 2H11/2 and 4S3/2 levels rapidly transitions to the ground state to produce upconverted green light. For the UC mechanism of Yb3+ and Tm3+ ions, the 2F7/2 ground state of Yb3+ ion absorbs a 975 nm photon energy and transitions to the 2F5/2 excited state, the 2F5/2 excited state of the Yb3+ ion transfers energy to the 3H5 ground state of the Tm3+ ion. The electrons at the 3H5 level of Tm3+ rapidly relax to the 3F4 level by non-radiative transition. Tm3+ at the 3F4 level can transfer energy with one Yb3+ in the excited state and be excited to 3F2,3 levels. Tm3+ at the 3F2,3 levels rapidly relaxes to the 3H4 level or transitions to the ground state to produce upconverted red light, respectively. Tm3+ at the 3H4 level can transfer energy with one Yb3+ in the excited state and be excited to the 1G4 level. Tm3+ at the 1G4 level transitions to the ground state to produce UC blue fluorescence. The resonant cross relaxation process (CR) 3F4 (Tm3+) + 4F9/2 (Er3+) → 1G4 (Tm3+) + 4I15/2 (Er3+) between Tm3+ and Er3+ ions leads to the population of the 1G4 state of Tm3+ ions and depopulation of the 4F9/2 state of Er3+ ions, and then to the 2H11/2/4S3/2 state through the multiphonon-assisted relaxations.
Temperature sensing
Temperature is an important parameter in scientific research, healthcare, and manufacturing, and reliable temperature measurement is necessary for practical applications. First, it is important to note that BGVO was chosen as a host for the optically active lanthanide ions (Yb3+, Tm3+ and Er3+) primarily due to its resistance to high-temperature treatment, and the ability to dope with various lanthanide ions. This resulted in a product that was well-crystallized, nano-sized, and displayed bright and intense luminescence. Changes in temperature affect the intensity of the emission bands of Er3+, Tm3+ and Yb3+ ions that are observed.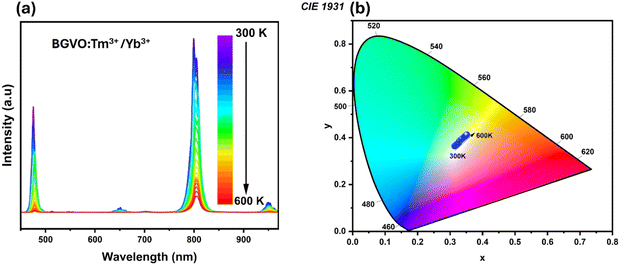 | ||
| Fig. 7 (a) Upconversion spectra, and (b) chromaticity diagram of BGVO:Tm3+/Yb3+ obtained upon 975 nm excitation at different temperatures. | ||
From the point of view of temperature sensing, we have focused on two diverse band intensity ratios, corresponding to the thermally coupled levels (TCLs) of Tm3+ and the non-TCLs of Yb3+ and Tm3+. Herein, the thermalization processes between the 3F2,3 and 3H4 excited levels of Tm3+ are well-established in the literature.33 These TCLs are separated by relatively large energy (usually ΔE ≈ 1500–2000 cm−1), resulting in effective thermalization in a high-temperature range and good relative sensitivity. As the temperature increases the lower energy I1 band (800 nm) decreases, and the intensity of the higher energy I2 band (700 nm) increases, according to the Boltzmann-type distribution.34
 | (2) |
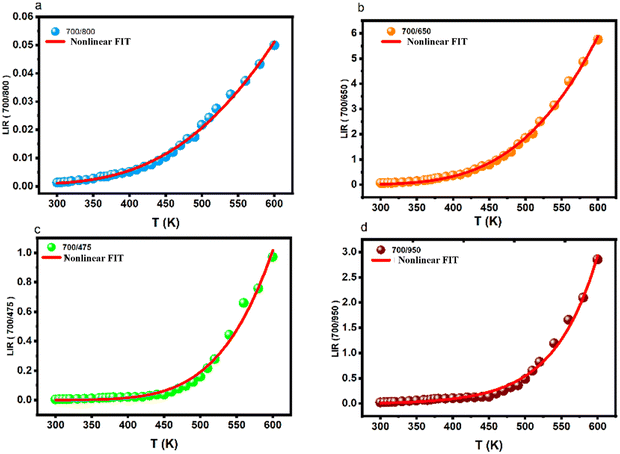 | ||
| Fig. 8 LIR variations of Tm3+/Yb3+; (a) 700/800 nm, (b) 700/650 nm, (c) 700/475 nm and (d) 700/950 nm as a function of temperature. | ||
Meanwhile, in the case of uncoupled levels (NTCL), it is challenging to populate them through thermal excitation because of their significant energy gaps. Consequently, traditional LIR is not suitable for NTCL. Experimental LIR data can be effectively modeled using a flowing function.35,36
 | (3) |
In contrast, the LIR parameter, linked to Yb3+ and Tm3+ NTCL, which corresponds to the 700/950 nm band intensity ratio, exhibited a correlation with temperature through the utilization of the following multi-exponential function.
 | (4) |
Sensitivity was a crucial and notable attribute when it came to quantitatively evaluating the appropriateness of materials for use as optical sensors in real-world applications. Moreover, the absolute sensitivity (Sa) and relative sensitivity (Sr) can be computed using the following formula. These sensitivities are defined by these two equations:
 | (5) |
 | (6) |
In all cases, regardless of whether it is TCL, NTCL, single-center, or dual-center, the absolute sensitivity increases with the rise in temperature, with a maximum of 0.38 × 10⁻³, 0.056 × 10⁻³, 0.014 × 10⁻³, and 0.048 × 10⁻³% K−1 for 700/800 nm, 700/650 nm, 700/475 nm, and 700/950 nm, respectively. It's observed that in the case of TCL, the relative sensitivity decreases with an increase in temperature, reaching a maximum equal to 1.71% K−1 at 348 K as it can be seen on Fig. 9a. In the cases of NTCL, Fig. 9b–d show that the relative sensitivity ratio decreases with increasing temperature. It's obvious that the Sr of the NTCL is higher than that of the TCL, and when comparing the NTCL in the single center (Tm3+/Tm3+) and dual center (Yb3+/Tm3+), we can conclude that Sr in the single center (Tm3+/Tm3+) has excellent relative sensitivity, which is equal to 5.39% K−1 at 300 K (Fig. 9c).
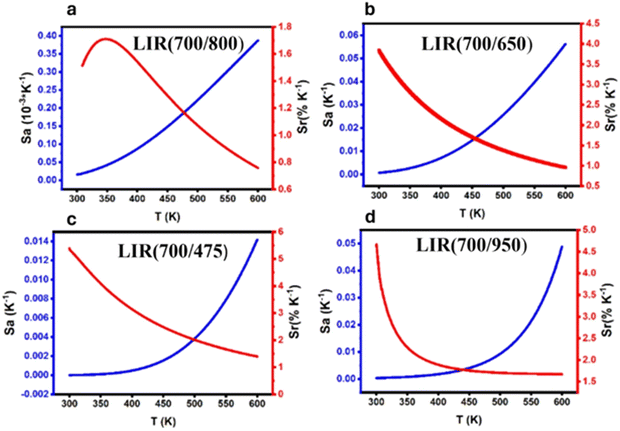 | ||
| Fig. 9 The calculated Sa and Sr values based on Tm3+/Yb3+ (a) LIR 700/800 nm, (b) LIR 700/650 nm, (c) LIR 700/475 nm and (d) LIR 700/950 nm as a function of temperature. | ||
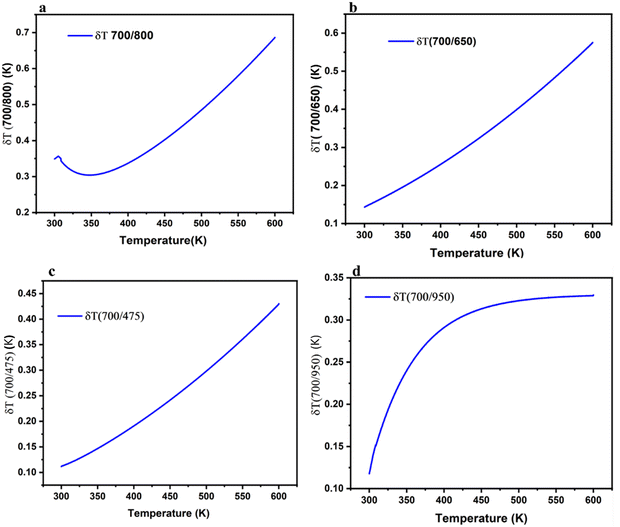
Temperature resolution (δT) is a crucial parameter for evaluating the effectiveness of a temperature sensor. It denotes the smallest temperature variation that the sensor is capable of detecting. It is calculated by dividing the relative uncertainty in determining the ratiometric FIR value, δFIR/FIR, by the relative thermal sensitivity Sr.
 | (7) |
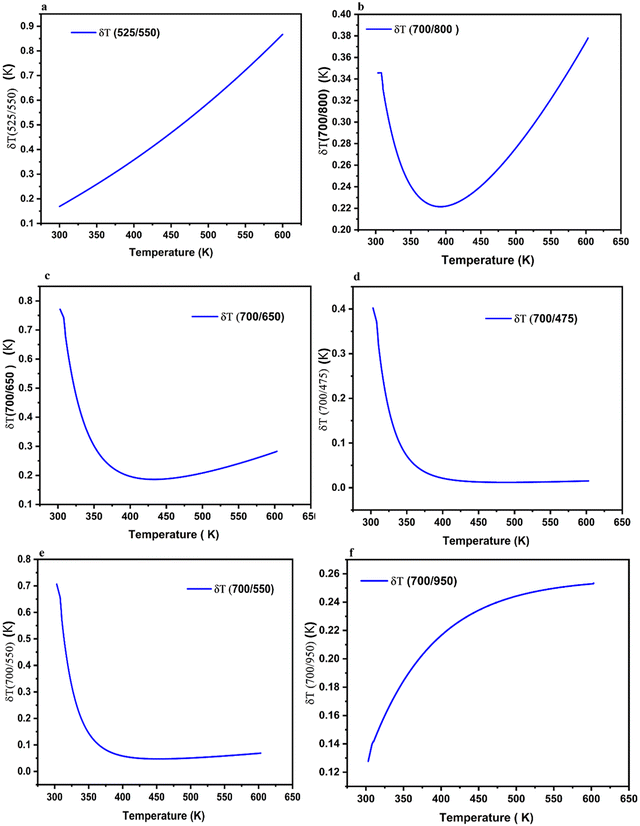
Based on eqn (6), we have displayed all the computed temperature resolutions as a function of temperature in the range 300–600 K (see Fig. 10), the values obtained are below 0.5 K. This shows that both LIR methods demonstrate great accuracy over the whole temperature range. This statement offers an approximate sense of the thermal resolution that may be attained in temperature measurements with this luminous substance. It is worth noticing that the LIR (700/475 nm) (Fig. 10c), offers the best thermal resolution values (0.1 K). Based on the gathered data, it can be stated that the developed thermometer is appropriate for temperature sensing in both biological and industrial systems. The results reveal that the BGVO-based nano phosphor displays improved temperature resolution compared to the other ceramics, within the required operating temperature range.37
To investigate how up-conversion luminescence changes with temperature, we collected emission spectra from the BGVO:Er3+/Tm3+/Yb3+ nano phosphors. The up-conversion emission spectra at various temperatures are presented in Fig. 11a. It is evident that the temperature has a noticeable impact on the relative intensities of the measured up-conversion (UC) emission bands of Er3+ and Tm3+ ions. The gradual decrease in luminescence intensity with increasing temperature can be attributed to nonradiative relaxation, energy transfer, and crossover processes, all playing a role in this effect. It's important to highlight that the emission band around ∼700 nm (corresponding to the 3F2,3 → 3H6 transition of Tm3+) is initially absent (close to the noise level) at room temperature but becomes visible and intensifies as the temperature increases. The 950 nm band of Yb3+ exhibits a similar trend of decreasing intensity as well.
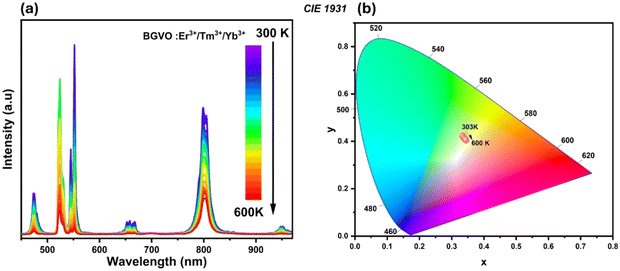 | ||
| Fig. 11 (a) Temperature-dependence of the emission spectra; (b) chromaticity diagram of the BGVO:Er3+/Tm3+/Yb3+ sample. | ||
The determined FIR values of the emission bands originating from TCLs of Er3+ ions (2H11/2/4S3/2i.e. 525/550), and Tm3+ ions (3F2,3/3H4i.e. 700/800) are well-fitted with a value of R2 = 0.999 and 0.995 based on eqn (1), as depicted in Fig. 12a and b, respectively. Furthermore, the 700/475, 700/650, 700/550 and 700/950 ratios are analyzed using nonlinear fits (see Fig. 12c–f).
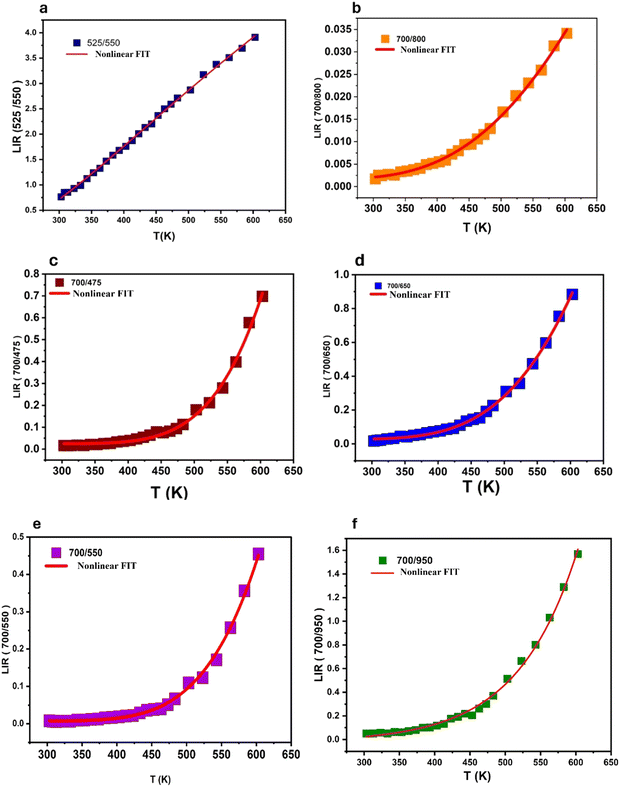 | ||
| Fig. 12 LIR variations of Er3+/Tm3+/Yb3+; (a) 525/550 nm, (b) 700/800 nm, (c) 700/475 nm, (d) 700/650 nm, (e) 700/550 nm and (f) 700/950 nm as a function of temperature. | ||
In all analyzed cases, regardless of the energy level type (TCL, NTCL, single-center, or dual-center), the absolute sensitivity increased with rising temperature. The maximum Sa observed was: 11 × 10−3 K−1 (525/550 nm), 0.22 × 10⁻³ K−1 (700/800 nm), 10.0 × 10⁻³ K−1 (700/475 nm), 0.8 × 10⁻³ K−1 (700/650 nm), 0.6 × 10⁻³ K−1 (700/550 nm), and 17.0 × 10⁻³ K−1 (700/950 nm) shown in Fig. 13a–f. Notably, the Sa values were significantly higher for Er3+/Tm3+/Yb3+ tri-doped BGVO nano phosphors compared to Tm3+/Yb3+ co-doped samples. This observation highlights the role of Er3+ doping in enhancing this crucial parameter.
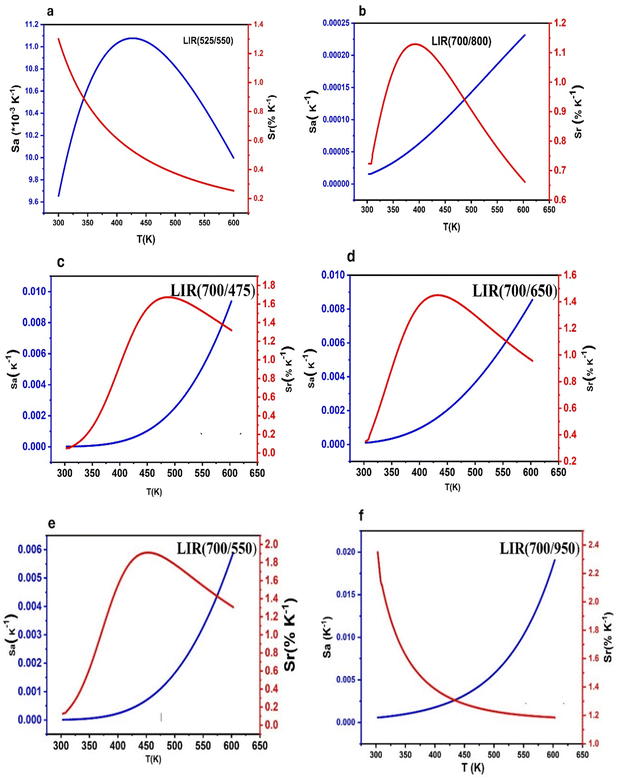 | ||
| Fig. 13 The calculated Sa and Sr values based on Er3+/Tm3+/Yb3+: (a) 700/800 nm, (b) 700/650, (c) 700/475, (d) 700/550 nm, (e) 525/550 nm and (f) 700/950 nm as a function of temperature. | ||
The variation of the Sr parameter with temperature exhibits similar behavior for both Tm3+/Yb3+ and Er3+/Tm3+/Yb3+ co-doped samples in the case of TCLs (see Fig. 13a and b). However, for non-thermally coupled energy levels (NTCL), a significant difference is observed. Unlike Tm3+/Yb3+ co-doped samples, Er3+/Tm3+/Yb3+ co-doped samples exhibit a well-defined maximum Sr value (Srmax) at specific temperatures. This behavior holds promise for the design of high-sensitivity sensors within a well-defined temperature range.
The LIR values of non-TCLs for single centers (700/650), (700/475), and dual centers (Tm3+/Er3+) (700/550) and (Tm3+/Yb3+) (700/950) at temperatures ranging from 300 K to 600 K are displayed in Fig. 13c–f. Therefore, eqn (3) can be successfully utilized to fit the data for (700/650), (700/475), and (700/550), while eqn (4) is suitable for fitting (700/950). The resulting variations of Sa and Sr with temperature are depicted in Fig. 13c–e.
Remarkably, the utilization of NTCL resulted in a significantly higher Srmax value of 2.35% K−1 at 300 K. This achievement was made possible by employing the combination of upconversion (UC) emission bands at 700/950 nm, originating from the transitions of Tm3+/Yb3+ in the tridoped BGVO:Er3+/Tm3+/Yb3+ nano phosphor.
The maximum Sr values (Srmax) for the Er3+/Tm3+/Yb3+ co-doped samples were determined to be: 1.3, 1.12, 1.67, 1.45, 1.91 and 2.35 K−1 for emission wavelengths of (525/550 nm), (700/800 nm), (700/475), (700/650), (700/550), and (700/950), respectively (shown in Fig. 13a–f). These values are slightly lower than those observed in the Tm3+/Yb3+ co-doped samples, but with the advantage of a well-defined Srmax at a specific temperature.
Fig. 14a–f illustrates the temperature uncertainties (δT) for all the samples. Notably, the addition of Er3+ doping to BGVO:Tm3+/Yb3+ significantly improves the temperature resolution. In particular, for the 700/550 and 700/445 ratios, δT reaches an impressive value of 0.02 K. This observation further emphasizes the crucial role of Er3+ doping in enhancing the performance of these optical temperature sensors.
Table 1 shows that compared to other lanthanide-based optical thermometers, the Ba2GdV3O11:Er3+/Tm3+/Yb3+ and Ba2GdV3O11:Tm3+/Yb3+ sensors have higher Sr values, in a wide temperature sensing range (300–600 K). This makes them perfect for a wide range of luminescence thermometry uses.
| Materials | T-range (K) | S r (% K−1) at 300 K | S r (% K−1) at Tmax | Ref. |
|---|---|---|---|---|
| NaBiF4:Tm3+/Yb3+ | 303–443 | 0.7 | 1.1 | 38 |
| Y2Ti2O7:Tm3+/Yb3+ | 300–400 | 0.4 | 0.87 | 39 |
| GdVO4:Tm3+/Yb3+ | 297–673 | 0.4 | 1.54 | 40 |
| NaY2F7:Tm3+/Yb3+ | 300–567 | 0.5 | 1.2 | 41 |
| Na3GdV2O8Tm3+/Yb3+ | 298–565 | 1.34 | 2.01 | 42 |
| Ba2GdV3O11:Er3+/Yb3+ | 298–573 | 1.1 | 1.1 | 43 |
| Gd2O3:Yb3+/Er3+ | 300–900 | 0.83 | 0.20 | 44 |
| NaSrY(MoO4)3:Er3+/Yb3+ | 298–335 | 1.19 | 1.19 | 45 |
| YPVO4:2%Er3+/15%Yb3+ | 300–440 | 0.937 | 0.937 | 46 |
| Ba2YV3O11:Er3+/Yb3+/Bi3+ | 300–440 | 1.43 | 1.43 | 37 |
| Er3+/Yb3+Na3Gd(VO4)2 | 300–600 | 0.83 | 0.83 | 47 |
| Ba2GdV3O11:Tm3+/Yb3+ | 303–603 | 5.397 | 5.397 (700/475) | This work |
| Ba2GdV3O11:Er3+/Tm3+/Yb3+ | 303–603 | 0.2 | 2.35 (700/950) | This work |
Our findings underscore the potential of erbium doping to modulate temperature sensitivity peaks, and improve the temperature resolution, crucial for optimizing performance in tailored luminescence sensors. This research highlights the profound influence of erbium (Er3+) doping on the temperature sensitivity characteristics of thermometric systems, paving the way for improved precision in temperature measurements. This adjustment not only sheds light on the underlying mechanisms of tunability, but also unlocks novel opportunities for customizing thermometric devices to meet specific application needs.
The repeatability (R) is another crucial metric for assessing the accuracy of the temperature sensing techniques employed. The thermometric parameters, specifically the LIR values, were measured multiple times as the sample was cycled from a low to a high temperature, as illustrated in Fig. S3(a–d) and S4(a–f) (ESI†). The repeatability (R) was calculated using the following formula:
 | (8) |
Conclusion
In this study, the influence of erbium (Er3+) doping on the temperature sensitivity profile of upconversion luminescent nanoparticles based on Ba2GdV3O11 co-doped with Tm3+ and Yb3+ was investigated. Both BGVO:Yb3+/Tm3+ and BGVO:Er3+/Tm3+/Yb3+ nanoparticles exhibited strong blue and green upconversion luminescence, respectively, under 975 nm laser excitation. The fluorescence intensity ratio (FIR) method was employed to analyze the temperature-dependent luminescence spectra across a broad temperature range (300–600 K). Our analysis was focused on both thermally coupled energy levels (TCLs) and non-thermally coupled energy levels (NTCLs) of Er3+ and Tm3+ for their impact on temperature sensing performance. The key finding of this work is the ability to modulate the temperature of maximum sensitivity through Er doping. In Tm3+/Yb3+ co-doped samples, the peak sensitivity (1.7% K−1) occurred around 350 K primarily due to TCLs. Interestingly, non-TCL sensitivities lacked a clear maximum within the 300–600 K range. In contrast, Er3+/Tm3+/Yb3+ tri-doped samples displayed a distinct maximum in non-TCL sensitivity within this temperature range, offering superior temperature determination for specific applications. Notably, Er3+ doping also improved the temperature resolution from 0.1 K to 0.02 K. Remarkably, the utilization of non-TCLs resulted in a significantly higher Srmax value of 2.35% K−1 at 300 K. This achievement was made possible by employing the combination of upconversion (UC) emission bands at 700/950 nm, originating from the transitions of Tm3+/Yb3+ in the tridoped BGVO Er3+/Tm3+/Yb3+ nano phosphor. Thus, erbium doping has emerged as a powerful tool for fine-tuning temperature sensitivity in luminescent nanosensors. This precise control over sensitivity translates to enhanced temperature resolution, a critical factor for optimizing sensor performance. By revealing the underlying mechanism, our research unlocks the potential for designing customized thermometric devices with superior accuracy.Data availability
The data supporting this article have been included as part of the ESI.†Conflicts of interest
There are no conflicts to declare.Acknowledgements
This work was supported by the Ministry of Higher Education and Scientific Research Tunisia, the Ministerio de Ciencia e Innovación of Spain (MICIIN) under the National Program of Sciences and Technological Materials (PID2019-106383GB-C44 and PID2019-107335RA-I00) and Gobierno de Canarias (ProID2020010067) and EU-FEDER funds.References
- R. P. Benedict, Fundamentals of Temperature, Pressure, and Flow Measurements, John Wiley & Sons, 1991 Search PubMed.
- M. Runowski, P. Woźny, N. Stopikowska, I. R. Martín, V. Lavín and S. Lis, Luminescent Nanothermometer Operating at Very High Temperature—Sensing up to 1000 K with Upconverting Nanoparticles (Yb3+/Tm3+), ACS Appl. Mater. Interfaces, 2020, 12(39), 43933–43941, DOI:10.1021/acsami.0c13011.
- C. Bouzigues, T. Gacoin and A. Alexandrou, Biological Applications of Rare-Earth Based Nanoparticles, ACS Nano, 2011, 5(11), 8488–8505, DOI:10.1021/nn202378b.
- H. Cai, W. Lu, C. Yang, M. Zhang, M. Li, C.-M. Che and D. Li, Tandem Förster Resonance Energy Transfer Induced Luminescent Ratiometric Thermometry in Dye-Encapsulated Biological Metal-Organic Frameworks, Adv. Opt. Mater., 2019, 7(2), 1801149, DOI:10.1002/adom.201801149.
- C. Cressoni, F. Vurro, E. Milan, M. Muccilli, F. Mazzer, M. Gerosa, F. Boschi, A. E. Spinelli, D. Badocco, P. Pastore, N. F. Delgado, M. H. Collado, P. Marzola and A. Speghini, From Nanothermometry to Bioimaging: Lanthanide-Activated KY3F10 Nanostructures as Biocompatible Multifunctional Tools for Nanomedicine, ACS Appl. Mater. Interfaces, 2023, 15(9), 12171–12188, DOI:10.1021/acsami.2c22000.
- Y. Gao, F. Huang, H. Lin, J. Zhou, J. Xu and Y. Wang, A Novel Optical Thermometry Strategy Based on Diverse Thermal Response from Two Intervalence Charge Transfer States, Adv. Funct. Mater., 2016, 26(18), 3139–3145, DOI:10.1002/adfm.201505332.
- K. Saidi, M. Dammak, K. Soler-Carracedo and I. R. Martín, A Novel Optical Thermometry Strategy Based on Emission of Tm3+/Yb3+ Codoped Na3GdV2O8 Phosphors, Dalton Trans., 2022, 51(13), 5108–5117, 10.1039/D1DT03747A.
- K. Saidi, I. Kachou, K. Soler-Carracedo, M. Dammak and I. R. Martín, Ba2YV3O11 Er3+/Yb3+ Nanostructures for Temperature Sensing in the Presence of Bismuth Ions, ACS Appl. Nano Mater., 2023 DOI:10.1021/acsanm.3c02911.
- F. Ayachi, K. Saidi, M. Dammak, W. Chaabani, I. Mediavilla-Martínez and J. Jiménez, Dual-Mode Luminescence of Er3+/Yb3+ Codoped LnP0.5V0.5O4 (Ln = Y, Gd, La) for Highly Sensitive Optical Nanothermometry, Mater. Today Chem., 2023, 27, 101352, DOI:10.1016/j.mtchem.2022.101352.
- I. Kachou, K. Saidi, R. Salhi and M. Dammak, Synthesis and Optical Spectroscopy of Na3Y(VO4)2:Eu3+ Phosphors for Thermometry and Display Applications, RSC Adv., 2022, 12(12), 7529–7539, 10.1039/D2RA00539E.
- I. Kachou, M. Dammak, S. Auguste, F. Amiard and P. Daniel, A Novel Optical Temperature Sensor and Energy Transfer Properties Based on Tb3+/Sm3+ Codoped SrY2(MoO4)4 Phosphors, Dalton Trans., 2023, 52(48), 18233–18246, 10.1039/D3DT03410K.
- B. Zheng, J. Fan, B. Chen, X. Qin, J. Wang, F. Wang, R. Deng and X. Liu, Rare-Earth Doping in Nanostructured Inorganic Materials, Chem. Rev., 2022, 122(6), 5519–5603, DOI:10.1021/acs.chemrev.1c00644.
- F. Ayachi, K. Saidi, W. Chaabani and M. Dammak, Synthesis and Luminescence Properties of Er3+ Doped and Er3+–Yb3+ Codoped Phosphovanadate YP0.5V0.5O4 Phosphors, J. Lumin., 2021, 240, 118451, DOI:10.1016/j.jlumin.2021.118451.
- A. S. Laia, D. A. Hora, S. dos, M. V. Rezende, Y. Xing, J. J. Rodrigues, G. S. Maciel and M. A. R. C. Alencar, Nd3+-Doped LiBaPO4 Phosphors for Optical Temperature Sensing within the First Biological Window: A New Strategy to Increase the Sensitivity, Chem. Eng. J., 2020, 399, 125742, DOI:10.1016/j.cej.2020.125742.
- C. Hernández-Álvarez, G. Brito-Santos, R. Martín, I. Sanchiz, J. Saidi, K. Soler-Carracedo, K. Marciniak and M. Runowski, Multifunctional Optical Sensing Platform of Temperature, Pressure (Vacuum) and Laser Power Density: NaYF4:Gd3+,Yb3+,Er3+ Nanomaterial as Luminescent Thermometer, Manometer and Power Meter, J. Mater. Chem. C, 2023, 11(30), 10221–10229, 10.1039/D3TC01712E.
- K. Saidi, W. Chaabani and M. Dammak, Highly Sensitive Optical Temperature Sensing Based on Pump-Power-Dependent Upconversion Luminescence in LiZnPO4:Yb3+–Er3+/Ho3+ Phosphors, RSC Adv., 2021, 11(49), 30926–30936, 10.1039/D1RA06049J.
- T. Grzyb, A. Gruszeczka, R. J. Wiglusz and S. Lis, The Effects of Down- and up-Conversion on Dual-Mode Green Luminescence from Yb3+- and Tb3+-Doped LaPO4 Nanocrystals, J. Mater. Chem. C, 2013, 1(34), 5410, 10.1039/c3tc31100g.
- T. Grzyb, P. Kamiński, D. Przybylska, A. Tymiński, F. Sanz-Rodríguez and P. Haro Gonzalez, Manipulation of Up-Conversion Emission in NaYF4 Core@shell Nanoparticles Doped by Er3+, Tm3+, or Yb3+ Ions by Excitation Wavelength—Three Ions—Plenty of Possibilities, Nanoscale, 2021, 13(15), 7322–7333, 10.1039/D0NR07136F.
- S. Goderski, M. Runowski, P. Woźny, V. Lavín and S. Lis, Lanthanide Upconverted Luminescence for Simultaneous Contactless Optical Thermometry and Manometry–Sensing under Extreme Conditions of Pressure and Temperature, ACS Appl. Mater. Interfaces, 2020, 12(36), 40475–40485, DOI:10.1021/acsami.0c09882.
- B. Fu, H. Yan, R. Li, L. Feng, Y. Yu, G. Gong, H. Huang and J. Liao, Heterovalent Zr4+/Nb5+-Cosubstituted Negative Thermal Expansion Luminescent Materials with Anti-Thermal Quenching Luminescence, Laser Photonics Rev., 2024, 2400739, DOI:10.1002/lpor.202400739.
- P. Rawat, S. K. Saroj, J. Kaur and R. Nagarajan, Luminescent Properties of K2SbF5: Ln (Ln = Eu3+, Tb3+, Er3+) Obtained by a Facile Room Temperature Mechanochemical Synthesis, J. Lumin., 2019, 210, 392–396, DOI:10.1016/j.jlumin.2019.02.061.
- K. Szczodrowski, M. Behrendt, J. Barzowska, N. Górecka, N. Majewska, T. Leśniewski, M. Łapiński and S. Mahlik, Lanthanide Ions (Eu3+, Er3+, Pr3+) as Luminescence and Charge Carrier Centers in Sr2TiO4, Dalton Trans., 2023, 52(14), 4329–4335, 10.1039/D2DT04177D.
- L. Giordano, H. Du, V. Castaing, F. Luan, D. Guo and B. Viana, Enhanced Red-UC Luminescence through Ce3+ Co-Doping in NaBiF4:Yb3+/Ho3+(Er3+)/Ce3+ Phosphors Prepared by Ultrafast Coprecipitation Approach, Opt. Mater. X, 2022, 16, 100199, DOI:10.1016/j.omx.2022.100199.
- J. Liao, Z. Han, F. Lin, B. Fu, G. Gong, H. Yan, H. Huang, H.-R. Wen and B. Qiu, Simultaneous Thermal Enhancement of Upconversion and Downshifting Luminescence by Negative Thermal Expansion in Nonhygroscopic ZrSc(WO4)2PO4:Yb/Er Phosphors, Inorg. Chem., 2023, 62(24), 9518–9527, DOI:10.1021/acs.inorgchem.3c00880.
- P. Phogat, V. B. Taxak and R. K. Malik, Er3+ Doped Ba2GdV3O11: Synthesis and Characterization for Crystal and Photoluminescent Features of Bright Green Emitting Nanophosphor, Solid State Sci., 2022, 133, 107013, DOI:10.1016/j.solidstatesciences.2022.107013.
- P. Phogat, Sm3+ incorporated Ba2GdV3O11: Photometric and crystal analysis of the ultraviolet triggered nanophosphor with white emission, Chem. Phys., 2022, 561 DOI:10.1016/j.chemphys.2022.111623.
- P. Phogat, V. B. Taxak and R. K. Malik, Crystallographic and Optical Characteristics of Ultraviolet-Stimulated Dy3+-Doped Ba2GdV3O11 Nanorods, J. Electron. Mater., 2022, 51(8), 4541–4554, DOI:10.1007/s11664-022-09711-7.
- M. Runowski, A. Shyichuk, A. Tymiński, T. Grzyb, V. Lavín and S. Lis, Multifunctional Optical Sensors for Nanomanometry and Nanothermometry: High-Pressure and High-Temperature Upconversion Luminescence of Lanthanide-Doped Phosphates—LaPO4/YPO4:Yb3+–Tm3+, ACS Appl. Mater. Interfaces, 2018, 10(20), 17269–17279, DOI:10.1021/acsami.8b02853.
- H. Suo, F. Hu, X. Zhao, Z. Zhang, T. Li, C. Duan, M. Yin and C. Guo, All-in-One Thermometer-Heater up-Converting Platform YF3:Yb3+,Tm3+ Operating in the First Biological Window, J. Mater. Chem. C, 2017, 5(6), 1501–1507, 10.1039/C6TC05449H.
- M. Runowski, N. Stopikowska, D. Szeremeta, S. Goderski, M. Skwierczyńska and S. Lis, Upconverting Lanthanide Fluoride Core@Shell Nanorods for Luminescent Thermometry in the First and Second Biological Windows: β-NaYF4:Yb3+–Er3+@SiO2 Temperature Sensor, ACS Appl. Mater. Interfaces, 2019, 11(14), 13389–13396, DOI:10.1021/acsami.9b00445.
- A. S. Gouveia-Neto, J. F. Silva, M. V. D. Vermelho, A. S. L. Gomes and C. Jacinto, Generation of Multiwavelength Light in the Region of the Biological Windows in Tm3+-Doped Fiber Excited at 1.064 μm, Appl. Phys. Lett., 2016, 109(26), 261108, DOI:10.1063/1.4973452.
- A. F. El-Sherif and T. A. King, High-Energy, High-Brightness Q-Switched Tm3+-Doped Fiber Laser Using an Electro-Optic Modulator, Opt. Commun., 2003, 218(4–6), 337–344, DOI:10.1016/S0030-4018(03)01200-8.
- T. Wang, Y. Li, T. Liu, Y. Peng, Z. Yin, Z. Yang, J. Qiu and Z. Song, NIR-NIR Upconverting Optical Temperature Sensing Based on the Thermally Coupled Levels of Yb3+-Tm3+ Codoped Bi7F11O5 Nanosheets, J. Lumin., 2020, 221, 117034, DOI:10.1016/j.jlumin.2020.117034.
- K. Li, D. Zhu and C. Yue, Exceptional Low-Temperature Fluorescence Sensing Properties in Novel KBaY(MoO4)3:Yb3+,Ho3+ Materials Based on FIR of Ho3+ Transitions 5F5(1) → 5I8/5S2 → 5I8, J. Mater. Chem. C, 2022, 10(17), 6603–6610, 10.1039/D2TC01061E.
- Q. Han, H. Hao, J. Yang, Z. Sun, J. Sun, Y. Song, Y. Wang and X. Zhang, Optical temperature sensing based on thermal, non-thermal coupled levels and tunable luminescent emission colors of Er3+/Tm3+/Yb3+ tri-doped Y7O6F9 phosphor, J. Alloys Compd., 2019, 786, 770–778, DOI:10.1016/j.jallcom.2019.02.047.
- Y. Jiang, Y. Tong, S. Chen, W. Zhang, F. Hu, R. Wei and H. Guo, A Three-Mode Self-Referenced Optical Thermometry Based on up-Conversion Luminescence of Ca2MgWO6:Er3+,Yb3+ Phosphors, Chem. Eng. J., 2021, 413, 127470, DOI:10.1016/j.cej.2020.127470.
- K. Saidi, I. Kachou, K. Soler-Carracedo, M. Dammak and I. R. Martín, Ba2YV3O11 Er3+/Yb3+ Nanostructures for Temperature Sensing in the Presence of Bismuth Ions, ACS Appl. Nano Mater., 2023, 6(19), 17681–17690, DOI:10.1021/acsanm.3c02911.
- X. Tian, H. Dou and L. Wu, Photoluminescence and Thermometry Properties of Upconversion Phosphor NaBiF4: Yb3+/Tm3+, Opt. Mater., 2020, 99, 109544, DOI:10.1016/j.optmat.2019.109544.
- X. Tu, J. Xu, M. Li, T. Xie, R. Lei, H. Wang and S. Xu, Color-Tunable Upconversion Luminescence and Temperature Sensing Behavior of Tm3+/Yb3+ Codoped Y2Ti2O7 Phosphors, Mater. Res. Bull., 2019, 112, 77–83, DOI:10.1016/j.materresbull.2018.12.008.
- Ol. A. Savchuk, J. J. Carvajal, C. Cascales, J. Massons, M. Aguiló and F. Díaz, Thermochromic Upconversion Nanoparticles for Visual Temperature Sensors with High Thermal, Spatial and Temporal Resolution, J. Mater. Chem. C, 2016, 4(27), 6602–6613, 10.1039/C6TC01841F.
- S. Chen, W. Song, J. Cao, F. Hu and H. Guo, Highly Sensitive Optical Thermometer Based on FIR Technique of Transparent NaY2F7:Tm3+/Yb3+ Glass Ceramic, J. Alloys Compd., 2020, 825, 154011, DOI:10.1016/j.jallcom.2020.154011.
- K. Saidi, M. Dammak, K. Soler-Carracedo and I. R. Martín, A Novel Optical Thermometry Strategy Based on Emission of Tm3+/Yb3+ Codoped Na3GdV2O8 Phosphors, Dalton Trans., 2022, 51(13), 5108–5117, 10.1039/D1DT03747A.
- I. Kachou, K. Saidi, U. Ekim, M. Dammak, M. Ç. Ersundu and A. E. Ersundu, Advanced Temperature Sensing with Er3+/Yb3+ Co-Doped Ba2GdV3O11 Phosphors through Upconversion Luminescence, Dalton Trans., 2024, 53(5), 2357–2372, 10.1039/D3DT04015A.
- W. Zheng, B. Sun, Y. Li, T. Lei, R. Wang and J. Wu, Low Power High Purity Red Upconversion Emission and Multiple Temperature Sensing Behaviors in Yb3+,Er3+ Codoped Gd2O3 Porous Nanorods. ACS Sustain, Chem. Eng., 2020, 8(25), 9578–9588, DOI:10.1021/acssuschemeng.0c03064.
- K. Saidi, C. Hernández-Álvarez, M. Runowski, M. Dammak and I. Rafael Martín Benenzuela, Temperature and Pressure Sensing Using an Optical Platform Based on Upconversion Luminescence in NaSrY(MoO4)3 Codoped with Er3+ and Yb3+ Nanophosphors, ACS Appl. Nano Mater., 2023, 6(20), 19431–19442, DOI:10.1021/acsanm.3c04031.
- F. Ayachi, K. Saidi, M. Dammak, W. Chaabani, I. Mediavilla-Martínez and J. Jiménez, Dual-Mode Luminescence of Er3+/Yb3+ Codoped LnP0.5V0.5O4 (Ln = Y, Gd, La) for Highly Sensitive Optical Nanothermometry, Mater. Today Chem., 2023, 27, 101352, DOI:10.1016/j.mtchem.2022.101352.
- K. Saidi, M. Dammak, K. Soler-Carracedo and I. R. Martín, Optical Thermometry Based on Upconversion Emissions in Na3Gd (VO4)2:Yb3+-Er3+/Ho3+ Micro Crystals, J. Alloys Compd., 2022, 891, 161993, DOI:10.1016/j.jallcom.2021.161993.
Footnote |
| † Electronic supplementary information (ESI) available. See DOI: https://doi.org/10.1039/d4ma00699b |
| This journal is © The Royal Society of Chemistry 2024 |

