 Open Access Article
A dual functional Cu(II)-coordination polymer and its rGO composite for selective solvent detection and high performance energy storage†
Basree‡
a,
Waris
bc,
Arif
Ali‡
d,
Nishat
Khan
a,
Mohammad Zain
Khan
 c,
Ganesh Chandra
Nayak
 d,
Kafeel Ahmad
Siddiqui
 *e and
Musheer
Ahmad
 *a
*a
aDepartment of Applied Chemistry, ZHCET, Faculty of Engineering and Technology, Aligarh Muslim University Aligarh, UP 202002, India. E-mail: amusheer4@gmail.com
bEnvironmental Research Laboratory, Department of Chemistry, Faculty of Science, Aligarh Muslim University Aligarh, UP 202002, India
cElectrochemical Research Laboratory, Department of Industrial Chemistry, Faculty of Science, Aligarh Muslim University Aligarh, UP 202002, India
dDepartment of Chemistry & Chemical Biology, Indian Institute of Technology (ISM), Dhanbad–826004, Jharkhand, India
eDepartment of Chemistry, National Institute of Technology Raipur, Great Eastern Road, Raipur, Chhattisgarh 492010, India. E-mail: kasiddiqui.chy@nitrr.ac.in
First published on 1st October 2024
Abstract
Herein, the fabrication of a new Cu(II)-based coordination polymer {[Cu2(DPP)2(H2O)2]·DPP·2NO3}n (CP-1) (DPP = 1,3-di(4-pyridyl)propane) and its composite (rGO@CP-1) has been done using solvothermal and mechanochemical methods. The crystal structure of the synthesized CP-1 was confirmed utilizing single-crystal X-ray diffraction (SC-XRD). Furthermore, the structural features of the as-synthesized CP-1 and rGO@CP-1 were examined using PXRD, FTIR, TGA, SEM, and HR-TEM analysis. The topological framework of CP-1 shows a 1,3M4-1 underlying net for two fragments and the hydrogen-bonded network shows a 2C1 underlying net topology. The fluorescence detection of transition metal ions and solvents using CP-1 showed promising results of 97.4% DMF and 96.8% Zn2+. Electrochemical study of CP-1 and rGO@CP-1 was performed in an acidic medium (1 M H2SO4) electrolyte utilizing cyclic voltammetry (CV) and galvanostatic charge–discharge (GCD) techniques with a specific capacity of 244.17 F g−1 and 899.54 F g−1 for CP-1 and rGO@CP-1, respectively at 1 A g−1 (current density). Moreover, 98.6% columbic efficiency with 94.62% capacity retention of rGO@CP-1 was obtained at 8 A g−1 up to 2000 cycles.
1. Introduction
In this digital era, the challenges of power generation, energy storage, and global climate change necessitate a range of technologically advanced solutions to address the contradiction between fossil resource consumption and environmental preservation.1 There has been a dramatic increase in the need for readily accessible, portable electrical and rechargeable devices in recent years.2–4 Therefore, scientists have created energy storage systems that are affordable, versatile, and highly effective in order to meet these increasing demands. Electrochemical energy storage systems that use supercapacitors (SCs) as anodes (redox-type) and cathodes (capacitive qualities) have shown great promise.5–8 Recent literature on supercapacitors (SCs) has shown their potential as superlative energy storage and power storage sources for electrical and battery-type vehicles.9–11 The SCs demonstrate outstanding electrochemical performance, including higher power density, fast charge–discharge rate, and long-term lifespan. The exceptional energy storage properties of SCs are mainly influenced by the properties of the electrode material, including its shape adjustability, high electrochemical activity, excellent mechanical and chemical properties, specific surface area, adjustable porosity, and strong conductivity.12–15 Therefore, coordination polymers are highly favored for SC applications due to their ability to meet all the necessary SC features.In this scenario, CPs are materials that have a highly crystalline structure, consisting of central metal ions or metal clusters connected by organic linkers.16–18 Due to the advantages of CPs, such as adjustable porosity, tunable chemical structure, and controllable morphology, CPs have been used for a wide range of applications, such as adsorption,19–22 separation,19 catalysis,23 gas storage, drug delivery,24 luminescence sensing,25,26 waste-water treatment,27 batteries,2 and more recently, supercapacitors.28
Accurately detecting trace elements in environmental and biological processes continues to be a major challenge, requiring the use of appropriate sensors.29 Zinc (Zn2+) is the most abundant metal ion among all the transition elements in the human body, following Fe3+. The Zn2+ ion is crucial for various functions in the human body, including gene expression, neural signal transmission, cell apoptosis, and pathological processes.30–32 It is important to maintain a balanced level of Zn2+ for optimal human health.33 Furthermore, an overabundance of Zn2+ ions can result in a decrease in soil microbial activity due to the influence of plant toxins. On the other hand, volatile organic compounds such as EtOH, DMSO, TEA and DMF are non-biodegradable and constitute a lasting hazard to human health.34 Keeping in mind both human health and environmental concerns, it is crucial to develop extremely effective techniques for the prompt and accurate detection of Zn2+ and organic volatile chemicals (DMF). As a result, developing novel fluorescence sensors capable of selectively sensing Zn2+ ions as well as organic volatile compounds with increased sensitivity is essential in current progress. Nowadays, florescence-based CPs have gained a lot of attention due to selectivity, operability simplicity and sensitivity.35,36
Zhao et al. reported the high-performance sensing of Fe3+ ions using a chiral lanthanide-based CP with 99.06% detection limit.37 MIL-53-L5 (L5 = 2-(pyrene-1-imine) terephthalic acid) nanocrystals have been reported for the sensing of a trace amount of Cu2+ in aqueous solution with a good Ksv value of 6.15 × 103.38 Xu et al. fabricated the [Eu(BTB)(phen)](DMF)4.5(H2O)2 CP structure and checked the luminescence sensing of Al3+ ions with 5 × 10⁻⁸ M (1.35 ppb) detection limit.39
The ultrahigh specific surface area, high porosity, and structural tunability of CPs give them excellent electrochemical performance, and better lifespan, power density, and charging–discharging rates. However, CPs have not shown good conductivity. In contrast, reduced graphene oxide has good conducting nature and high surface area, thus showing many advantages to enhance the conductivity of CPs. Banerjee et al. have reported a Ni-doped MOF/rGO composite which has shown a specific capacitance of 758 F g−1.40 Deka et al. reported a 2D layered CP of Ni(II) for a supercapacitor with a specific capacitance of 802 F g−1 at 3 A g−1 current density and good cycling stability up to ∼95% at 5000 cycles.41 Ghosh et al. synthesized a Zn(II)-based 1D CP by using the slow diffusion method and its hetero nanocomposite (Zn–CP/rGO) by an ultrasonication approach with a specific capacitance of 261 F g−1 and 377 F g−1 at 1 A g−1 current density and the retention stability of 97% and 85% at 6 A g−1 upon 6000 charging–discharging cycles, respectively.42 Cai et al. reported a Ni(II)-based 1D π–d conjugated CP, namely (Ni-BTA), for energy storage functions with high coloration efficiency (223.6 cm2 C−1), with a high gravimetric capacity of 168.1 mA h g−1 and high retention durability for 10 k cycles.43 Gupta et al. fabricated 2D Cu-MOF and composite (Cu-MOF/rGO) by solvothermal and ultrasonication methods to develop an electrode material for energy storage applications with a specific capacitance of 462 F g−1 for Cu-MOF and 256 F g−1 for Cu-MOF/rGO at 0.8 A g−1, and the cyclic stability was 77.7% and 93.75% at 12 A g−1 current density upon 1000 cycles, respectively.44
As per the literature, several types of CPs/MOFs (1D to 3D) have been reported for energy storage applications. Several CPs that are reported in the literature have similar structures to our synthesized CP-1. For instance, Stone et al. fabricated three different copper malonate coordination polymers containing dpp linkers which showed rare 2D + 1D + 1D = 3D topology with different structures.45 The structure of these polymers is mainly influenced by the steric bulk of malonate linkers. YU et al. developed two novel one-dimensional Cu(II)-based coordination polymers containing H2bpdc = biphenyl-4,4′-dicarboxylic acid, bpp = 1,3-di(4-pyridyl)propane and H2tdc = thiophene-2,5-dicarboxylic acid organic linkers.46 In both the complexes, the conformation of the bpp ligand is different. Luo et al. synthesized two unique Cu(II)-based coordination polymers having bpp = 1,3-bis(4-pyridyl)propane, tp = terephthalate, ip = isophthalate organic linkers.47 The electrochemical study revealed that both the complexes have oxidizable/reducible properties. Herein, we reported a 1D Cu(II)-based coordination polymer (CP-1) for the detection of metal ions (Co, Cd, Fe and Zn) as well as solvent (EtOH, DMSO, H2O, TEA and DMF) analytes. The fabricated CP-1 showed good selective detection towards the Zn2+ ion with 96.8% and DMF with 97.4%, and these results were obtained in triplicate. The CP-1 and rGO@CP-1 showed better electrochemical energy storage with specific capacity of 244.17 F g−1 and 899.54 F g−1 for CP-1 and rGO@CP-1, respectively, at 1 A g−1 (current density) with a retention stability of rGO@CP-1 of 94.62% up to 2000 cycles. However, rGO@CP-1 has better cycling stability as compared to the as-synthesized electrode material of CP-1. The composite material could be used as a promising electrode material for energy storage applications.
2. Experimental section
2.1 Reagents and materials
1,3-Di(4-pyridyl)propane (DPP) and copper nitrate trihydrate [Cu(NO3)2·3H2O] were procured from Sigma-Aldrich with analytical grade (AR/ACS). All solvents and NaOH were purchased from Thermo Fisher Scientific, India. Also, all the other chemicals were purchased from Thermo Fisher Scientific with AR grade, India, and used without further purification.2.2 Methods and instrumentation
FTIR spectra of CP-1 and rGO@CP-1 were recorded (KBr disk, 4000–400 cm−1) on a Thermo Scientific NICOLET model (iS50). A UV-DRS (Lambda 35 spectrophotometer) instrument was used to record the maxima of CP-1. Thermal study (thermal gravimetric analysis) of CP-1 and rGO@CP-1 was performed on a TGA-50H instrument. To examine the bulk phase purity of CP-1 and rGO@CP-1, powder X-ray diffraction patterns were recorded on a Brucker D8 Advance series 2 powder diffractometer (CuKa radiation scan rate 30/min, 293K). The scanning electron microscopy (SEM) (JEOL JSM-6510 model) coupled with JEOL/EO format was utilized to examine the morphology and particle heterostructure of CP-1 and rGO@CP-1, respectively. The high-resolution transmission electron microscopy (HR-TEM) with EDS mapping and SAED analysis were performed on a TEM Thermo Scientific, Talos F200X G2 of rGO@CP-1. To examine the sensing properties of CP-1, fluorescence emission spectra of CP-1 were performed using an Agilent Cary Eclipse Fluorescence spectrophotometer. The energy storage (electrochemical) properties on charging–discharging of CP-1 and rGO@CP-1 were determined at room temperature using three electrode systems (PGSTAT204 N, Metrohm Autolab, Netherlands).2.3 Single crystal X-ray refinement
The crystallographic data of CP-1 was collected by employing an ‘XtaLAB Synergy, Rigaku, Japan’ at a temperature of 293(2) K. The radiation used was monochromatic Mo-Kα radiation with a wavelength of 0.71073 Å. The International Tables for X-ray Crystallography were consulted in order to obtain the linear absorption coefficients and the anomalous dispersion corrections of the single-crystal structure.48 Olex2 was used to determine the crystal structure, which was then solved with olex-2.solve49 structure solution program by employing charge flipping. Finally, the olex2.refine refinement package was utilized to refine the structure by employing Gauss–Newton minimization technology. The anisotropic displacement parameter was used to refine all of the atoms that were not hydrogen.50 Table S1 (ESI†) provides a summary of the data about the refinement of the crystal structure of CP-1, as well as other information regarding the bond lengths and bond angles of CP-1 (Tables S2 and S3, ESI†).2.4 Synthesis of CP-1
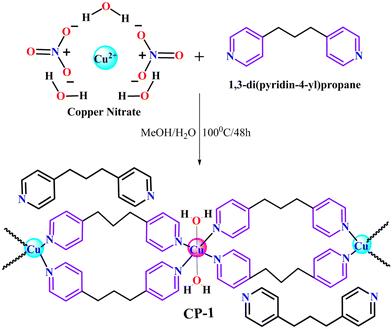
A solvothermal approach was utilized in order to accomplish the development of complex CP-1. 1,3-Di(4-pyridyl)propane (DPP) (50 mg, 0.25 mmol) was thoroughly mixed in 5 mL of methanol using a magnetic stirrer. Following this, two drops of aqueous sodium hydroxide (NaOH) (1 mol) were added in order to modify the slightly alkaline medium. Moreover, the copper nitrate (80 mg, 0.33 mmol) was solubilized in 5 mg of DI water. Furthermore, the copper nitrate solution was added dropwise in the DPP solution to homogenize the solution. Afterward, the resulting solution was transferred into a Teflon-lined stainless steel autoclave and kept at 100 °C for 48 h in a solvothermal oven. After completion of the reaction process, the reaction was cooled down to room temperature, and a clear solution was obtained that was kept for slow evaporation after filtration. After 1–2 weeks, blue colored needle-shaped crystals were obtained, which were suitable for SC-XRD data collection (Scheme 1). Yield 75%, melting point (218 °C), IR (cm−1): 3464 (br), 3068 (m), 2934 (s), 2854 (m), 2467 (s), 1622 (s), 1557 (w), 1512 (w), 1382 (s), 1317 (s), 1233 (s), 1069 (s), 1023 (w), 859 (m), 817 (s), 523 (s), 452 (m).![[thin space (1/6-em)]](https://www.rsc.org/images/entities/char_2009.gif) :
:![[thin space (1/6-em)]](https://www.rsc.org/images/entities/char_2009.gif) 1) was slowly added to concentrated H2SO4 (150 mL) at a low temperature. In addition, the mixture was placed on a magnetic stirrer and maintained at a temperature range of 10–15 °C. Then, the solution of KMnO4 was carefully added drop by drop to the resulting solution. The reaction temperature was kept at room temperature, and the reaction was stirred continuously for 20 hours. This led to the formation of a brownish viscous mixture. Distilled water (250 mL) was added to the mixture to dilute the solution and the temperature was allowed to fall below 50 °C. H2O2 (30%) (10 mL) was added into the resulting mixture solution, and the solution colour was changed into bright yellow colour with bubbles i.e., indication of completion of the reaction. Again, the mixture was stirred for 4 h. After this the mixture was filtered and treated with 10% HCl solution, distilled water and then ethanol to get the pure product. The filtered product (GO) was dried out and 150 mg of this product was used to convert it into graphene oxide by dispersion followed by sonication for 1 h. To reduce this graphene oxide, a solution of NaBH4 (1.5 g NaBH4 into 9 mL distilled water) was added to the earlier formed graphene oxide dispersion. Additionally, the mixture was placed under reflux at a temperature of 100 °C and stirred continuously for 24 hours. Following this step, the mixture underwent filtration and the resulting product was thoroughly rinsed with distilled water and ethanol. After completing the necessary steps, the product was dried in a vacuum oven and its confirmation was obtained through PXRD. Yield 82%, IR (cm−1): 3427 (br), 2922 (s), 2854 (m), 1717 (m), 1573 (m), 1461 (m), 1386 (w), 1221 (br), 1019 (m), 440 (w).
1) was slowly added to concentrated H2SO4 (150 mL) at a low temperature. In addition, the mixture was placed on a magnetic stirrer and maintained at a temperature range of 10–15 °C. Then, the solution of KMnO4 was carefully added drop by drop to the resulting solution. The reaction temperature was kept at room temperature, and the reaction was stirred continuously for 20 hours. This led to the formation of a brownish viscous mixture. Distilled water (250 mL) was added to the mixture to dilute the solution and the temperature was allowed to fall below 50 °C. H2O2 (30%) (10 mL) was added into the resulting mixture solution, and the solution colour was changed into bright yellow colour with bubbles i.e., indication of completion of the reaction. Again, the mixture was stirred for 4 h. After this the mixture was filtered and treated with 10% HCl solution, distilled water and then ethanol to get the pure product. The filtered product (GO) was dried out and 150 mg of this product was used to convert it into graphene oxide by dispersion followed by sonication for 1 h. To reduce this graphene oxide, a solution of NaBH4 (1.5 g NaBH4 into 9 mL distilled water) was added to the earlier formed graphene oxide dispersion. Additionally, the mixture was placed under reflux at a temperature of 100 °C and stirred continuously for 24 hours. Following this step, the mixture underwent filtration and the resulting product was thoroughly rinsed with distilled water and ethanol. After completing the necessary steps, the product was dried in a vacuum oven and its confirmation was obtained through PXRD. Yield 82%, IR (cm−1): 3427 (br), 2922 (s), 2854 (m), 1717 (m), 1573 (m), 1461 (m), 1386 (w), 1221 (br), 1019 (m), 440 (w).
![[thin space (1/6-em)]](https://www.rsc.org/images/entities/char_2009.gif) :
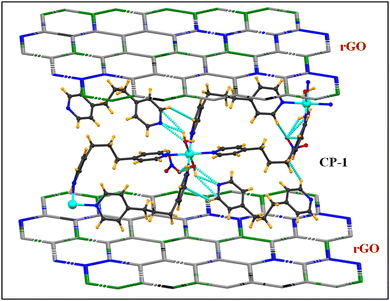
:![[thin space (1/6-em)]](https://www.rsc.org/images/entities/char_2009.gif) 1) (w/w). The appropriate amounts of CP-1 (500 mg) and rGO (50 mg) were added together in a ball milling agate jar (500 mL) and the grinding of the mixture was done under optimized conditions for 60 minutes at a rotational speed of 500 rpm; after that, the color of the mixed powder was changed.44 Furthermore, 2 mL of ethanol was added to homogenize the mixture powder followed by a drying process in a vacuum oven. This process was repeated 2–3 times to get the desired composite (Scheme 2). Then, the powdered form of the composite was characterized. IR (cm−1): 3426 (br), 2919 (m), 2854 (w), 2427 (w), 1619 (s), 1389 (s), 1313 (m), 1227 (m), 1035 (s), 810 (m), 520 (m), 444 (m).
1) (w/w). The appropriate amounts of CP-1 (500 mg) and rGO (50 mg) were added together in a ball milling agate jar (500 mL) and the grinding of the mixture was done under optimized conditions for 60 minutes at a rotational speed of 500 rpm; after that, the color of the mixed powder was changed.44 Furthermore, 2 mL of ethanol was added to homogenize the mixture powder followed by a drying process in a vacuum oven. This process was repeated 2–3 times to get the desired composite (Scheme 2). Then, the powdered form of the composite was characterized. IR (cm−1): 3426 (br), 2919 (m), 2854 (w), 2427 (w), 1619 (s), 1389 (s), 1313 (m), 1227 (m), 1035 (s), 810 (m), 520 (m), 444 (m).
2.5. Fabrication of electrodes
The electrochemical evaluation of the CP-1 and composite materials was performed using a three-electrode setup, with 1 M H2SO4 as the electrolyte. The Ag/AgCl electrode has been identified as the reference electrode, while a platinum wire serves as the counter electrode. A composite blend consisting of 80% CP-1 and rGO@CP-1 materials, 10% acetylene black, and 10% polytetrafluoroethylene was prepared for the fabrication of the working electrodes. The produced slurry was used to coat a piece of carbon fabric measuring 2 × 1 cm2. After creating the electrodes, we conducted a thorough electrochemical analysis utilizing several techniques such as cyclic voltammetry (CV), galvanostatic charge–discharge (GCD), and electrochemical impedance spectroscopy (EIS). These measurements were performed using an Autolab potentiostat acquired from the Netherlands. The evaluations were performed at ambient temperature, extensively examining the electrochemical characteristics of the electrode materials manufactured in their original form.3. Results and discussion
3.1 Structural description and topological analysis of CP-1
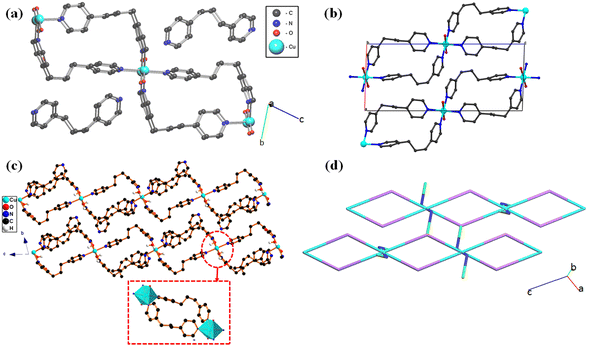
The crystal structure of CP-1 was confirmed by utilizing single crystal X-ray diffraction (SCXRD) which reveals that the structure was crystallized in the triclinic crystal system with P![[1 with combining overline]](https://www.rsc.org/images/entities/char_0031_0305.gif) space group. The asymmetric unit of CP-1 consists of two Cu(II) ions (both Cu1 and Cu2 have 0.5 crystallographic occupancies), three [1,3-di(4-pyridyl)propane] (DPP) ligands, in which two are coordinated with the copper(II) metal ion and the third is uncoordinated, and two nitrate ions in the lattice (Fig. 1a). Cu1 and Cu2 ions have a distorted octahedral geometry surrounded by four nitrogen atoms of the DPP linker and two oxygen atoms of coordinated water molecules (Fig. 1c). The extended connectivity represents a one-dimensional staircase-like polymer network. Hydrogen bonding and C–H⋯π interactions led to a three-dimensional supramolecular network (Fig. 1b). The topological analysis was examined with the help of ToposPro software.55,56 The standard rod net representation of CP-1 shows a 1,3M4-1 underlying net for the two fragments. Furthermore, the simplified TTD collection of the hydrogen bonded network of CP-1 represents the point symbol (PS) {0}; 2-c nimodal net with 2C1 topology (Fig. 1d).
space group. The asymmetric unit of CP-1 consists of two Cu(II) ions (both Cu1 and Cu2 have 0.5 crystallographic occupancies), three [1,3-di(4-pyridyl)propane] (DPP) ligands, in which two are coordinated with the copper(II) metal ion and the third is uncoordinated, and two nitrate ions in the lattice (Fig. 1a). Cu1 and Cu2 ions have a distorted octahedral geometry surrounded by four nitrogen atoms of the DPP linker and two oxygen atoms of coordinated water molecules (Fig. 1c). The extended connectivity represents a one-dimensional staircase-like polymer network. Hydrogen bonding and C–H⋯π interactions led to a three-dimensional supramolecular network (Fig. 1b). The topological analysis was examined with the help of ToposPro software.55,56 The standard rod net representation of CP-1 shows a 1,3M4-1 underlying net for the two fragments. Furthermore, the simplified TTD collection of the hydrogen bonded network of CP-1 represents the point symbol (PS) {0}; 2-c nimodal net with 2C1 topology (Fig. 1d).
3.2 FT-IR, PXRD, SEM, HR-TEM and TGA analysis
The crystal structure of CP-1 was determined by the single crystal X-ray technique. Moreover, chemical and physical behaviors such as phase purity, functionality, particle morphology, and thermal stability of the synthesized CP-1 and rGO@CP-1 were established by PXRD, FTIR, SEM, and TGA techniques. The UV-DRS spectrum of CP-1 showed maximum absorbance at 295 nm corresponding to π → π* transition (Fig. S1, ESI†). The FT-IR studies show vibrational bands of different intensities due to Cu–O, Cu–N, C![[double bond, length as m-dash]](https://www.rsc.org/images/entities/char_e001.gif) C, C–H, and C
C, C–H, and C![[double bond, length as m-dash]](https://www.rsc.org/images/entities/char_e001.gif) N bonds. The Fourier transform infrared (FTIR) spectra of the CP-1 and rGO@CP-1 composite showed a broad band at 3464 and 3426 cm−1 that could be attributed to the presence of hydroxide (–OH) functional groups. Asymmetric and symmetric vibration bands of CP-1 and rGO@CP-1 at 1622, 1619 cm−1 and 1382 cm−1, 1389 cm−1 could be assigned to the presence of υasy COO− and υsy COO− functional groups, respectively.41 The vibrational absorption bands at 523 and 520 cm−1 could be due to the presence of the Cu–O bond. Vibration frequencies at 452 and 444 cm−1 can be attributed to the Cu–N bond.41,57 Similarly, the vibrational frequency of rGO at 3435 cm−1 is due to the presence of –OH functional groups. A strong band appeared at 1725 cm−1 corresponding to the C
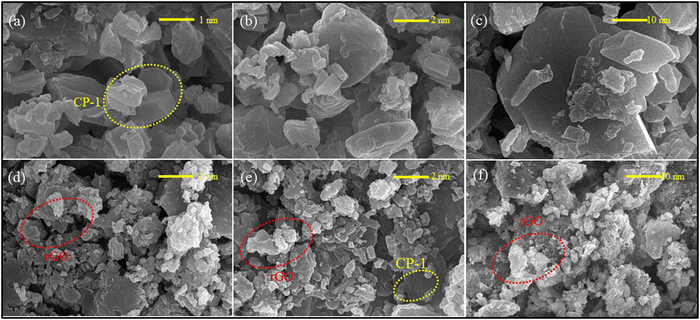
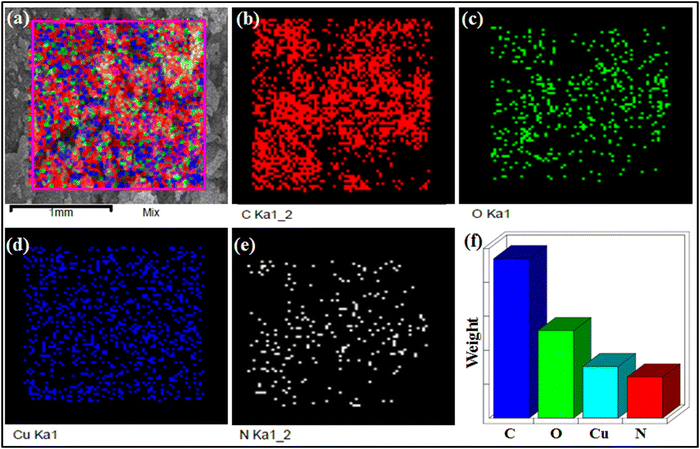
N bonds. The Fourier transform infrared (FTIR) spectra of the CP-1 and rGO@CP-1 composite showed a broad band at 3464 and 3426 cm−1 that could be attributed to the presence of hydroxide (–OH) functional groups. Asymmetric and symmetric vibration bands of CP-1 and rGO@CP-1 at 1622, 1619 cm−1 and 1382 cm−1, 1389 cm−1 could be assigned to the presence of υasy COO− and υsy COO− functional groups, respectively.41 The vibrational absorption bands at 523 and 520 cm−1 could be due to the presence of the Cu–O bond. Vibration frequencies at 452 and 444 cm−1 can be attributed to the Cu–N bond.41,57 Similarly, the vibrational frequency of rGO at 3435 cm−1 is due to the presence of –OH functional groups. A strong band appeared at 1725 cm−1 corresponding to the C![[double bond, length as m-dash]](https://www.rsc.org/images/entities/char_e001.gif) O functional group. Other vibrational frequencies at 606, 503, and 420 cm−1 could be attributed to the presence of triclinic phase formation of rGO (Fig. S2, ESI†). To identify the structural integrity in the bulk phase of CP1, the powder X-ray diffraction (PXRD) pattern was performed, which was well matched with the simulated pattern of CP-1 (Fig. S3a, ESI†). Similarly, the PXRD pattern of rGO was well matched at 24.10° (002) and 43.41° (100) that is situated within range.58 The rGO peaks at 2θ (24.10°) suggested that rGO is obtained in fully reduced form with a 3.5 Å interlayer distance, which indicates that the polyhydrocarbon template is not present.59 Moreover, shifting of particular peaks at 24.68° and 43.77° in rGO@CP-1 indicated that the addition of rGO over CP-1 was done successfully with the stacking layer pattern (Fig. S3b, ESI†). Thermal stability of CP-1 was examined by using TGA analysis under a N2 atmosphere at the rate of 10 °C min−1. The TGA curve reveals an initial weight loss (∼4.5%) of CP-1 up to 100–165 °C due to elimination of lattice and coordinated water molecules. Another weight loss (calcd. 38.6%) occurs up to 290 °C corresponding to the elimination of the DPP organic ligand of the lattice. Furthermore, weight loss occurs due to the elimination of nitrate molecules up to ∼500 °C and after that the framework collapses. Similarly, the thermal analysis of rGO@CP-1 follows the same decomposition pattern as that of CP-1 (Fig. S4, ESI†). This could be attributed to weak interactions between CP-1 and the rGO functionality. The surface morphology of CP-1 and rGO@CP-1 was analyzed by SEM analysis at different magnification ranges. The SEM analysis of CP-1 showed flakes with a disoriented structural morphology at different magnification ranges (Fig. 2a–c). The flaky type morphology could provide more reactive sites with more reaction compatibility for better electrochemical reaction.41 Similarly, SEM analysis of rGO@CP-1 showed adhesive clump formation of reduced graphene oxide at the surface of CP-1 due to weak interaction between them. As per the morphology of rGO@CP-1, rGO successfully interacted over the CP-1 particles (Fig. 2d–f). The structural morphology of rGO showed a sheet-like structure at different magnification ranges (Fig. S5a, ESI†). Furthermore, the compositions of CP-1 (Fig. 3) and rGO@CP-1 (Fig. S5b, ESI†) were authenticated by elemental mapping of particular elements in the 1 mm range. The mapping of rGO@CP-1 showed a slightly high composition of carbon and oxygen that could be an indication of successive composite formation. In the fabrication of rGO@CP-1, weak interactions could play the main role.44 Moreover, the fabrication of rGO@CP-1 was also confirmed by HR-TEM analysis with EDX, which indicated the uniform deposition of CP-1 on the surface of rGO (Fig. 4). The loaded particles of CP-1 showed an irregular circular shape with a good particle size of 15–25 nm. The single particle image clearly showed the lattice fringes that were devoted to the presence of copper metal with a lattice spacing of about 0.33 nm (Fig. S5c, ESI†).60
O functional group. Other vibrational frequencies at 606, 503, and 420 cm−1 could be attributed to the presence of triclinic phase formation of rGO (Fig. S2, ESI†). To identify the structural integrity in the bulk phase of CP1, the powder X-ray diffraction (PXRD) pattern was performed, which was well matched with the simulated pattern of CP-1 (Fig. S3a, ESI†). Similarly, the PXRD pattern of rGO was well matched at 24.10° (002) and 43.41° (100) that is situated within range.58 The rGO peaks at 2θ (24.10°) suggested that rGO is obtained in fully reduced form with a 3.5 Å interlayer distance, which indicates that the polyhydrocarbon template is not present.59 Moreover, shifting of particular peaks at 24.68° and 43.77° in rGO@CP-1 indicated that the addition of rGO over CP-1 was done successfully with the stacking layer pattern (Fig. S3b, ESI†). Thermal stability of CP-1 was examined by using TGA analysis under a N2 atmosphere at the rate of 10 °C min−1. The TGA curve reveals an initial weight loss (∼4.5%) of CP-1 up to 100–165 °C due to elimination of lattice and coordinated water molecules. Another weight loss (calcd. 38.6%) occurs up to 290 °C corresponding to the elimination of the DPP organic ligand of the lattice. Furthermore, weight loss occurs due to the elimination of nitrate molecules up to ∼500 °C and after that the framework collapses. Similarly, the thermal analysis of rGO@CP-1 follows the same decomposition pattern as that of CP-1 (Fig. S4, ESI†). This could be attributed to weak interactions between CP-1 and the rGO functionality. The surface morphology of CP-1 and rGO@CP-1 was analyzed by SEM analysis at different magnification ranges. The SEM analysis of CP-1 showed flakes with a disoriented structural morphology at different magnification ranges (Fig. 2a–c). The flaky type morphology could provide more reactive sites with more reaction compatibility for better electrochemical reaction.41 Similarly, SEM analysis of rGO@CP-1 showed adhesive clump formation of reduced graphene oxide at the surface of CP-1 due to weak interaction between them. As per the morphology of rGO@CP-1, rGO successfully interacted over the CP-1 particles (Fig. 2d–f). The structural morphology of rGO showed a sheet-like structure at different magnification ranges (Fig. S5a, ESI†). Furthermore, the compositions of CP-1 (Fig. 3) and rGO@CP-1 (Fig. S5b, ESI†) were authenticated by elemental mapping of particular elements in the 1 mm range. The mapping of rGO@CP-1 showed a slightly high composition of carbon and oxygen that could be an indication of successive composite formation. In the fabrication of rGO@CP-1, weak interactions could play the main role.44 Moreover, the fabrication of rGO@CP-1 was also confirmed by HR-TEM analysis with EDX, which indicated the uniform deposition of CP-1 on the surface of rGO (Fig. 4). The loaded particles of CP-1 showed an irregular circular shape with a good particle size of 15–25 nm. The single particle image clearly showed the lattice fringes that were devoted to the presence of copper metal with a lattice spacing of about 0.33 nm (Fig. S5c, ESI†).60
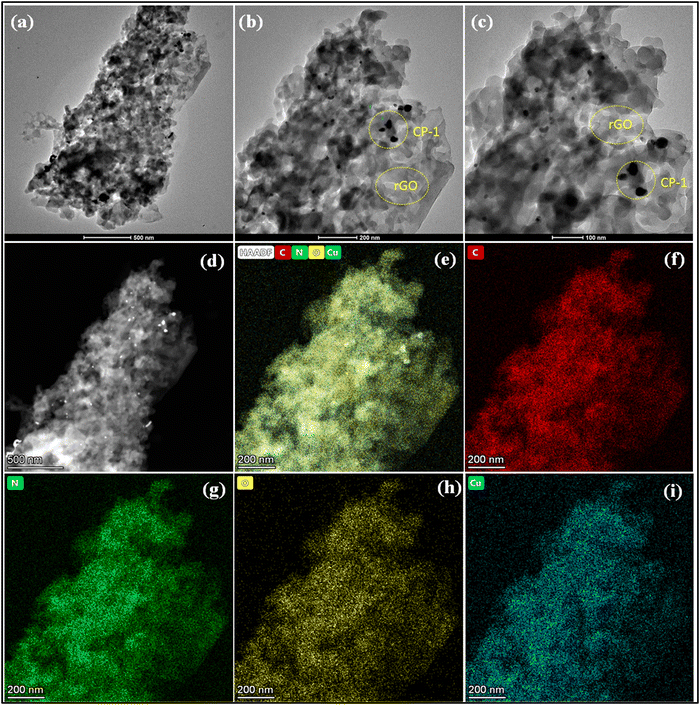 | ||
| Fig. 4 HR-TEM image of rGO@CP-1 at different magnification ranges (a)–(c), HAADF image of the selected area at 500 nm magnification range (d), and elemental mapping of rGO@CP-1 (e)–(i). | ||
3.3. Luminescence sensing
A finely ground sample of CP-1 weighing 3 mg was placed in 4 mL of various solvents for luminescence measurements. The mixture underwent ultrasonication for 25 minutes and was allowed to age for 24 hours, resulting in the formation of stable suspensions. The suspensions were analyzed for their emission spectra at room temperature, covering a wavelength range of 200–600 nm. The measurements were conducted with illumination at 300 nm. The luminescence intensities of the CP-1 suspension varied depending on the solvent molecules used. The emission intensity of EtOH of CP-1 was significantly high at 360 nm when excited at 300 nm. The luminescence experiments were conducted in EtOH solution of various metal ions using CP-1. CP-1 (3 mg) was placed in 4 mL of various metal cations M(NO3)x, in EtOH with a concentration of 5 × 10⁻⁴ M (M = Co2+, Cd2+, Zn2+, Fe3+). In addition, the mixed solutions underwent ultrasonication for 25 minutes before being used for luminescence recognition measurements. Eqn (1) is used to calculate the luminescence quenching efficiency (Q).61| Q(%) = {(I0 − I)/I0} × 100 | (1) |
The luminescence emission intensities prior to and following the addition of solvents or metal ions are denoted by the symbols I0 and I, respectively.
 | ||
| Fig. 5 (a) Luminescence emission intensities and (b) luminescence quenching efficiencies for CP-1 in the presence of different organic solvents. | ||
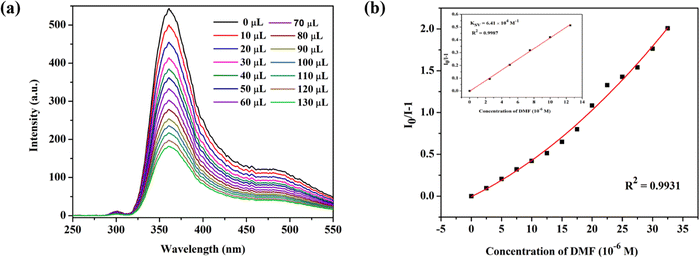
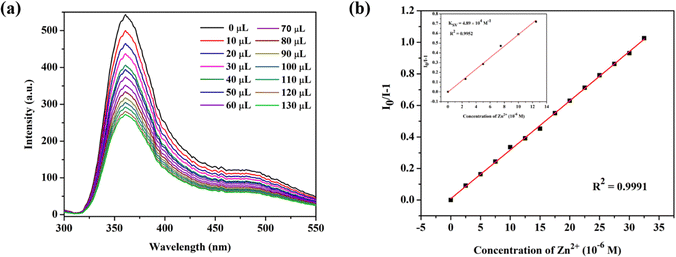
To investigate the luminescent reactions of CP-1 with various metal cations, the CP-1 was immersed in EtOH solution containing the same concentration (5 × 10⁻⁴ M) of different metal cations. After 24 hours, the resulting luminescent spectra were recorded. Fig. 7a displays the relative luminescence intensities of CP-1. The efficiency of relative luminescence quenching for metal ions was observed as follows: 28.7% for Co2+, 53.2% for Cd2+, 88.5% for Fe3+, and 96.8% for Zn2+, as shown in Fig. 7b. To find out the limit of detection (LOD) of Zn2+ in EtOH medium, a quantitative fluorescence titration experiment was conducted. Drop by drop additions of aqueous solutions (1 mM) of Zn2+ were made to a stable CP-1 dispersion solution. After stabilization, the fluorescence intensity was measured independently. When the Zn2+ concentration was increased, there was a noticeable decrease in fluorescence intensity (Fig. 8a). The experimental data shows a high linear correlation coefficient (R2 = 0.9952) for Zn2+. Additionally, the calculated result of Ksv at low concentration is 4.89 × 10⁴ M−1 for Zn2+ (Fig. 8b). The minimum detection limit is 5.31 × 10⁻⁶ (0.171 ppm) at 360 nm wavelength.
 | ||
| Fig. 7 (a) Luminescence emission intensities and (b) luminescence quenching efficiencies of CP-1 dispersed in different metal ion EtOH solutions (5 × 10⁻⁴ M) at 360 nm. | ||
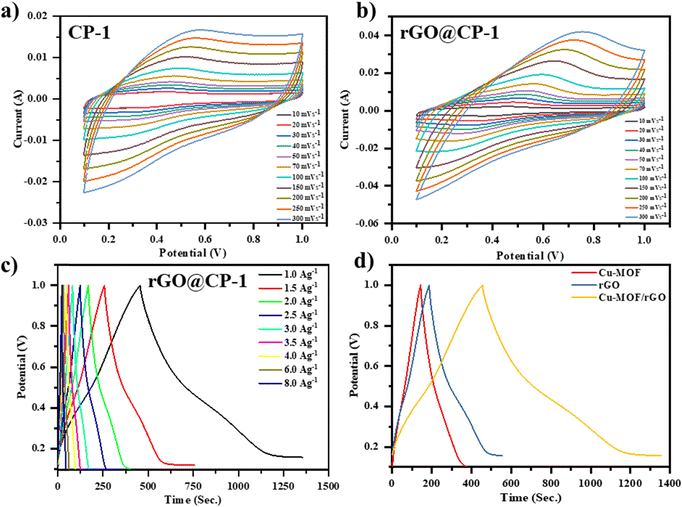
Fig. 10a illustrates the CV plots of the prepared working electrodes across various scan rates ranging from 10–300 mV s−1. Notably, the region beneath each curve of the CV expands as the scan rates increase across both electrodes. Remarkably, the incorporated area of the composite electrode exceeds that of the other electrode, showing a considerable increase in specific capacitance due to the synergistic interaction of CP-1 crystals and rGO sheets. The CV profile of rGO@CP-1 reveals distinct redox peaks attributed to the pseudo-capacitive behaviour of CP-1 (Fig. 10b). However, the electrode tends to adopt a semi-rectangular form at higher scan rates, indicating that electrolyte ions are diffusing more quickly. This phenomenon likely contributes to an increased charge storage capacity, as depicted in Fig. 10b. The structure of CP-1 increases the area of contact and modes in the system, allowing for more efficient charge transfer.53,54,70 However, the inherent low conductivity of CP-1 limits its application in electrochemical contexts. Hence, the introduction of rGO alongside CP-1 enhances the hybrid's conductivity. The wavy surface of rGO, with wrinkles preventing restacking, substantially improves conductivity by shortening the ion diffusion paths, thereby enhancing the electrochemical response.71 The comparison of the CV profiles at 100 mV s−1 scan rate demonstrates the beneficial synergistic interaction between rGO sheets and CP-1. This synergy facilitates efficient charge transfer, leading to an augmented integrated area and confirming the collaborative impact of both rGO sheets and CP-1.
GCD analysis was performed within a potential window of 0–1.0 V at current densities ranging from 1 to 8 A g−1 to evaluate the capacitive behavior of the fabricated electrodes (rGO, CP-1, and rGO@CP-1) in a 1 M H2SO4 aqueous electrolyte solution, as shown in Fig. S7(a and b) (ESI†) and Fig. 10c. The comparison of the charging–discharging profiles for prepared electrodes is depicted in Fig. 10d. rGO@CP-1 exhibits a good discharging time, which indicates a better specific capacitance than the earlier reported electrode materials used in supercapacitor applications. The discharging time decreases with increasing current density and reducing the capacitance. Specifically, at a current density of 1 A g−1, CP-1, rGO, and rGO@CP-1 demonstrate specific capacitance values of 244.17 F g−1, 408.07 F g−1 and 899.54 F g−1.72 The as-synthesized composite electrode material delivers remarkably high specific capacitance due to the synergistic effect among rGO and CP-1, and a comparative study was done (Table 1).
| S. no. | MOF | Electrolyte | Current density (A g−1) | Capacitance (F g−1) | Ref. |
| 1. | Cu-MOF@ACNF | 1 M H2SO4 | 1.0 | 303.2 | 73 |
| 2. | [Cu3(Azopy)3(BTTC)3(H2O)3·2H2O]n | 1 M Na2SO4 | 0.8 | 244.2 | 74 |
| 3. | Cu-MOF-1 | 6 M KOH | 1.0 | 181 | 75 |
| Cu-MOF-2 | 248 | ||||
| 4. | Cu-MOF based APC | 6 M KOH | 0.5 | 260.5 | 76 |
| 5. | Cu-MOF@rGO (HMRL-1/R) | 1 M Na2SO4 | 1.0 | 366.6 | 77 |
| 6. | Cu-DBC | 1 M NaCl | 0.2 | 479 | 78 |
| 7. | CuMOF/rGO | 1 M Na2SO4 | 0.8 | 462 | 44 |
| 8. | CuO@CP-1 | 1 M H2SO4 | 1.0 | 602.25 | 54 |
| 9. | Cu(II) CP-1 | 1 M H2SO4 | 1.0 | 244.17 | This work |
| CP-1@rGO | 899.54 |
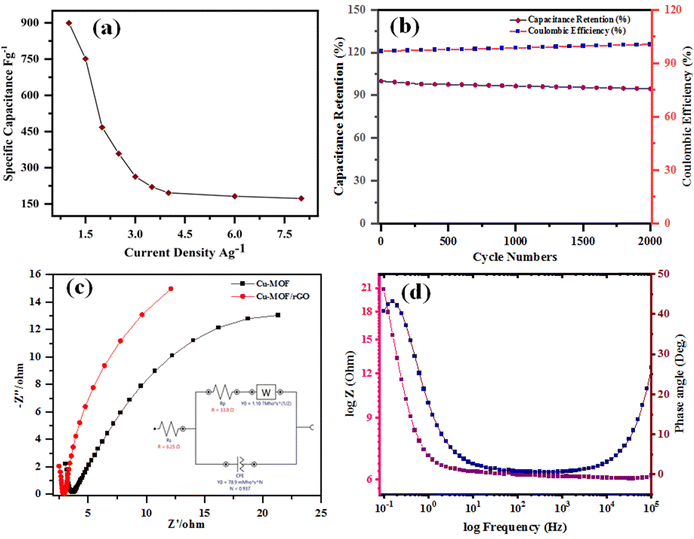
Furthermore, the efficiency of the electrodes is assessed by graphing specific capacitance vs. current density (Fig. 11a), which reveals a reduction in charge storage ability with increasing current density due to insufficient occupancy of active ionic species. The stability of the composite material (rGO@CP-1) was evaluated through  and Coulombic efficiency (CE), which was determined using the formula
  and was reported to be 98.6% with a capacity retention of 94.62% after 2000 charge–discharge cycles at 8.0 A g−1 current density, as shown in Fig. 11b.52,79,80 This performance is attributable to the efficient facilitation of electrolyte ion transport inside the open-linked structure rGO@CP-1 during rapid charging–discharging processes. Additionally, the resilient design of the rGO@CP-1 spread on the outer surface of carbon cloth, induced synergistically, contributes to this outstanding outcome.
However, the rapid delivery of electrons and ions in the rGO@CP-1 electrode can be attributed to its lower series resistance (Rs, encompassing solution resistance, contact resistance, etc.) and charge-transfer resistance (Rct). Electrical resistance is a crucial parameter for evaluating SC electrodes, quantitatively determined by EIS over a frequency range of 100 kHz to 0.01 Hz at 10 mV potential amplitude, as depicted in Fig. 11c. Generally, the Nyquist plots for CP-1 and rGO@CP-1 electrodes exhibit similar patterns, consisting of a slight semicircle in the high-frequency region and a straight line in the low-frequency region, indicating diffusion control.81 By using Nova software for calculation and modulation, the EIS data were accurately fitted to an equivalent circuit, shown in the inset of Fig. 11c. The Rs values for CP-1 and rGO@CP-1, calculated from the points where the curves intersect the Z′ axis (real axis), were 1.97 Ω and 6.25 Ω, respectively. Furthermore, the Rct values determined and simulated using Nova software were approximately 5.93 Ω and 33.8 Ω. These results confirm that a lower concentration and extended soaking period are optimal conditions for synthesizing composite electrodes. Notably, the rGO@CP-1 composite displays a lower Rs value as compared to CP-1. Significantly, the fabricated composite material exhibits a small Rct compared to the CP-1 material, indicating minimal Rct at the electrolyte/electrode interface, attributed to the porous structure of the composite material.
In addition, the Bode plots of phase angle versus frequency and total impedance versus frequency are shown in Fig. 11d. Among the as-prepared electrode materials, the rGO@CP-1 exhibited the highest phase angle of 40° in the low-frequency region, indicating a higher degree of pseudocapacitive behavior, which aligns with the results from CV and GCD measurements. This higher phase angle suggests more efficient electrolyte ion transport, producing the highest pseudocapacitive response. The plot of real impedance versus frequency shows different slopes across various frequency regions. All synthesized electrode materials exhibited an almost zero slope at high frequencies, indicating that the resistance at the electrode–electrolyte interface is dominant. In the low-frequency region, the electrodes displayed a purely capacitive nature without any resistance, suggesting that this composite electrode has both capacitive and resistive features.
Consequently, the capacitive behaviour is suppressed at high frequencies, and the resistive component becomes dominant, resulting in a phase angle of 26°. This study demonstrates that the rGO@CP-1 electrode is promising for supercapacitors. The CV, GCD, and EIS characterization studies of the rGO@CP-1 composite reveal that this electrode material possesses good capacitive behavior.
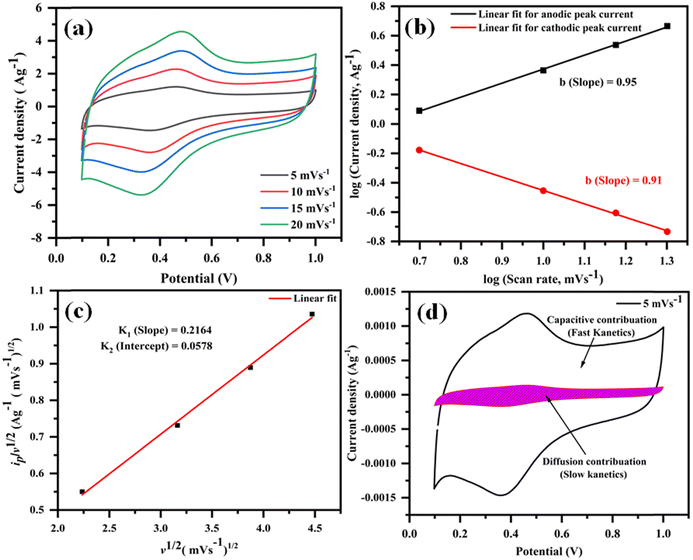
Moreover, to delve further into the energy storage mechanism of the optimized electrode material (rGO@CP-1), we analyzed the CV curves obtained at various scan rates in 1 M H2SO4 (Fig. 12a). Using the power law equation, we aimed to distinguish between diffusion-controlled faradaic redox (pseudocapacitance) and capacitive (EDLC) processes.82
ip = avb or log![[thin space (1/6-em)]](https://www.rsc.org/images/entities/char_2009.gif) ip = log ip = log![[thin space (1/6-em)]](https://www.rsc.org/images/entities/char_2009.gif) a + b a + b![[thin space (1/6-em)]](https://www.rsc.org/images/entities/i_char_2009.gif) log log![[thin space (1/6-em)]](https://www.rsc.org/images/entities/char_2009.gif) v v |
In this equation, “ip” represents the peak current, and “ν” corresponds to the scan rate. By plotting![[thin space (1/6-em)]](https://www.rsc.org/images/entities/char_2009.gif) log
log![[thin space (1/6-em)]](https://www.rsc.org/images/entities/char_2009.gif) ip against
ip against![[thin space (1/6-em)]](https://www.rsc.org/images/entities/char_2009.gif) log
log![[thin space (1/6-em)]](https://www.rsc.org/images/entities/char_2009.gif) ν, we obtain the slope (b) and intercept (log
ν, we obtain the slope (b) and intercept (log![[thin space (1/6-em)]](https://www.rsc.org/images/entities/char_2009.gif) a) values (Fig. 12b). These values offer crucial insights into the charge storage mechanism. Specifically, the slope (b) equals 0.5, indicating that the diffusion-controlled faradaic process predominantly governs the charge storage. Alternatively, if the value of b is 1, it suggests that the capacitive process dominates the reaction. However, when b falls between 0.5 and 1, diffusion-controlled and capacitive (EDLC) processes contribute to the overall storage mechanism.83,84 Analysis of the plot of
a) values (Fig. 12b). These values offer crucial insights into the charge storage mechanism. Specifically, the slope (b) equals 0.5, indicating that the diffusion-controlled faradaic process predominantly governs the charge storage. Alternatively, if the value of b is 1, it suggests that the capacitive process dominates the reaction. However, when b falls between 0.5 and 1, diffusion-controlled and capacitive (EDLC) processes contribute to the overall storage mechanism.83,84 Analysis of the plot of![[thin space (1/6-em)]](https://www.rsc.org/images/entities/char_2009.gif) log
log![[thin space (1/6-em)]](https://www.rsc.org/images/entities/char_2009.gif) ipversus
ipversus![[thin space (1/6-em)]](https://www.rsc.org/images/entities/char_2009.gif) log
log![[thin space (1/6-em)]](https://www.rsc.org/images/entities/char_2009.gif) ν, recorded for the anodic and cathodic peaks at 0.48 V and 0.36 V, reveals b values of 0.95 and 0.91, respectively (Fig. 12b). This observation indicates that the charge storage mechanism involves diffusive and EDLC processes. Moreover, an analysis of diffusive and capacitive behavior is conducted using the Dunn equation: ip = k1v + k2v1/2, where ip denotes the current at a particular voltage, and k1v and k2v1/2 signify the capacitive and diffusive contributions, respectively. Using this equation, a plot of
ν, recorded for the anodic and cathodic peaks at 0.48 V and 0.36 V, reveals b values of 0.95 and 0.91, respectively (Fig. 12b). This observation indicates that the charge storage mechanism involves diffusive and EDLC processes. Moreover, an analysis of diffusive and capacitive behavior is conducted using the Dunn equation: ip = k1v + k2v1/2, where ip denotes the current at a particular voltage, and k1v and k2v1/2 signify the capacitive and diffusive contributions, respectively. Using this equation, a plot of  vs.
vs.  (see Fig. 12c) results in a straight line. From this plot, the values of capacitive (k1v) and diffusive (k2v1/2) contributions at a scan rate of 5 mV s−1 were determined to be approximately 88% and 12%, respectively (Fig. 12d).
4. Conclusion
In summary, synthesis of a new 1D coordination polymer, {[Cu2(DPP)2(H2O)2]·DPP·2NO3}n (CP-1), and its composite (rGO@CP-1) was done via solvothermal and ball milling approaches, respectively. CP-1 showed a 2C1 underlying net topology. CP-1 demonstrates excellent selective fluorescence detection capabilities for transition metal ions (Zn2+) and solvents. Furthermore, CP-1 and its composite (rGO@CP-1) exhibited favorable electrochemical energy storage capabilities in 1 M H2SO4 electrolytes. However, the composite demonstrates a notable specific capacitance, along with exceptional cycling stability and a low Rct value. So, CP-1 has potential applications in the detection of selective solvents as well as electrochemical energy storage. Moreover, the composite of CP-1 could be utilized as a promising electrode material for energy storage.Author contributions
Basree: writing – original draft, data curation, formal analysis; Waris: electrochemical & formal analysis; A. Ali: writing – origin draft, data curation, conceptualization, methodology, review & editing; N. Khan: formal analysis, data curation; M. Z. Khan: formal & electrochemistry analysis; G. C. Nayak: formal analysis; K. A. Siddiqui: visualization, writing – review & editing; M. Ahmad: supervision, conceptualization, methodology, software, formal analysis, writing – review & editing.Data availability
Data available on request or similar; supporting information is available in the additional files and further supporting data is available from the authors on request.Conflicts of interest
The authors declare that they have no known competing financial interests or personal relationships that could have appeared to influence the work reported in this paper.Acknowledgements
The authors are thankful to the Department of Applied Chemistry, Faculty of Engineering and Technology, Aligarh Muslim University, U.P., India for providing research facilities. Basree is thankful to the DST/INSPIRE Fellowship/2021/IF210635. Waris thanks the UGC for the Non-NET Fellowship. A. Ali also thanks the Institute Post-Doctoral fellowship (DAR/IPDF/CCB/53/2023), Indian Institute of Technology (ISM), Dhanbad. M. A. acknowledges the Start-up grants from the UGC, India.References
- E. J. Nixon, A. Jayapaul, R.-J. Chung, S. Rajkumar and J. P. Merlin, J. Electroanal. Chem., 2024, 953, 118014 CrossRef CAS.
- H. Liang, Y. Liu, F. Zuo, C. Zhang, L. Yang, L. Zhao, Y. Li, Y. Xu, T. Wang, X. Hua, Y. Zhu and H. Li, Chem. Sci., 2022, 13, 14191–14197 RSC.
- X. Cao, C. Tan, M. Sindoro and H. Zhang, Chem. Soc. Rev., 2017, 46, 2660–2677 RSC.
- Y. Ma, L. Zhang, Z. Yan, B. Cheng, J. Yu and T. Liu, Adv. Energy Mater., 2022, 12, 2103820 CrossRef CAS.
- T. Sun, L. Xu, D. Wang and Y. Li, Nano Res., 2019, 12, 2067–2080 CrossRef CAS.
- H. Bin Wu and X. W. (David) Lou, Sci. Adv., 2017, 3(12), eaap9252 CrossRef PubMed.
- L. Li, Y. Zheng, S. Zhang, J. Yang, Z. Shao and Z. Guo, Energy Environ. Sci., 2018, 11, 2310–2340 RSC.
- P. Xiao, F. Bu, R. Zhao, M. F. Aly Aboud, I. Shakir and Y. Xu, ACS Nano, 2018, 12, 3947–3953 CrossRef CAS PubMed.
- J.-H. Yoon, Y. A. Kumar, S. Sambasivam, S. A. Hira, T. N. V. Krishna, K. Zeb, W. Uddin, K. D. Kumar, I. M. Obaidat, S. Kim and H.-J. Kim, J. Energy Storage, 2020, 32, 101988 CrossRef.
- M. D. Angelin, S. Rajkumar, S. Dhineshkumar, A. T. Ravichandran, A. Ravikumar and J. P. Merlin, J. Mater. Sci.: Mater. Electron., 2023, 34, 1107 CrossRef CAS.
- M. Moniruzzaman, Y. Anil Kumar, M. R. Pallavolu, H. M. Arbi, S. Alzahmi and I. M. Obaidat, Nanomaterials, 2022, 12, 3187 CrossRef CAS PubMed.
- Z. Lu, L. Wen, Z. Ni, Y. Li, H. Zhu and Q. Meng, Cryst. Growth Des., 2007, 7, 268–274 CrossRef CAS.
- S. Guo, Y. Zhu, Y. Yan, Y. Min, J. Fan, Q. Xu and H. Yun, J. Power Sources, 2016, 316, 176–182 CrossRef CAS.
- J. Liu, D. Zhu, C. Guo, A. Vasileff and S. Qiao, Adv. Energy Mater., 2017, 7(23), 1700518 CrossRef.
- T. Mehtab, G. Yasin, M. Arif, M. Shakeel, R. M. Korai, M. Nadeem, N. Muhammad and X. Lu, J. Energy Storage, 2019, 21, 632–646 CrossRef.
- Z.-J. Lin, J. Lü, M. Hong and R. Cao, Chem. Soc. Rev., 2014, 43, 5867–5895 RSC.
- A. J. Howarth, Y. Liu, P. Li, Z. Li, T. C. Wang, J. T. Hupp and O. K. Farha, Nat. Rev. Mater., 2016, 1, 15018 CrossRef CAS.
- H.-C. Zhou, J. R. Long and O. M. Yaghi, Chem. Rev., 2012, 112, 673–674 CrossRef CAS PubMed.
- M. Lippi and M. Cametti, Coord. Chem. Rev., 2021, 430, 213661 CrossRef CAS.
- J. Duan, Q. Li and Z. Lu, CrystEngComm, 2015, 17, 2087–2090 RSC.
- V. Jabbari, J. M. Veleta, M. Zarei-Chaleshtori, J. Gardea-Torresdey and D. Villagrán, Chem. Eng. J., 2016, 304, 774–783 CrossRef CAS.
- M.-R. Yin, Q.-Q. Yan, B. Li and G.-P. Yong, CrystEngComm, 2021, 23, 3196–3203 RSC.
- Y. K. Hwang, D. Hong, J. Chang, S. H. Jhung, Y. Seo, J. Kim, A. Vimont, M. Daturi, C. Serre and G. Férey, Angew. Chem., 2008, 120, 4212–4216 CrossRef.
- S. He, L. Wu, X. Li, H. Sun, T. Xiong, J. Liu, C. Huang, H. Xu, H. Sun, W. Chen, R. Gref and J. Zhang, Acta Pharm. Sin. B, 2021, 11, 2362–2395 CrossRef CAS PubMed.
- Y. Zhang, S. Yuan, G. Day, X. Wang, X. Yang and H.-C. Zhou, Coord. Chem. Rev., 2018, 354, 28–45 CrossRef CAS.
- X. Zhang, W. Wang, Z. Hu, G. Wang and K. Uvdal, Coord. Chem. Rev., 2015, 284, 206–235 CrossRef CAS.
- A. Ali, M. Muslim, I. Neogi, M. Afzal, A. Alarifi and M. Ahmad, ACS Omega, 2022, 7, 24438–24451 CrossRef CAS PubMed.
- K. Li, Y. Qin, Z.-G. Li, T.-M. Guo, L.-C. An, W. Li, N. Li and X.-H. Bu, Coord. Chem. Rev., 2022, 470, 214692 CrossRef CAS.
- M. Jakoby, C. Beil, P. Nazari, B. S. Richards, M. Seitz, A. Turshatov and I. A. Howard, iScience, 2021, 24, 102207 CrossRef CAS PubMed.
- T. Fan, T. Xia, Q. Zhang, Y. Cui, Y. Yang and G. Qian, Microporous Mesoporous Mater., 2018, 266, 1–6 CrossRef CAS.
- N. Levaot and M. Hershfinkel, Cell Calcium, 2018, 75, 53–63 CrossRef CAS PubMed.
- M. Sethupathi, A. Jayamani, G. Muthusankar, P. Sakthivel, K. Sekar, S. Gandhi, N. Sengottuvelan, G. Gopu and C. Selvaraju, J. Photochem. Photobiol., B, 2020, 207, 111854 CrossRef CAS PubMed.
- Y. Huang, Q. Gao, C. Li, X. Chen, X. Li, Y. He, Q. Jin and J. Ji, Adv. Funct. Mater., 2022, 32, 2109011 CrossRef CAS.
- V. Sorhie, Alemtoshi, B. Gogoi, B. Walling, S. A. Acharjee and P. Bharali, Sustainable Chem. Pharm., 2022, 30, 100875 CrossRef CAS.
- S. Mondal, R. Sahoo and M. C. Das, Inorg. Chem., 2023, 62, 14124–14133 CrossRef CAS PubMed.
- R. Feyisa Bogale, J. Ye, Y. Sun, T. Sun, S. Zhang, A. Rauf, C. Hang, P. Tian and G. Ning, Dalton Trans., 2016, 45, 11137–11144 RSC.
- X.-L. Zhao, D. Tian, Q. Gao, H.-W. Sun, J. Xu and X.-H. Bu, Dalton Trans., 2016, 45, 1040–1046 RSC.
- C. Liu and B. Yan, Sens. Actuators, B, 2016, 235, 541–546 CrossRef CAS.
- H. Xu, B. Zhai, C.-S. Cao and B. Zhao, Inorg. Chem., 2016, 55, 9671–9676 CrossRef CAS PubMed.
- P. C. Banerjee, D. E. Lobo, R. Middag, W. K. Ng, M. E. Shaibani and M. Majumder, ACS Appl. Mater. Interfaces, 2015, 7, 3655–3664 CrossRef CAS PubMed.
- R. Deka, V. Kumar, R. Rajak and S. M. Mobin, Sustainable Energy Fuels, 2022, 6, 3014–3024 RSC.
- T. K. Ghosh and G. Ranga Rao, Dalton Trans., 2023, 52, 5943–5955 RSC.
- G. Cai, P. Cui, W. Shi, S. Morris, S. N. Lou, J. Chen, J. Ciou, V. K. Paidi, K. Lee, S. Li and P. S. Lee, Adv. Sci., 2020, 7(20), 1903109 CrossRef CAS PubMed.
- A. K. Gupta, M. Saraf, P. K. Bharadwaj and S. M. Mobin, Inorg. Chem., 2019, 58, 9844–9854 CrossRef CAS PubMed.
- B. S. Stone and R. L. LaDuca, Polyhedron, 2014, 81, 542–549 CrossRef CAS.
- J. Yu, Z. Wang, X. Luo and H. Du, Chin. J. Chem., 2008, 26, 1826–1830 CrossRef CAS.
- G.-G. Luo, H.-B. Xiong and J.-C. Dai, Cryst. Growth Des., 2011, 11, 507–515 CrossRef CAS.
- L. Zhao, X. Guan, B. Yu, N. Ding, X. Liu, Q. Ma, S. Yang, A. Yilihamu and S.-T. Yang, Environ. Int., 2019, 133, 105208 CrossRef CAS PubMed.
- O. V. Dolomanov, L. J. Bourhis, R. J. Gildea, J. A. K. Howard and H. Puschmann, J. Appl. Crystallogr., 2009, 42, 339–341 CrossRef CAS.
- L. J. Bourhis, O. V. Dolomanov, R. J. Gildea, J. A. K. Howard and H. Puschmann, Acta Crystallogr., Sect. A: Found. Adv., 2015, 71, 59–75 CrossRef CAS PubMed.
- X. Zhu, Y. Zhu, S. Murali, M. D. Stoller and R. S. Ruoff, ACS Nano, 2011, 5, 3333–3338 CrossRef CAS PubMed.
- M. Saraf, R. Rajak and S. M. Mobin, J. Mater. Chem. A, 2016, 4, 16432–16445 RSC.
- Somnath, Waris, A. Ali, M. Ahmad and K. A. Siddiqui, Cryst. Growth Des., 2022, 22, 7374–7394 CrossRef CAS.
- A. Ali, Waris, Basree, M. Z. Khan, N. Dege, M. Ahmad and M. Shahid, Dalton Trans., 2023, 52, 15562–15575 RSC.
- E. V. Alexandrov, V. A. Blatov, A. V. Kochetkov and D. M. Proserpio, CrystEngComm, 2011, 13, 3947 RSC.
- V. A. Blatov, A. P. Shevchenko and D. M. Proserpio, Cryst. Growth Des., 2014, 14, 3576–3586 CrossRef CAS.
- A. Ali, S. Mishra, S. Kamaal, A. Alarifi, M. Afzal, K. Das Saha and M. Ahmad, Bioorg. Chem., 2021, 106, 104479 CrossRef CAS PubMed.
- S. S. Mehta, D. Y. Nadargi, M. S. Tamboli, T. Alshahrani, V. R. Minnam Reddy, E. S. Kim, I. S. Mulla, C. Park and S. S. Suryavanshi, Sci. Rep., 2021, 11, 5023 CrossRef CAS PubMed.
- S. Some, Y. Kim, Y. Yoon, H. Yoo, S. Lee, Y. Park and H. Lee, Sci. Rep., 2013, 3, 1929 CrossRef PubMed.
- S. Wang, T. Wang, Y. Shi, G. Liu and J. Li, RSC Adv., 2016, 6, 18465–18470 RSC.
- J.-H. Qin, H.-R. Wang, M.-L. Han, X.-H. Chang and L.-F. Ma, Dalton Trans., 2017, 46, 15434–15442 RSC.
- A. Li, Z. Hao, C. Han and G. Cui, Appl. Organomet. Chem., 2020, 34(3), e5313 CrossRef CAS.
- V. Shukla, M. Ahmad and K. A. Siddiqui, Mater. Today Chem., 2024, 38, 102138 CrossRef CAS.
- V. Shukla, M. Ahmad, G. C. Nayak, T. S. Thakur and K. A. Siddiqui, Cryst. Growth Des., 2024, 24, 3977–3992 CrossRef CAS.
- W.-J. Gong, R. Yao, H.-X. Li, Z.-G. Ren, J.-G. Zhang and J.-P. Lang, Dalton Trans., 2017, 46, 16861–16871 RSC.
- X. Zeng, Y. Zhang, J. Zhang, H. Hu, X. Wu, Z. Long and X. Hou, Microchem. J., 2017, 134, 140–145 CrossRef CAS.
- F. Yi, J. Li, D. Wu and Z. Sun, Chem. – Eur. J., 2015, 21, 11475–11482 CrossRef CAS PubMed.
- V. Shukla, M. Ahmad and K. A. Siddiqui, J. Mol. Struct., 2024, 1308, 138068 CrossRef CAS.
- J. Chen, F.-Y. Yi, H. Yu, S. Jiao, G. Pang and Z.-M. Sun, Chem. Commun., 2014, 50, 10506–10509 RSC.
- R. A. Dar, G. A. Naikoo, P. K. Kalambate, L. Giri, F. Khan, S. P. Karna and A. K. Srivastava, Electrochim. Acta, 2015, 163, 196–203 CrossRef CAS.
- M. Saraf, R. A. Dar, K. Natarajan, A. K. Srivastava and S. M. Mobin, ChemistrySelect, 2016, 1, 2826–2833 CrossRef CAS.
- M. K. Singh, A. K. Gupta, S. Krishnan, N. Guha, S. Marimuthu and D. K. Rai, J. Energy Storage, 2021, 43, 103301 CrossRef.
- M. Singh, A. Gupta, P. Saharan, C. Kumar, S. Sundriyal, R. Padhye, T. Daeneke, N. R. Choudhary and S. R. Dhakate, J. Energy Storage, 2023, 67, 107617 CrossRef.
- R. Rajak, M. Saraf, P. Kumar, K. Natarajan and S. M. Mobin, Inorg. Chem., 2021, 60, 16986–16995 CrossRef CAS PubMed.
- B. M. Omkaramurthy, G. Krishnamurthy and S. Foro, SN Appl. Sci., 2020, 2, 342 CrossRef CAS.
- Z.-X. Li, B.-L. Yang, K.-Y. Zou, L. Kong, M.-L. Yue and H.-H. Duan, Carbon, 2019, 144, 540–548 CrossRef CAS.
- M. K. Singh, A. K. Gupta, S. Krishnan, N. Guha, S. Marimuthu and D. K. Rai, J. Energy Storage, 2021, 43, 103301 CrossRef.
- J. Liu, Y. Zhou, Z. Xie, Y. Li, Y. Liu, J. Sun, Y. Ma, O. Terasaki and L. Chen, Angew. Chem., Int. Ed., 2020, 59, 1081–1086 CrossRef CAS PubMed.
- S. Rajkumar, E. Elanthamilan, J. P. Merlin, I. J. Daisy Priscillal and I. S. Lydia, Sustainable Energy Fuels, 2020, 4, 5313–5326 RSC.
- A. M. Afzal, N. Muzaffar, M. W. Iqbal, G. Dastgeer, A. Manzoor, M. Razaq, S. M. Wabaidur, E. A. Al-Ammar and S. M. Eldin, J. Appl. Electrochem., 2024, 54, 65–76 CrossRef CAS.
- K. Wang, Z. Wang, X. Wang, X. Zhou, Y. Tao and H. Wu, J. Power Sources, 2018, 377, 44–51 CrossRef CAS.
- S. Rajkumar, S. Gowri, S. Dhineshkumar, J. P. Merlin and A. Sathiyan, New J. Chem., 2021, 45, 20612–20623 RSC.
- I. Ahmad and A. Kumar, Chem. Eng. J., 2023, 477, 146972 CrossRef CAS.
- R. Sahoo, D. T. Pham, T. H. Lee, T. H. T. Luu, J. Seok and Y. H. Lee, ACS Nano, 2018, 12, 8494–8505 CrossRef CAS PubMed.
Footnotes |
| † Electronic supplementary information (ESI) available. CCDC 2314704. For ESI and crystallographic data in CIF or other electronic format see DOI: https://doi.org/10.1039/d4ma00762j |
| ‡ Basree and A. Ali contributed equally to the article. |
| This journal is © The Royal Society of Chemistry 2024 |

