 Open Access Article
Modification of ZnO gas-diffusion-electrodes for enhanced electrochemical CO2 reduction: optimization of operational conditions and mechanism investigation†
Gonçalves J.
Marrenjo
 ab,
Gelson T. S. T.
da Silva
 c,
Rodrigo A. A.
Muñoz
 a,
Lucia H.
Mascaro
 c and
Osmando F.
Lopes
 *a
*a
aInstitute of Chemistry, Federal University of Uberlândia, Avenida João Naves de Avila, 2121, 34800-902 Uberlândia, Minas Gerais, Brazil. E-mail: osmando@ufu.br
bSave University, Department of Natural Sciences, FPLM Avenida FPLM, 111, +25829371110, Massinga, Inhambane, Mozambique
cInterdisciplinary Laboratory of Electrochemistry and Ceramics, Department of Chemistry, Federal University of Sao Carlos, São Carlos, São Paulo 13565-905, Brazil
First published on 18th October 2024
Abstract
The development of new catalysts based on Earth-abundant materials, with high activity, stability, and selectivity for the electrochemical CO2 reduction, is of great importance in upgrading greenhouse gases to valuable fuels and feedstocks. In this work, we developed an amine-functionalized ZnO catalyst with improved performance for CO2 reduction to CO. We observed that electrodes prepared with ZnO modified with amine groups, combined with 25% carbon black as a support, exhibit the highest performance in the electrochemical conversion of CO2 to CO. Under optimized conditions, we achieved a current density of −130 mA cm−2, with a faradaic efficiency exceeding 80% at −1.2 V vs. RHE. The XPS and FTIR results confirmed the presence of nitrogen, related to amine groups, on the modified ZnO samples. EIS results confirmed that the presence of amine groups decreased the resistance to charge transfer. We investigated the mechanism of CO2 reduction using in situ FTIR spectroscopy, at potentials more negative than −0.8 V vs. RHE, there was consumption of CO2 at 2343 cm−1 and formation of the CO2− intermediate at 1668 cm−1. Additionally, we confirmed the adsorption of CO2 on the catalyst surface by detecting bidentate CO2 at 1378 cm−1. Amino-functionalized ZnO catalyst was stable during 100 h in a membrane electrode assembly (MEA) cell at −50 mA cm−2 with a faradaic efficiency higher than 70% and a full cell potential at 2.7 V. The catalyst exhibited a remarkable CO2 reduction performance, and its modification strategy is promising to be applied to different catalysts.
1. Introduction
The use of fossil fuels in the world has been increasing due to the rapid growth of the global economy. However, burning fossil fuels results in the emission of carbon dioxide (CO2), one of the primary greenhouse gases responsible for global warming and climate change.1 Several strategies have been conducted to mitigate CO2 emissions.2,3 Among the strategies, electrochemical CO2 reduction (ECR) into valuable fuels and feedstocks stands out because it can decrease these emissions while generating high-value products.4,5However, the overpotential for CO2 electrochemical reduction is very large, and the selectivity is very low due to the high stability of CO2 molecules and competition with hydrogen evolution reaction.6 The ECR for CO demonstrates relatively high selectivity and energy efficiency because it requires only 2 protons and 2 electrons, making it considered simpler compared to its reduction into methane (CH4), ethylene (C2H4), and other products, which require 8, 12 and more protons and electrons, respectively.7–12 Several electrocatalysts based on noble metals (Au, Ag and Pd) are known to have high selectivity in CO formation.8,13–16 However, it is well-known that noble metals are expensive and scarce. Therefore, it is of great importance to conduct studies based on earth-abundant and low-cost materials.17,18
Several kinds of alternative catalysts have been studied for ECR, such as metal nanostructures/nanoalloys,5,19 metal oxides,17,20–22 foil23 and single-atom catalysts.24,25 Recently, zinc-based electrodes have garnered much attention due to their excellent performance in the electrochemical conversion of CO2 to CO. Zinc oxide (ZnO) is an attractive choice because it is cost-effective and exhibits relatively high selectivity and stability.8,20 Additionally, nano-structured catalysts originating from surface oxidation and subsequent reduction have much higher activity, better selectivity, and long-term stability for CO2 conversion.26 Some works have proposed that the active sites for the ECR in metals oxides are due to the reconstruction of their surface, formed by the reduced metal oxide surface at the highly negative operating potentials,27,28 which can overcome the problem related to the low conductivity of metal oxide. Jeon et al. showed by operando X-ray absorption fine structure cationic Zn species get reduced as CO2 reduction reaction proceeded.29,30 On the other hand, some works have highlighted that a certain number of residual oxidized species can be stabilized in the surface region, despite the applied cathodic potential, and consequently, oxidized species adjacent to the near-surface could facilitate CO2 conversion.31,32 Then, to further improve the efficiency of ZnO catalyst, researchers have explored different strategies, such as control of the material's morphology, oxidation state, and doping.15,33
Additionally, most of the works using Zn-based electrocatalysts for ECR were evaluated using a classical H-cell, where current densities are limited to values below −50 mA cm−2,25 due to the low solubility of CO2 in aqueous-fed systems.24,33 For example, the effect of Zn particle size and its oxidation state on CO2 reduction was evaluate in an H-cell.29 It was observed that nanoparticles ranging from 3 to 5 nm showed selectivity for CO at around 70%; however, the current density was lower than −20 mA cm−2.34 Li et al. observed that sharp-tipped Zn nanowires enhanced the selectivity for CO (>90%); however, the current density was also low (−40 mA cm−2).33 Similar results were reported by other works.15,19,32 In this sense, gas-diffusion electrodes in an electrochemical flow-cell system have been used to supply enough CO2 to the catalyst layer to sustain higher current densities.
It is well-known that amine compounds, such as monoethanolamine, can enhance the CO2 adsorption on the catalyst's surface.35–37 These examples highlight the effective interaction of amine groups in capturing CO2 on the electrocatalyst surface via chemisorption and enhancing the efficiency of CO2 reduction to CO. However, to date, no studies have been found that specifically explore the use of monoethanolamine for modifying ZnO for its application in ECR, especially in a flow cell employing a gas diffusion electrode. Therefore, a deeper investigation is needed to assess ZnO-amine functionalized potential in an electrochemical flow cell for CO2 conversion into CO.
Here, we report on a study focused on the effect of the hydrothermal treatment of pristine ZnO coupled with its surface modification with monoethanolamine into ECR. The electrocatalytic performance of the modified ZnO was evaluated in a flow cell, with the aim of achieving cathodic current densities of −130 mA cm−2 and high selectivity for the formation of CO. The operating conditions were systematically explored, and the ECR mechanism was investigated using in situ FTIR. The results of this study have the potential to advance the development of efficient catalysts for CO2 conversion, thus contributing to the progress of sustainable energy conversion technologies.
2. Experimental
2.1. ZnO nanoparticles synthesis
ZnO samples were obtained through a typical synthesis of two steps, i.e., the precipitation method followed by the hydrothermal one.38 A total of 1.48 g of Zn(NO3)2·6H2O (Êxodo cientifica, 90%) was dissolved in 200 mL of deionized water under stirring. The pH of the solution was adjusted to 3.0 by the dropwise addition of HNO3 (Vetec, 65%) to ensure complete solubility of the salt. Subsequently, the pH was raised to 8.0 by adding NH4OH (Isofar, 24%). The resulting solution was kept under stirring for 24 h, leading to the formation of a white precipitate (zinc oxide precursor). This precursor was washed with deionized water and dried in an oven at 80 °C for 24 h, yielding the Zn precursor. The ZnO nanoparticles were obtained by an additional crystallization using the hydrothermal method, which involved adding 0.3 g of the Zn precursor (from the first step) to 100 mL of deionized water and treating it at different temperatures 100 and 150 °C (namely, ZnO-100 and ZnO-150) in a hydrothermal reactor under stirring for 2 h. For each hydrothermal treatment, the supernatant was discarded, and the sample was centrifuged, washed with water, and dried in an oven at 60 °C. To evaluate the effect of monoethanolamine (Met) on the ZnO morphology and surface groups, we performed the same synthesis procedure with the addition of 31 μL or 100 μL of monoethanolamine, followed by treatment at 100 °C (namely, ZnO/Met-31 μL or ZnO/Met-100 μL).2.2. Materials characterization
XRD patterns were collected at room temperature using a Shimadzu Lab-X XRD 6000 equipped with CuKα radiation (λ = 1.5406 Å), operating at 40 kV and 30 mA, in the 2θ range of 10° to 70°, with a scanning rate of 0.02° min−1 for 1 h per sample. From this routine, information about the crystal size was collected and calculated using the Scherrer equation (eqn (S1)) in the ESI.†The obtained powders were also further characterized using thermogravimetric analysis (TGA), Fourier transform infrared spectroscopy (FTIR), Raman spectroscopy, scanning electron microscopy (SEM), and X-ray photoelectron spectroscopy (XPS). The supplementary material contains detailed information on both the instrumental and experimental procedures.
2.3. Preparation of gas diffusion electrodes
Gas diffusion electrodes (GDEs) were prepared by spray coating on a carbon paper substrate (GDL-Sigracet, 39B) using an airbrush (Vonder). The ink was composed of 7.5 mg of ZnO samples, 7.5 mg of carbon black (amorphous carbon (CAS #1333-86-4)), 17 μL of ionomer (Sustainion XA-95% in Ethanol, Dioxide Materials Inc.), 1 mL of deionized water, and 1 mL of isopropanol (Vetec 99.5%). The mixture was placed in a 10 mL beaker within a cold-water bath and then subjected to 30 min of sonication using an ultrasonic probe sonicator (Sonics & Materials INC, VCX130) with a power rating of 130 W. Subsequently, the homogenized solution was evenly deposited onto a 16 cm2 area of carbon paper using an airbrush, and then dried in an oven at 80 °C for 24 h. The electrodes prepared exhibited a loading of 0.21 mg cm−2. Finally, a piece of 1 cm2 of the electrode was cut and applied as a working electrode for the electrochemical reduction of CO2.2.4. Electrochemical CO2 reduction
All electrochemical measurements were carried out on a potentiostat/galvanostat (Autolab PGSTAT204, Metrohm). The ECR experiments were performed in a commercial flow cell (Micro Flow Cell, Electrocell) with three compartments (Fig. S1, ESI†). The ZnO-based electrodes were used as working electrodes, nickel foam (1 mm in thickness) as counter-electrode, Ag/AgCl leak-free (3 M) as reference electrode, and an anion exchange membrane (FAB-PK-130, Fumasep) to separate the cathode and anode. Initially, 0.5 M KOH (pH = 13.8) was used as the electrolyte, circulating through the cell using a peristaltic pump at a flow rate of 6 mL min−1. Subsequently, the concentration of KOH was studied at 0.1, 0.5, and 1.0 M. On the other hand, the effect of two electrolytes, KOH and KHCO3, both at 1.0 M, was investigated to compare which one provides better efficiency in the electrochemical process. CO2 (99.99%) was purged from the back side and through the cathode with a flow rate of 30 mL min−1 monitored by rotameter (Aalborg, Orangeburg). The electrochemical performance was evaluated from the polarization curve of the material in the potential window of −0.4 to −1.2 V vs. reference hydrogen electrode (RHE). Electrolysis was carried out at different applied potentials (−0.8, −1.0, and −1.2 V vs. RHE), with the reaction gaseous product being analyzed every 20 min. The potentials were converted to the RHE using the following eqn (1).| E(vs. RHE) = E(vs. Ag/AgCl) + 0.197 V + 0.0592 × pH | (1) |
Gaseous products leaving the cell were transported by the continuous CO2 flow cell to a gas sampling bag, where aliquots were collected with a syringe and injected into a gas chromatograph equipped with thermal conductivity detection (GC-TCD, PerkinElmer Clarus 580) for the quantification of CO and H2. The GC-TCD is equipped with two columns (Porapak N 2 mm and molecular sieve) and one detector of thermal conductivity. The measurements were performed at 120 °C on the injector and 150 °C on the detector, with a thermal ramp of 35–120 °C. Ar was used as carrier gas at 30 mL min−1. Calibration curves for H2 and CO were determined separately by injecting known quantities of a standard gas mixture. The faradaic efficiencies of CO (FECO) and H2 (FEH2) were calculated using eqn (S2) in the ESI.†
ATR-IR spectra were acquired using a 6700 Nicolet Fourier transform infrared spectrometer, which was equipped with a mercury cadmium telluride (MCT) detector and a VeeMAX ATR apparatus (Pike Technologies) set at a 60° reflection angle. Each spectrum consisted of 64 scans at a resolution of 4 cm−1. The background spectrum was obtained under open circuit potential (OCP) conditions after a 15 min continuous purge of CO2 in the system. A constant flow of CO2 was maintained throughout all the chronoamperometry measurements, −0.8, −1.0, and −1.2 V vs. RHE. The spectra were recorded in absorbance mode, where positive and negative peaks corresponded to signal increases and decreases, respectively. During the experiments, the working electrode was pressed against a CaF2 prism to create a thin layer, 0.1 M KOH served as the supporting electrolyte, and a Pt mesh acted as the auxiliary electrode.
Electrochemical impedance spectroscopy (EIS) measurements were carried out to investigate the charge transfer in ZnO samples. It was used the same electrochemical flow cell and 1 M KOH as electrolyte. For assembly, earth (green) always grounded to the cage. The measurements were performed at open circuit potential, in a frequency range of 1000.000 to 0.01 Hz, disturbance amplitude of 5 mV, 12 points per decade.
The stability test was performed in a commercial Membrane Electrode Assembly (MEA) cell (Dioxide Materials®). ZnO/Met-31 μL was used as cathode, Ni foam was used as anode and 1 M KOH was used as anolyte and circulated at 5 mL min−1. In this configuration, the anode and cathode are assembled in the anion exchange membrane (Sustainion®) and CO2 can be directly fed with no aqueous electrolyte at 30 mL min−1. The stability was evaluated under galvanostatic conditions applying −50 mA cm−2 during 100 h, where the full cell potential and the faradaic efficiency were monitored to assess the electrode's stability.
3. Results and discussion
3.1. Zn-based materials characterization
X-ray diffraction (XRD) analysis was employed to investigate the phase structure of the produced samples. Fig. 1 displays the XRD patterns of ZnO samples synthesized under hydrothermal conditions at temperatures of 100 °C with and without Met (ZnO-100 and ZnO/Met-31 μL), as well as at 150 °C (ZnO-150). All samples exhibited characteristic peaks that could be assigned to the hexagonal wurtzite structure of ZnO (JCPDS No. 36-1451), with no impurities detected in any of the samples.16,39,40 Notably, no significant differences were observed in the X-ray diffraction profiles, the crystallite size was calculated using the Scherrer equation (Table S1, ESI†) for the ZnO samples, or the peaks were broadened, suggesting that the increase in temperature did not have a significant impact on crystallite growth.41 The ZnO GDEs were also evaluated by XRD (Fig. S2, ESI†), and it was observed that the spray-coating method was effective in depositing the ZnO powder on the surface of the carbon paper substrate in the same crystalline phase.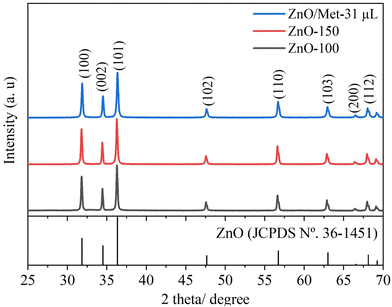 | ||
| Fig. 1 XRD patterns of the ZnO samples prepared at different temperatures (100, 150 °C and ZnO/Met-31 μL). | ||
Fig. 2 exhibits the FTIR spectra of ZnO powders prepared at different temperatures (100 and 150 °C) and 100 °C modified by monoethanolamine. The bands centered at 455 cm−1 correspond to the Zn–O stretching mode.42 The band centered at 3371 cm−1 is attributed to the vibration of the O–H bond, belonging to the hydroxyl groups of water molecules adsorbed on the ZnO surface. The absorption peaks in the range of 1393 to 1510 cm−1 are associated with the bending mode of the O–H chemical bond.43 Increasing the temperature of the hydrothermal treatment from 100 to 150 °C led to a decrease in the signal corresponding to the O–H groups. It can be related to the temperature effect, which promoted the removal of water adsorbed on the ZnO surface, demonstrating that although there are no changes in the crystalline structure detectable by XRD, temperature variation, even if slight, can induce distortions capable of promoting surface changes.44 On the other hand, no bands were identified in the regions of 1400 and 1580 cm−1, which are typically associated with the stretching vibrations of the N–H bond of monoethanolamine on the ZnO surface. It was expected since the amount of monoethanolamine used in the synthesis was very small to be detected by FTIR analysis. Therefore, as proof of concept we synthesized a ZnO sample material modified with 100 μL of monoethanolamine (ZnO/Met-100 μL), and this sample was also analyzed by FTIR (Fig. S3, ESI†). It can be observed the presence of several bands related to the monoethanolamine on the ZnO surface. Therefore, we can confirm the ZnO sample was not doped with nitrogen and the amino functionalization of ZnO was successfully achieved.
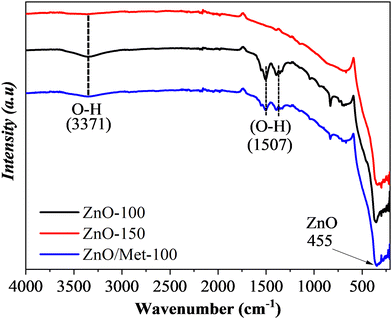 | ||
| Fig. 2 FTIR spectra of the ZnO samples prepared at different temperatures (100, 150 °C and ZnO/Met-31 μL). | ||
The thermogravimetric analysis (TGA) of the ZnO samples (Fig. S4, ESI†) confirmed the behavior observed by FTIR. The ZnO-100 sample exhibited two peaks at 120 °C and 150 °C, with a weight loss of approximately 10% and 20%, respectively. This weight loss can be attributed to the physically adsorbed water and the transformation of zinc hydroxide into zinc oxide. In contrast, the ZnO-150 and ZnO/Met-31 μL samples do not show weight loss related to the transformation of zinc hydroxide into zinc oxide, indicating that the hydrothermal treatment at 150 °C could promote this conversion. On the other hand, amino groups can increase the thermal stability of the material.
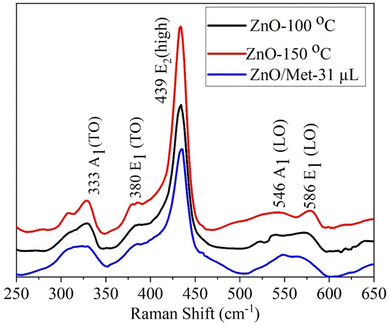
ZnO samples were analyzed by Raman spectroscopy (Fig. 3) to assess the impact of hydrothermal temperature and the presence of monoethanolamine on their structure. All ZnO samples exhibited a similar spectrum profile, revealing multiple peaks that can be attributed to Zn–O vibrational modes.45–47 Remarkably, the most prominent peak occurs at 439 cm−1 (E2 high), which is characteristic of the vibrational mode of the hexagonal wurtzite phase in the ZnO structure.45,46,48 This peak is attributed to oxygen vibration.45–47,49,50 Additionally, peaks were observed at 333 cm−1 (A1 (TO)) and 380 cm−1 (E1 (TO)), which are assigned to Zn–O vibrational modes, in agreement with the literature.48–50 It's worth mentioning that structural defects in the material, such as oxygen and zinc vacancies, as well as the presence of free charges, led to the formation of lower-intensity peaks observed at 546 and 586 cm−1.13,47,51 However, it's relevant to highlight that the E1(LO) mode is more sensitive to these impurities and defects.13,46,47,50
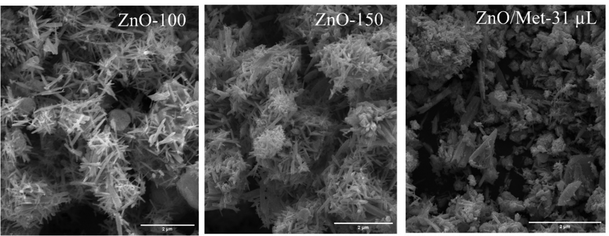
The morphological characterization of the ZnO samples treated at different temperatures (ZnO-100, ZnO-150, and ZnO/Met-31 μL) was evaluated by SEM, as illustrated in Fig. 4. The ZnO-100 sample exhibited rod-like particles, with noticeable small blocks indicating the presence of precursor particles Zn(OH)2 as observed by TGA analysis.41 With the increase in treatment temperature to 150 °C (ZnO-150), the particles showed well-defined short rod morphologies compared to those treated at 100 °C. It can be attributed to the higher temperature, which promoted the removal of adsorbed hydroxyl groups and structural –OH on the ZnO surface, as observed by FTIR and TGA analysis.40 Additionally, the temperature influenced the reduction of elongated particle growth, resulting in the formation of typical pure ZnO structures. The hydrothermal treatment contributed to the morphological transformation from the zinc hydroxide precursor phase to the crystalline phase of ZnO.38,41,43,52,53 The addition of monoethanolamine induced changes in the ZnO morphology due to chemical interactions and control of crystal growth. This result can be explained by the fact that monoethanolamine can be adsorbed on the ZnO surface, inhibiting longitudinal particle growth, and leading to an isotropic growth in nanosheets or branched structures. Monoethanolamine may have influenced the nucleation and growth rates of ZnO, thus contributing to the morphology of the nanoparticles.37 ZnO gas-diffusion electrodes were also analyzed by SEM, and it is evident that the ZnO particles were uniformly distributed on the carbon paper surface. This observation indicates the absence of particle aggregation, ensuring the desired efficiency during the ECR process Fig. S5 (ESI†).
The XPS survey spectra for both samples (ZnO-100 and ZnO/Met-31 μL) exhibited characteristic peaks related to Zn, O, and C, confirming the formation of the ZnO samples without impurities (Fig. 5A).54–57 The high-resolution Zn XPS spectrum showed two fitting peaks shifted to a higher binding energy, around 1044.3 and 1021.4 eV, attributed to Zn 2p1/2 and Zn 2p3/2, respectively, indicating the presence of Zn2+ cations in the ZnO phase (Fig. 5B).54,58 The carbon C 1s peak observed at 284.8 eV is used as a reference to calibrate the binding energies in the spectra Fig. S6 (ESI†). The peak centered at 531.2 eV is associated with O2− ions in the wurtzite structure of ZnO. The other peak, located at 531.1 eV, is related to the OH group adsorbed on the surface of the ZnO nanoparticles. The high-resolution O 1s and Zn 2p spectra for both samples exhibited a similar profile, indicating that functionalization with amine does not alter the oxidation state of oxygen and zinc, nor the functional groups Fig. 5C. On the other hand, distinct N 1s signals were not observed in the ZnO-100 samples (Fig. 5D). However, in the ZnO/Met-31 μL sample, a peak at 401.3 eV was observed, which was associated with the amino group of monoethanolamine on the surface of the ZnO, in agreement with FTIR results (Fig. S3, ESI†).57,59
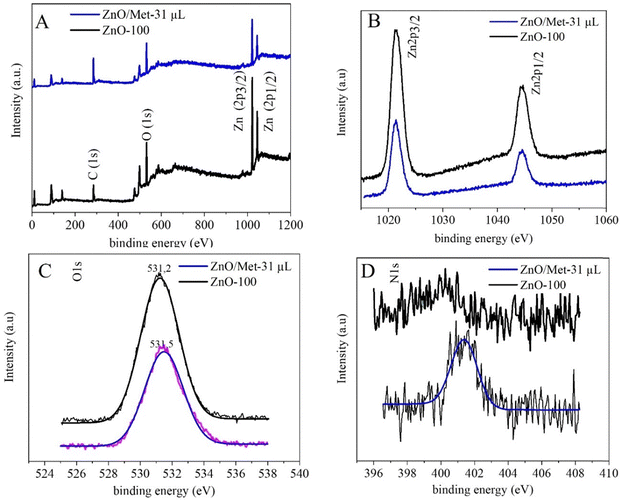 | ||
| Fig. 5 (A) The XPS survey spectra, (B) high-resolution spectra for Zn 2p, (C) O 1s and (D) N 1s of both ZnO samples. | ||
3.2. Zn-based electrode performance for ECR
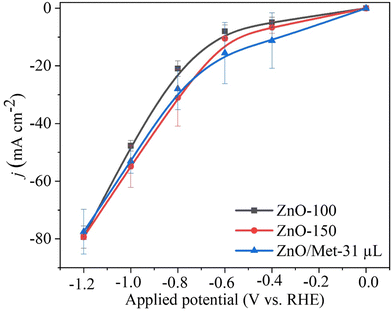
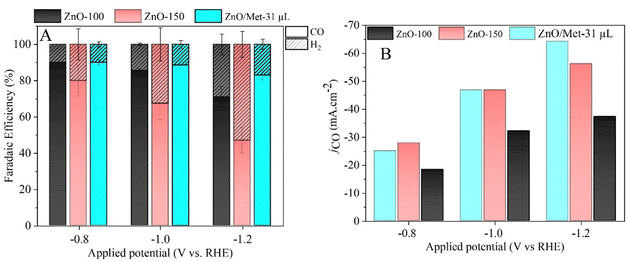
The performance of ZnO gas diffusion electrodes for ECR was evaluated by polarization curves in an electrochemical flow cell (Fig. 6), measuring the average current density by applying each potential (−0.2 to −1.2 V vs. RHE) for 100 s. Based on the polarization curves, it can be observed that with an increase in the reduction potential, the current density also increased, reaching up to −80 mA cm−2 in all samples. However, no significant difference in the current density for the different ZnO electrodes was observed. ECR relies on several metrics to assess electrocatalyst effectiveness, including current density, faradaic efficiency (FE), and stability.60The gaseous products formed during the electrolysis process under different reduction potentials (−0.8, −1.0, and −1.2 V vs. RHE) were quantified by GC to evaluate the FE. It was confirmed that the CO and H2 were the only products observed under all conditions. Fig. 7A displays the faradaic efficiency for carbon (FECO) and hydrogen (FEH2) obtained for each sample. All samples exhibited an FECO ranging from 80 to 90% at lower potentials (−0.8 V vs. RHE), and this result agrees with the literature.25 As we increased the cathodic potentials, there was a slight decrease in CO selectivity, ranging from 50% to 80%, depending on the sample. This reduction in efficiency can be attributed to physical and chemical changes in the ZnO catalyst, leading to its conversion into metallic Zn, which reduces the selectivity for CO.25 Furthermore, higher reduction potentials can promote changes in surface properties and decrease the hydrophobicity of the carbon paper allowing the electrolyte penetration through the GDE, reducing CO2 diffusion, and resulting in lower selectivity for CO.25
It is noteworthy that the ZnO/Met-31 μL electrode exhibited a higher FECO at all reduction potentials compared to the ZnO-150 and ZnO-100 electrodes. This electrode was able to maintain a FECO above 84% even at −1.2 V, while the other samples exhibited a FECO in the range of 50% to 75%. The CO partial current density (jCO) in Fig. 7B makes more evident the higher selectivity of the ZnO/Met-31 μL sample to convert CO2 to CO compared to other samples, indicating that modification of the catalyst surface with monoethanolamine was efficient. It means the presence of amine groups on the semiconductor surface can enhance active site availability and refine the adsorption of reaction intermediates to improve CO selectivity.37,61 Hence, the presence of monoethanolamine during ZnO synthesis yields a series of improvements that collectively enhance ECR, rendering the process more efficient and selective in producing desired products.
The EIS results for the ZnO samples deposited on carbon paper and mixed with carbon black and ionomer sustainion showed that all the electrodes were conductive (Fig. S7, ESI†). The Rct values recorded for the ZnO-100, ZnO-150 and ZnO/Met-31 μL electrocatalysts were 474.1, 481.1 and 306.1 Ω, respectively (Table 1). The lower resistance to charge transfer for the ZnO/Met-31 μL GDE suggests that functionalization can effectively influence reaction kinetics and interfacial charge dynamics during CO2 electroreduction.62 This result also explain the higher performance of ZnO/Met-31 μL sample for CO2 reduction compared to pristine ZnO.
| Samples | R s (Ω) | R ct (Ω) |
|---|---|---|
| ZnO/Met-31 μL | 3.96 | 306.1 |
| ZnO-100 | 3.95 | 474.1 |
| ZnO-150 | 4.00 | 481.3 |
3.3. Evaluation of operational conditions and electrode preparation
The effect of KOH concentration (0.1, 0.5, and 1.0 M) on the electrochemical reduction of CO2 to CO was investigated by polarization curves and electrolysis process. The results obtained revealed a significant influence of the electrolyte concentration on the electrocatalytic performance. At higher electrolyte concentrations, we observed a substantial increase in the current density, reaching approximately −120 mA cm−2, compared to the current densities obtained at lower concentrations, i.e., 0.1 M (−30 mA cm−2) and 0.5 M (−82 mA cm−2) (Fig. 8A). This trend was also observed in the partial current density for CO, which reached around −80 mA cm−2 (Fig. 8B).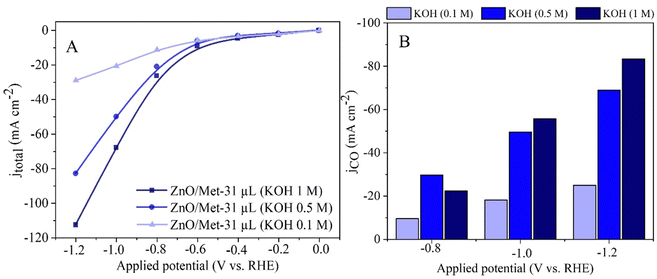 | ||
| Fig. 8 (A) Polarization curves of the ZnO/Met-31 μL under different concentrations of KOH electrolyte. (B) The partial current density for CO (JCO) formation in different concentrations of KOH. | ||
It is worth noting that although the current density for CO production (JCO) was approximately −80 mA cm−2 in 1 M KOH, the FE for CO was also high at 80% (Fig. 8). It shows the increase in the alkalinity of the electrolyte can promote simultaneously higher activity and selectivity for the generation of CO. The results obtained in this study corroborate with previous research, such as the study conducted by Verma et al., which investigated the electro-reduction of CO2 to CO on silver-based gas diffusion electrodes.63 These studies also demonstrated improvements in partial current densities for CO (JCO) with an increase in the electrolyte solution's concentration, regardless of the anion present.63 The same trend was observed by Li et al., for ethylene production.64 It underscores the importance of electrolyte concentration in optimizing electrochemical reactions.
We also evaluated the effect of electrolyte nature on the electrocatalytic performance of the ZnO/Met-31 μL samples. Then, two different kinds of electrolytes, KOH and KHCO3, was evaluated as can be seen in Fig. 9. ZnO/Met-31 μL sample exhibited a significantly higher current density when KOH was used as the electrolyte in comparison with KHCO3, −112 and −30 mA cm−2, respectively. Therefore, these results justify the preference for KOH, as its higher ionic strength and electronic conductivity optimize the efficiency of the electrochemical reaction and minimize the formation of solid deposits. In contrast, KHCO3 has a lower ionic strength, which reduces conductivity and increases the tendency to form carbonates and bicarbonates, which can clog the electrode surface and compromise the efficiency of the process.65,66 The product selectivity is directly related to the anions present in the aqueous solution, with OH− being the most influential one, followed by CO32−, HCO3− and Cl−.67
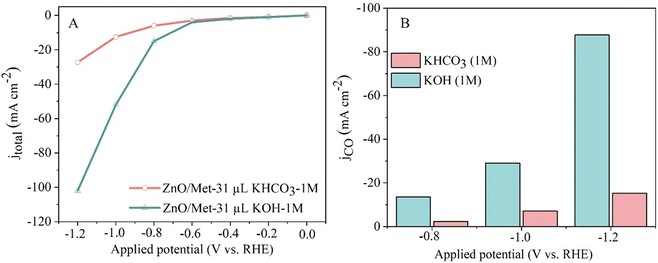 | ||
| Fig. 9 (A) Polarization curves of the ECR and (B) CO partial current density for different electrolytes (1 M KOH and KHCO3). | ||
Additionally, while more alkaline electrolytes ensure enhanced conductivity and reaction kinetics, the formation of carbonates during CO2 consumption hinders the performance of the electrochemical reaction, due to the physical blocking of active sites by carbonates and possible changes in the pH and composition of the electrolyte, reducing the ionic conductivity. On the other hand, less alkaline electrolytes like KHCO3 suffer from high ohmic resistance and overpotentials, resulting in reduced current densities.25,51,68–70 Therefore, the choice to use KOH as the electrolyte was based on its remarkably higher conductivity compared to electrolytes commonly employed in CO2 reduction, such as K2SO4 or KHCO3.5,13,16,21,71,72
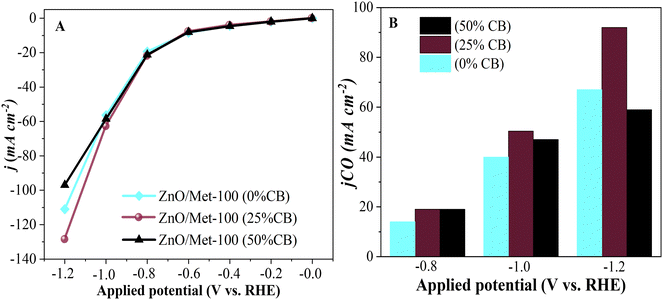
The influence of carbon black (CB) on the electrode surface was investigated by incorporating it at various concentrations: 0%, 25%, and 50%. The sample with 50% of CB exhibited a current density of approximately −100 mA cm−2, a relatively lower value compared to the 0% and 25% CB samples. The decrease in current density with increasing CB concentration can be attributed to the reduction of active sites on the catalyst's surface where CO2 is adsorbed.73 Additionally, the excessive accumulation of CB can lead to compaction due to the formation of a thicker catalyst layer, which blocks the adsorption sites on the electrode and restricts the diffusion of CO2 within the catalyst layer.8 It decreases the efficiency of the ECR process for CO production, favoring a higher formation of H2.
In comparison, the 25% CB sample demonstrated a density of approximately −130 mA cm−2, indicating that the unbalanced use of CB can hinder electron flow in the electrochemical system despite its conductivity. Therefore, maintaining a balanced ratio between the catalyst and CB is crucial to optimize electrochemical activity, as possibly indicated by the 25% CB sample (Fig. 10A). It can also be observed that the sample treated with 25% showed a higher partial density of around −100 mA cm−2, as shown in Fig. 10B. These results are consistent with those found by Luo et al., during their studies on the electrochemical reduction of CO2 on highly porous zinc catalysts.5
3.4. Investigation of CO2 reduction mechanism
In situ FTIR was employed to probe the intermediate species formed on the surface of the ZnO catalyst during the electrochemical reduction of CO2. The electrode containing the ZnO/Met-31 μL catalyst was studied at open circuit potential (OCP) and −0.8 V, −1.0 V, and −1.2 V (Fig. 11). The FTIR spectrum obtained at OCP conditions was used as the background. Then, under applied reduction potentials, negative peaks were observed in the infrared spectra at 3000 cm−1 and 2343 cm−1, indicative of water molecule vibrations and the consumption of gaseous CO2, respectively.74,75 Under all reduction potential, there can also be a positive peak at 1378 cm−1, which is related to the formation of bidentate CO2− species, indicating their coexistence on the surface of ZnO. Additionally, intense positive peaks at 1668 cm−1 were observed, indicating the formation of the intermediate (CO2−) adsorbed on the catalyst surface.75,76 During the CO2 electrolysis process, CO2 undergoes an activation process to generate CO2−, which is subsequently converted to CO* through surface reactions. Finally, CO* desorbs from the catalyst surface, resulting in CO production.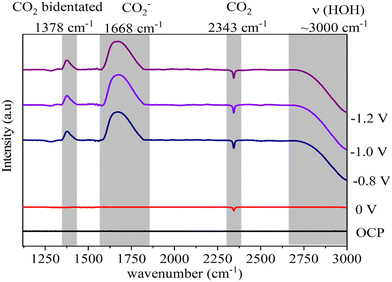 | ||
| Fig. 11 In situ FTIR spectra of electrochemical reduction of CO2 on ZnO electrode treated with monoethanolamine at different potentials. | ||
Therefore, it can be proposed an enhanced CO2 reduction mechanism by the amino-functionalized ZnO sample. The amine group can interact strongly with the CO2 molecules through hydrogen bonds and Lewis's acid–base interactions. It can act as active sites, adsorbing and concentrating CO2 on the surface of ZnO, which improves electron transfer from the electrode to the CO2 molecule.62 In addition, this group can also stabilize the reaction intermediates, such as the formate anion (HCOO–), facilitating the breaking of the C![[double bond, length as m-dash]](https://www.rsc.org/images/entities/char_e001.gif) O bond and promoting the formation of CO. It can also modify the surface energy and density of electronic states of the material, adjusting the catalytic properties to promote more efficient adsorption and the transformation of CO2 into CO.36
O bond and promoting the formation of CO. It can also modify the surface energy and density of electronic states of the material, adjusting the catalytic properties to promote more efficient adsorption and the transformation of CO2 into CO.36
3.5. Long-term stability test in MEA cell
The long-term stability test of amino-functionalized ZnO electrode (ZnO/Met-31 μL sample) was carried out with in a membrane electrode assembly (MEA) cell (Fig. 12). The experiment was conducted in galvanostatic mode using a 5 cm2 electrode, applying a current of 250 mA, i.e. current density of 50 mA cm−2 while continuously monitoring and adjusting the necessary full cell potential to maintain a constant current flow. In this setup, the stability of the electrode is tracked through the variation in the applied potential and the faradaic efficiency. When the electrode decreases its activity, the full cell potential gradually increases to compensate the resistance, while the faradaic efficiency gradually decreases due to the electrode flooding. It can be observed the faradaic efficiency for CO was maintained around 70% at −50 mA cm−2, while fluctuations in the full cell potential were observed during the reaction; however, these were concentrated at an average full cell potential of 2.7 V. It is worth to pointing out the full cell potential was kept stable in the first 10 h (around 2.8 V), then it starts to slowly decrease, however the full cell potential did not increase in respect to the initial values. Therefore, the catalyst's performance remained stable during 100 h of electrolysis, without any significative degradation.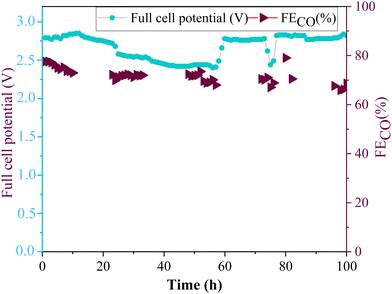 | ||
| Fig. 12 Long-term stability of ZnO/Met-31 μL GDE by applying a current of −50 mA cm−2 during 100 h of reaction. | ||
The electrode preserved the continuous formation of CO throughout the reaction, demonstrating excellent electrocatalytic properties, keeping the activity and stability under conditions of electrochemical reduction of CO2 for prolonged periods. These results are particularly relevant, as there are still few studies demonstrating the stability of zinc oxide electrocatalysts for a period of 100 h (Table S2, ESI†). It can be also demonstrated ZnO/Met-31 μL are within the range of stability, efficiency, and applied potential used in the literature, suggesting that the method of functionalizing catalysts with amine groups can improve the catalyst performance and make it more competitive.
4. Conclusions
In summary we can conclude that amino-functionalized ZnO gas-diffusion electrodes exhibited an improved electrocatalytic performance in the conversion of CO2 to CO. We observed the addition of monoethanolamine during the synthesis step was effective in promoting surface modification on ZnO samples and decrease the resistance to charge transfer. Remarkably, the modified ZnO sample exhibited a non-uniform morphology and a FECO production exceeding 80%, even at current densities of up to −120 mA cm−2 in a flow cell. We observed that electrolyte concentration and nature played a very important role on the electrocatalytic performance. In situ FTIR experiments demonstrated that, at reducing potentials, there was the formation and subsequent reduction of a CO intermediate adsorbed on the surface of ZnO. The amino-functionalized ZnO electrode was stable under 100 h of electrolysis with FECO higher than 70% at −50 mA cm−2. Furthermore, the functionalization strategy employed in this study offers a viable approach to the development of earth abundant catalyst with higher electrocatalytic performance for CO2 reduction to CO.Data availability
All raw data of this paper can be found in the following link in the cloud of our institution: https://ufubr-my.sharepoint.com/:f:/g/personal/osmando_ufu_br/EkjM7meOrqtNmv75XiV8nv8BlGug4aiq6CotCgtTyoRbhQ?e=Xzuexw.Conflicts of interest
There are no conflicts to declare.Acknowledgements
The authors acknowledge FAPEMIG (Minas Gerais Research Foundation, grant: #APQ-00282-21 and #APQ-03141-18), CNPq (Brazilian National Council for Scientific and Technological Development, grants: #406026/2023-8, #405819/2022-6, #440117/2022-4, #152607/2022-6, #311769/2022-5, #315838/2021-3 and #406156/2022-0) FAPESP (grants: #2017/11986-5, #2013/07296-2, and #2022/10255-5), and FINEP (grants: #01.22.0179.00, # 01.23.0645.00) for the financial support. The authors would like to acknowledge the Multiuser Laboratories of the Universidade Federal de Uberlândia (RELAM-UFU) for providing the equipment and technical support for experiments involving SEM and XRD (FAPEMIG grant APQ-02391-22). Osmando F. Lopes acknowledges Alexander von Humboldt Foundation by Return Fellowship Grant. Lucia Mascaro also acknowledges Shell for the strategic importance of the support given by ANP (Brazil's National Oil, Natural Gas, and Biofuels Agency) through the R&D levy regulation. We also express our gratitude to Prof. Dr. Sheila Canobre, for fruitful discussions and general assistance.References
- K. Calvin, D. Dasgupta, G. Krinner, A. Mukherji, P. W. Thorne, C. Trisos, J. Romero, P. Aldunce, K. Barrett, G. Blanco, W. W. L. Cheung, S. Connors, F. Denton, A. Diongue-Niang, D. Dodman, M. Garschagen, O. Geden, B. Hayward, C. Jones, F. Jotzo, T. Krug, R. Lasco, Y.-Y. Lee, V. Masson-Delmotte, M. Meinshausen, K. Mintenbeck, A. Mokssit, F. E. L. Otto, M. Pathak, A. Pirani, E. Poloczanska, H.-O. Pörtner, A. Revi, D. C. Roberts, J. Roy, A. C. Ruane, J. Skea, P. R. Shukla, R. Slade, A. Slangen, Y. Sokona, A. A. Sörensson, M. Tignor, D. van Vuuren, Y.-M. Wei, H. Winkler, P. Zhai, Z. Zommers, J.-C. Hourcade, F. X. Johnson, S. Pachauri, N. P. Simpson, C. Singh, A. Thomas, E. Totin, A. Alegría, K. Armour, B. Bednar-Friedl, K. Blok, G. Cissé, F. Dentener, S. Eriksen, E. Fischer, G. Garner, C. Guivarch, M. Haasnoot, G. Hansen, M. Hauser, E. Hawkins, T. Hermans, R. Kopp, N. Leprince-Ringuet, J. Lewis, D. Ley, C. Ludden, L. Niamir, Z. Nicholls, S. Some, S. Szopa, B. Trewin, K.-I. van der Wijst, G. Winter, M. Witting, A. Birt and M. Ha, IPCC, 2023: Climate Change 2023: Synthesis Report. Contribution of Working Groups I, II and III to the Sixth Assessment Report of the Intergovernmental Panel on Climate Change [Core Writing Team, ed. H. Lee and J. Romero]. IPCC, Geneva, Switzerland, 2023.
- S. Overa, B. H. Ko, Y. Zhao and F. Jiao, Acc. Chem. Res., 2022, 55, 638–648 CrossRef CAS PubMed.
- H. Wang, N. Deng, X. Li, Y. Chen, Y. Tian, B. Cheng and W. Kang, Nanoscale, 2023, 16, 2121–2168 RSC.
- E. A. dos Reis, G. T. S. T. da Silva, E. I. Santiago and C. Ribeiro, Energy Technol., 2023, 11, 2201367 CrossRef CAS.
- W. Luo, J. Zhang, M. Li and A. Züttel, ACS Catal., 2019, 9, 3783–3791 CrossRef CAS.
- L. Ji, L. Li, X. Ji, Y. Zhang, S. Mou, T. Wu, Q. Liu, B. Li, X. Zhu, Y. Luo, X. Shi, A. M. Asiri and X. Sun, Angew. Chem., 2020, 132, 768–772 CrossRef.
- A. Pătru, T. Binninger, B. Pribyl and T. J. Schmidt, J. Electrochem. Soc., 2019, 166, F34–F43 CrossRef.
- M. P. L. Kang, M. J. Kolb, F. Calle-Vallejo and B. S. Yeo, Adv. Funct. Mater., 2022, 32, 2111597 CrossRef CAS.
- R. Kortlever, J. Shen, K. J. P. Schouten, F. Calle-Vallejo and M. T. M. Koper, J. Phys. Chem. Lett., 2015, 6, 4073–4082 CrossRef CAS PubMed.
- H. Xie, T. Wang, J. Liang, Q. Li and S. Sun, Nano Today, 2018, 21, 41–54 CrossRef CAS.
- T. Wei, S. Zhang, Q. Liu, Y. Qiu, J. Luo and X. Liu, Acta Phys.-Chim. Sin., 2023, 39, 1–9 Search PubMed.
- S. Mou, T. Wu, J. Xie, Y. Zhang, L. Ji, H. Huang, T. Wang, Y. Luo, X. Xiong, B. Tang and X. Sun, Adv. Mater., 2019, 31, 1903499 CrossRef PubMed.
- C. Ma, X. Zou, A. Li, Z. Gao, L. Luo, S. Shen, J. Zhang, Z. Huang and L. Zhu, Electrochim. Acta, 2022, 411, 140098 CrossRef CAS.
- K. P. Kuhl, T. Hatsukade, E. R. Cave, D. N. Abram, J. Kibsgaard and T. F. Jaramillo, J. Am. Chem. Soc., 2014, 136, 14107–14113 CrossRef CAS PubMed.
- Y. Lu, B. Han, C. Tian, J. Wu, D. Geng and D. Wang, Electrochem. Commun., 2018, 97, 87–90 CrossRef CAS.
- K. Liu, J. Wang, M. Shi, J. Yan and Q. Jiang, Adv. Energy Mater., 2019, 9, 1900276 CrossRef.
- S. Chu, S. Hong, J. Masa, X. Li and Z. Sun, Chem. Commun., 2019, 55, 12380–12383 RSC.
- S. Gao, S. Chen, Q. Liu, S. Zhang, G. Qi, J. Luo and X. Liu, ACS Appl. Nano Mater., 2022, 5, 12387–12394 CrossRef CAS.
- J. Rosen, G. S. Hutchings, Q. Lu, R. V. Forest, A. Moore and F. Jiao, ACS Catal., 2015, 5, 4586–4591 CrossRef CAS.
- W. Luo, Q. Zhang, J. Zhang, E. Moioli, K. Zhao and A. Züttel, Appl. Catal., B, 2020, 273, 119060 CrossRef CAS.
- L. G. Puppin, M. Khalid, G. T. T. Da Silva, C. Ribeiro, H. Varela and O. F. Lopes, J. Mater. Res., 2020, 35, 272–280 CrossRef CAS.
- L. G. Puppin, L. F. da Silva, M. Carmo, H. Varela and O. F. Lopes, J. Mater. Res., 2021, 36, 4240–4248 CrossRef CAS.
- O. F. Lopes and H. Varela, ChemistrySelect, 2018, 3, 9046–9055 CrossRef CAS.
- T. Zheng, K. Jiang, N. Ta, Y. Hu, J. Zeng, J. Liu and H. Wang, Joule, 2019, 3, 265–278 CrossRef CAS.
- I. Stamatelos, C. T. Dinh, W. Lehnert and M. Shviro, ACS Appl. Energy Mater., 2022, 5, 13928–13938 CrossRef CAS.
- X. Jiang, F. Cai, D. Gao, J. Dong, S. Miao, G. Wang and X. Bao, Electrochem. Commun., 2016, 68, 67–70 CrossRef CAS.
- C. W. Li, J. Ciston and M. W. Kanan, Nature, 2014, 508, 504–507 CrossRef CAS PubMed.
- Y. Lum and J. W. Ager, Angew. Chem., Int. Ed., 2018, 57, 551–554 CrossRef CAS PubMed.
- H. S. Jeon, J. Timosnenko, F. Scholten, I. Sinev, A. Herzog, F. T. Haase and B. R. Cuenya, J. Am. Chem. Soc., 2019, 141, 19879–19887 CrossRef CAS PubMed.
- H. Mistry, A. S. Varela, C. S. Bonifacio, I. Zegkinoglou, I. Sinev, Y. W. Choi, K. Kisslinger, E. A. Stach, J. C. Yang, P. Strasser and B. R. Cuenya, Nat. Commun., 2016, 7, 12123 CrossRef PubMed.
- Y. Zou and S. Wang, Adv. Sci., 2021, 8, 2003579 CrossRef CAS PubMed.
- D. L. T. Nguyen, M. S. Jee, D. H. Won, H. Jung, H. S. Oh, B. K. Min and Y. J. Hwang, ACS Sustainable Chem. Eng., 2017, 5, 11377–11386 CrossRef CAS.
- Y. H. Li, P. F. Liu, C. Li and H. G. Yang, Chem. – Eur. J., 2018, 24, 15486–15490 CrossRef CAS PubMed.
- H. S. Jeon, I. Sinev, F. Scholten, N. J. Divins, I. Zegkinoglou, L. Pielsticker and B. R. Cuenya, J. Am. Chem. Soc., 2018, 140, 9383–9386 CrossRef CAS PubMed.
- Y. Liao, S. W. Cao, Y. Yuan, Q. Gu, Z. Zhang and C. Xue, Chem. – Eur. J., 2014, 20, 10220–10222 CrossRef CAS PubMed.
- G. Lee, Y. C. Li, J. Y. Kim, T. Peng, D. H. Nam, A. Sedighian Rasouli, F. Li, M. Luo, A. H. Ip, Y. C. Joo and E. H. Sargent, Nat. Energy, 2021, 6, 46–53 CrossRef CAS.
- Y. Liao, Z. Hu, Q. Gu and C. Xue, Molecules, 2015, 20, 18847–18855 CrossRef CAS PubMed.
- J. C. De Almeida, M. T. Correâ, R. H. Koga, D. M. S. Del Duque, O. F. Lopes, G. T. S. T. Da Silva, C. Ribeiro and V. R. De Mendoncą, New J. Chem., 2020, 44, 18216–18224 RSC.
- S. Al-Ariki, N. A. A. Yahya, S. A. Al-A’nsi, M. H. H. Jumali, A. N. Jannah and R. Abd-Shukor, Sci. Rep., 2021, 11, 11948 CrossRef CAS PubMed.
- C. Li, Y. Huang, X. Zhang, G. Liu, P. Liu, P. Yan, P. Pan and Y. G. Yao, Catal. Commun., 2023, 177, 106648 CrossRef CAS.
- S. R. Dhage, R. Pasricha and V. Ravi, Mater. Lett., 2005, 59, 779–781 CrossRef CAS.
- J. C. de Almeida, M. T. Corrêa, R. H. Koga, D. M. S. Del Duque, O. F. Lopes, G. T. S. T. da Silva and V. R. de Mendonça, New J. Chem., 2020, 44, 18216–18224 RSC.
- J. D. Harris, E. A. Wade, E. G. Ellison, C. C. Pena, S. C. Bryant, N. L. McKibben, A. J. Christy, K. O. Laughlin, A. E. Harris, K. V. Goettsche, C. E. Larson, S. M. Hubbard, J. E. Cowen, J. Eixenberger, D. Estrada and J. R. Chase, Catalysts, 2022, 12, 1099 CrossRef CAS PubMed.
- G. T. S. T. da Silva, K. T. G. Carvalho, O. F. Lopes, E. S. Gomes, A. R. Malagutti, V. R. Mastelaro, C. Ribeiro and H. A. J. L. Mourão, ChemCatChem, 2017, 9, 3795–3804 CrossRef CAS.
- Y. Imanaka, X. Chao-Nan, K. Harada, T. Mizoguchi, H. Takeda, K. Kato, H. Nagata and T. Kiguchi, J. Ceram. Soc. Jpn., 2017, 125, 6–7 Search PubMed.
- P. Mondal, Vib. Spectrosc., 2019, 125, 102939 CrossRef.
- R. Cuscó, E. Alarcón-Lladó, J. Ibáñez, L. Artús, J. Jiménez, B. Wang and M. J. Callahan, Phys. Rev. B: Condens. Matter Mater. Phys., 2007, 75, 165202 CrossRef.
- J. Serrano, A. H. Romero, F. J. Manjón, R. Lauck, M. Cardona and A. Rubio, Phys. Rev. B: Condens. Matter Mater. Phys., 2004, 69, 094306 CrossRef.
- K. F. Lin and W. F. Hsieh, J. Phys. D: Appl. Phys., 2008, 41, 215306 CrossRef.
- M. Šćepanović, M. Grujić-Brojčin, K. Vojisavljević, S. Bernikc and T. Srećković, J. Raman Spectrosc., 2010, 41, 914–921 CrossRef.
- Z. Geng, X. Kong, W. Chen, H. Su, Y. Liu, F. Cai, G. Wang and J. Zeng, Angew. Chem., Int. Ed., 2018, 57, 6054–6059 CrossRef CAS PubMed.
- J. J. Hassan, M. A. Mahdi, C. W. Chin, Z. Hassan and H. Abu-Hassan, Appl. Surf. Sci., 2012, 258, 4467–4472 CrossRef CAS.
- J. Das, I. R. Evans and D. Khushalani, Inorg. Chem., 2009, 48, 3508–3510 CrossRef CAS PubMed.
- R. Al-Gaashani, S. Radiman, A. R. Daud, N. Tabet and Y. Al-Douri, Ceram. Int., 2013, 39, 2283–2292 CrossRef CAS.
- A. Khorsand Zak, N. S. Abd Aziz, A. M. Hashim and F. Kordi, Ceram. Int., 2016, 42, 13605–13611 CrossRef CAS.
- A. M. Tayeb, M. A. Tony and E. K. Ismaeel, Appl. Water Sci., 2019, 9, 43 CrossRef.
- J. Yoon and S. G. Oh, J. Ind. Eng. Chem., 2021, 96, 390–396 CrossRef CAS.
- M. T. Qamar, M. Aslam, I. M. I. Ismail, N. Salah and A. Hameed, ACS Appl. Mater. Interfaces, 2015, 7, 8757–8769 CrossRef CAS PubMed.
- T. Wang, Q. Zhang, K. Lian, G. Qi, Q. Liu, L. Feng, G. Hu, J. Luo and X. Liu, J. Colloid Interface Sci., 2024, 655, 176–186 CrossRef CAS PubMed.
- M. G. Kibria, J. P. Edwards, C. M. Gabardo, C. T. Dinh, A. Seifitokaldani, D. Sinton and E. H. Sargent, Adv. Mater., 2019, 31, 1807166 CrossRef PubMed.
- Z. Chen, X. Zhang, W. Liu, M. Jiao, K. Mou, Z. Wang, F. Cheng, X. Zhang and L. Liu, A generalized amino-modification strategy to boost CO2 electroreduction current density of single-atom catalysts to industrial 2 application level Search PubMed.
- A. Nazarov, D. Thierry, P. Volovitch and K. Ogle, Surf. Interface Anal., 2011, 43, 1286–1298 CrossRef CAS.
- S. Verma, X. Lu, S. Ma, R. I. Masel and P. J. A. Kenis, Phys. Chem. Chem. Phys., 2016, 18, 7075–7084 RSC.
- C.-T. Dinh, T. Burdyny, M. G. Kibria, A. Seifitokaldani, C. M. Gabardo, F. Pelayo García De Arquer, A. Kiani, J. P. Edwards, P. De Luna, O. S. Bushuyev, C. Zou, R. Quintero-Bermudez, Y. Pang, D. Sinton and E. H. Sargent, CO2 electroreduction to ethylene via hydroxide-mediated copper catalysis at an abrupt interface Search PubMed.
- J. Lin, S. Yan, C. Zhang, Q. Hu and Z. Cheng, Processes, 2022, 10 Search PubMed.
- E. R. Cofell, U. O. Nwabara, S. S. Bhargava, D. E. Henckel and P. J. A. Kenis, ACS Appl. Mater. Interfaces, 2021, 13, 15132–15142 CrossRef CAS PubMed.
- S. S. Bhargava, F. Proietto, D. Azmoodeh, E. R. Cofell, D. A. Henckel, S. Verma, C. J. Brooks, A. A. Gewirth and P. J. A. Kenis, ChemElectroChem, 2020, 7, 2001–2011 CrossRef CAS.
- C. M. Gabardo, C. P. O’Brien, J. P. Edwards, C. McCallum, Y. Xu, C. T. Dinh, J. Li, E. H. Sargent and D. Sinton, Joule, 2019, 3, 2777–2791 CrossRef CAS.
- M. Serhan, M. Sprowls, D. Jackemeyer, M. Long, I. D. Perez, W. Maret, N. Tao and E. Forzani, in AIChE Annual Meeting, Conference Proceedings, American Institute of Chemical Engineers, 2019, vol. 2019- November.
- L. Xue, A. Zhang, J. Wu, Q. Wang, Y. Liu, Y. Zhao, S. Liu, Z. Liu, P. Li and S. Zeng, J. Alloys Compd., 2021, 882, 160703 CrossRef CAS.
- S. Ma, Y. Lan, G. M. J. Perez, S. Moniri and P. J. A. Kenis, ChemSusChem, 2014, 7, 866–874 CrossRef CAS PubMed.
- C. M. Gabardo, A. Seifitokaldani, J. P. Edwards, C. T. Dinh, T. Burdyny, M. G. Kibria, C. P. O’Brien, E. H. Sargent and D. Sinton, Energy Environ. Sci., 2018, 11, 2531–2539 RSC.
- J. Zeng, M. Fontana, A. Sacco, D. Sassone and C. F. Pirri, Catal. Today, 2022, 397–399, 463–474 CrossRef CAS.
- M. C. Figueiredo, I. Ledezma-Yanez and M. T. M. Koper, ACS Catal., 2016, 6, 2382–2392 CrossRef CAS.
- H. Li, K. Jiang, S. Z. Zou and W. Bin Cai, Chin. J. Catal., 2022, 43, 2772–2791 CrossRef CAS.
- Z. Jiang, H. Sun, T. Wang, B. Wang, W. Wei, H. Li, S. Yuan, T. An, H. Zhao, J. Yu and P. K. Wong, Energy Environ. Sci., 2018, 11, 2382–2389 RSC.
Footnote |
| † Electronic supplementary information (ESI) available. See DOI: https://doi.org/10.1039/d4ma00750f |
| This journal is © The Royal Society of Chemistry 2024 |

