 Open Access Article
Tandem NiO–Ni(OH)2/VS2 nanosheets: a robust photocatalyst for hydrogen evolution†
Mona S.
NourEldien
 *a,
Mostafa Y.
Nassar
 *ab,
Islam M.
Ibrahim
a and
Hisham M.
Aly
 a
a
aDepartment of Chemistry, Faculty of Science, Benha University, Benha 13518, Egypt. E-mail: mona.noureldin@fsc.bu.edu.eg; mynassar@kfu.edu.sa; m_y_nassar@fsc.bu.edu.eg; Tel: +20 01129618280 Tel: +20 00966538871438
bDepartment of Chemistry, College of Science, King Faisal University, P. O. Box 400, Al-Ahsa 31982, Saudi Arabia
First published on 26th October 2024
Abstract
The utilization of hydrogen as a sustainable alternative to fossil fuels is gaining momentum due to its environmental compatibility and recyclability. In this study, we present a novel approach employing a NiO–Ni(OH)2 hybrid decorated on VS2 nanosheets, synthesized through a facile one-pot hydrothermal method, for enhancing the photocatalytic activity in the hydrogen evolution reaction (HER) from a methanol–water mixture under visible light irradiation. The synthesized samples underwent comprehensive characterization via XRD, FT-IR, SEM, TEM, XPS, BET, optical bandgap determination, and electrochemical analyses including CV, LSV, Tafel slope, and EIS Nyquist plot. Characterization results revealed that the presence of a minor quantity of NiO–Ni(OH)2 effectively restrained the growth of VS2 crystallites, leading to a reduction in average crystallite size with increasing NiO–Ni(OH)2 content. XPS analysis confirmed the presence of NiO–Ni(OH)2 on VS2 and the oxidation states of V4+ and Ni2+ cations. Notably, the photocatalytic experiments demonstrated that NiO–Ni(OH)2 served as an excellent co-catalyst for enhancing H2 production over VS2, with the H2 production rate of 41642.2 μmol g−1 h−1 achieved with a loading of 0.8 mol% of NiO–Ni(OH)2 to VS2, surpassing the pristine VS2 by over fourfold. The enhanced H2 production activity was attributed to the accumulation of NiO–Ni(OH)2 particles on the VS2 surface, facilitating efficient movement of photoexcitons and minimizing photogenerated electron–hole pair recombination, thereby reducing hydrogen production overpotential and enhancing catalytic hydrogen generation. The outstanding performance and durability of the NiO–Ni(OH)2/VS2 photocatalyst suggest its potential as a cost-effective and promising candidate for hydrogen evolution reaction photocatalysis.
1. Introduction
Energy crises and environmental pollution from conventional energy sources (coal, oil, etc.) drive the transition to clean, renewable, and sustainable energy.1,2 Solar energy, the world's most abundant energy source for human consumption, has become a major research topic in the 21st century. Therefore, the efficient utilization and enhanced conversion efficiency of solar energy have significant implications for natural resources and the environment.3 Hydrogen (H2) is recognized as one of the most reliable options.4–6 Hence, it is highly recommended to collect and preserve solar energy resources by converting solar energy and water into hydrogen through decomposition.7,8 Semiconductor photocatalysis represents a promising, cost-effective, and environmentally friendly engineering approach for facilitating the photocatalytic H2 evolution reaction. Numerous semiconductor photocatalysts responsive to both UV and visible light have been developed.9–11Recently, transition metal oxides, sulfides, selenides, and phosphides have emerged as effective photocatalysts, replacing noble-metal catalysts.12–14 Notably, there has been significant attention toward layered two-dimensional (2D) transition metal dichalcogenide (TMDC) materials including VS2, WS2, and MoS2. This is because they possess a distinctive 2D layered structure similar to graphene and contain catalytically active edge sites.3,15,16 Vanadium disulfide (VS2), a transition metal dichalcogenide (TMD), features a hexagonal graphite structure with a 5.76 Å lattice spacing.17 Its composition comprises layers arranged in an S–V–S structure, wherein two sulfur layers are interconnected via the van der Waals force.18 This unique structure facilitates the separation of photogenerated positive and negative charges during light-catalyzed processes.19 Furthermore, the layered VS2 exhibited exceptional efficiency in generating hydrogen at its metallic edges.19,20 It is well-known that photocatalysis involves light absorption, carrier movement, electron–hole separation, and surface reactions.21 The quantum efficiency of photocatalysts is primarily limited by severe photo-corrosion and rapid recombination of photogenerated carriers.22,23 The catalytic efficacy of VS2 encounters such significant challenges, necessitating the incorporation of an electron-trapping co-catalyst to facilitate water reduction to H2.24,25 Despite VS2 nanosheets (NS) meeting several energy criteria for being an effective HER photocatalyst, there are no reports yet of VS2 nanosheets-based photocatalysts that fully exploit the potential of VS2 for HER. On the calculation aspect; (i) VS2 NSs are stable under light in aqueous solutions and do not experience photocorrosion. After the photocatalytic process, they can be easily retrieved from the water mixture. (ii) The valence band of VS2 NSs is expected to have a higher positive charge compared to the redox potential of O2(g)/H2O(L) (1.23 V vs. NHE at pH = 0). Conversely, its conduction band should have a lower negative charge than the redox potential of the H+/H2(g) couple (0 V vs. NHE at pH = 0). And (iii) VS2 NSs have a band gap exceeding 1.6–1.8 eV, as documented in the literature.24,26 These conditions align with the specified criteria necessary for an effective HER photocatalyst.27 Consequently, the development and implementation of catalysts centered around VS2 remain a priority in enhancing the efficiency of photocatalytic water splitting for hydrogen production.18
While precious metals such as platinum (Pt), silver (Ag), and ruthenium dioxide (RuO2) exhibit high efficiency as cocatalysts in the hydrogen evolution reaction, their scarcity and cost constrain their applicability in photocatalytic hydrogen gas production.28,29 Conversely, in recent years, transition metal nickel-based cocatalysts have attracted considerable interest in photocatalysis due to their cost-effectiveness, widespread availability, structural robustness, ease of preparation, and commendable performance in the hydrogen evolution reaction (HER).30–33 Mostly, the catalytic efficiency of nano-oxides is notably affected by their composition, morphological structure, particle size, and surface properties; these factors can be influenced by the synthetic methods employed.34,35 In oxide nanoparticles, the surface area is typically much greater than that of bulk materials.36 Consequently, surface species exhibit distinct local geometries compared to the bulk, significantly influencing chemical reactivity.37,38 NiO nanoparticles are characterized by excellent hole mobility, hybrid shells, cost-effectiveness, electrical conductivity, and catalytic properties.39,40 In addition, the Ni(OH)2 material also has a significant impact on photocatalytic hydrogen production, similar to NiO cocatalysts.41–43 The high electronegativity of Ni(OH)2 may contribute to the reduction of photogenerated carrier recombination.33 Integrating NiO and Ni(OH)2 within a binary cocatalyst system is anticipated to enhance photocatalytic HER efficiency. Recent findings have highlighted NiO/Ni(OH)2 as an efficient cocatalyst for H2 generation.44,45 This is attributed to the material's work function, which facilitates the separation of photoexcited charge carriers on the photocatalyst, resulting in the generation of sufficient active species for H+ reduction to H2.42
Therefore, this study presents a new interconnected heterostructure comprising VS2 integrated with a co-catalyst system of NiO–Ni(OH)2. Using a straightforward one-step hydrothermal technique, the NiO–Ni(OH)2/VS2 nanocomposite was synthesized and exhibited a robust photocatalytic activity for the hydrogen evolution reaction (HER) under visible light (λ ≥ 420 nm). Employing methanol as a sacrificial reagent, the optimized NiO–Ni(OH)2/VS2 catalyst demonstrated a fourfold enhancement in photocatalytic HER activity compared to pristine VS2. The remarkable photocatalytic activity can be attributed to the rapid electron transfer rate and minimal recombination of photogenerated electron–hole pairs facilitated by NiO–Ni(OH)2 on the VS2 surface. Furthermore, a potential mechanism for the photocatalytic HER was proposed, and the catalyst's recyclability was thoroughly investigated and clarified. Ni(OH)2/VS2 and NiO/VS2 were also synthesized for comparison purposes to highlight the role of the NiO–Ni(OH)2 hybrid material in photocatalytic hydrogen evolution reaction (HER).
2. Experimental
All the chemicals were utilized in their original form without additional purification. Sodium orthovanadate (Na3VO4,99%), thioacetamide (CH3CSNH2, 99%), nickel chloride (NiCl2·6H2O, 99%), sodium hydroxide (NaOH, 99%), ethanol (C2H5OH, 99.9%), methanol (CH3OH, 99.5%), sulfuric acid (H2SO4, 98%) and polyvinylidene fluoride (PVDF, 99%) were purchased from Sigma-Aldrich company. Deionized (DI) water served as the solvent and was employed for washing purposes throughout the studies.2.1 Synthesis of Ni-based cocatalyst species (Ni(OH)2, NiO–Ni(OH)2 and NiO)
Initially, Ni(OH)2 was synthesized employing a hydrothermal reaction.46 Briefly, NiCl2·6H2O (1.0 g, 4.21 mmol, 1.00 eq.) and NaOH (1.0 g, 25.0 mmol, 5.94 eq.) were dissolved separately in 100 mL of DI water under stirring for 1 hour. Subsequently, both solutions were combined with stirring. The green gel product solution was transferred to a Teflon-lined autoclave housed within a stainless steel enclosure. This setup was then heated at 180 °C for 10 hours. After the thermal treatment, the product was washed with deionized (DI) water and subsequently dried at 60 °C to yield β-Ni(OH)2. Subsequently, the product was subjected to heat in the air at 250 °C, with a ramp rate of 1 °C per minute, for 2 and 4 hours to obtain NiO–Ni(OH)2 and NiO nanoparticles, respectively.47 Following thorough grinding and rinsing with DI water and ethanol for at least three cycles, the calcined samples were vacuum-dried at 60 °C for 3 hours.2.2 Synthesis of VS2 and Ni-based cocatalysts/VS2 nanocomposites
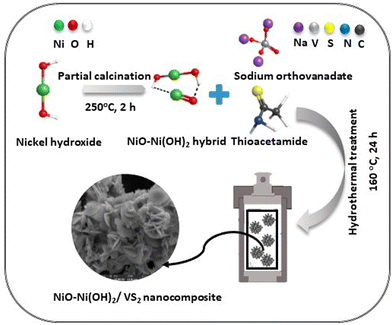
The synthesis of the optimal NiO–Ni(OH)2/VS2 nanocomposites involved a one-pot hydrothermal method. Initially, thioacetamide (TAA) (1.127 g, 15.0 mmol, 5.00 eq.) and sodium orthovanadate (Na3VO4) (0.5517 g, 3.00 mmol, 1.00 eq.) were dissolved in 30 mL of deionized (DI) water. The resulting mixture was magnetically stirred for 1 hour to ensure homogeneity. Subsequently, 0.10 g of NiO–Ni(OH)2 was added to the solution and stirred for an additional hour. The combined solution was then transferred into a 100 mL Teflon-lined stainless autoclave, sealed, and placed in an oven maintained at 160 °C for 24 hours. After cooling, the final product was washed with ethanol and DI water multiple times. The resulting black powder was vacuum-dried at 80 °C for 10 hours. To provide a basis for comparison, we also prepared Ni(OH)2/VS2 and NiO/VS2 nanocomposite using the same procedure mentioned earlier. The synthesis process of NiO–Ni(OH)2/VS2 optimal nanocomposite is illustrated in Scheme 1. Various NiO–Ni(OH)2/VS2 nanocomposites with different molar ratios (mol%) of NiO–Ni(OH)2 to VS2 were prepared. The nominal mol% of NiO–Ni(OH)2 to VS2 was set as 0, 0.2, 0.4, 0.6, 0.8, and 1, and the corresponding samples were denoted as VS2, VN0.2, VN0.4, VN0.6, VN0.8, and VN1, respectively. Pristine VS2 (prepared using the same process without adding NiO–Ni(OH)2) was also synthesized for comparison purposes.152.3 Photocatalytic generation of hydrogen
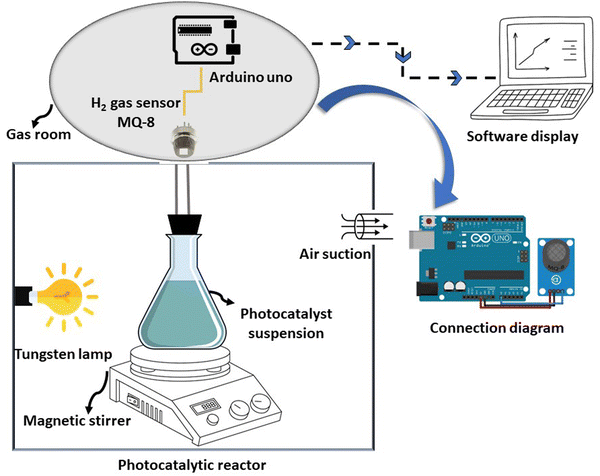
The photocatalytic hydrogen generation capability of the as-prepared photocatalysts was assessed as follows: Initially, 20 mg of the photocatalyst was introduced into a 50 mL methanol aqueous solution (10 vol%) in a sealed Pyrex reactor. This reactor was illuminated internally by a 200 W tungsten lamp and kept at room temperature. The reaction setup involved sonication for 15 minutes to ensure even distribution of the photocatalyst. Subsequently, nitrogen was passed through to eliminate air before exposing it to light. Each measurement underwent 30 minutes of magnetic stirring. The MQ-8 gas sensor was employed to quantify hydrogen production.48,49 In the absence of hydrogen, the sensor's resistance was denoted as Ro. An increase in hydrogen concentration leads to a decrease in the resistance, Rs of the sensor. Therefore, the amount of hydrogen gas detected by the sensor was determined from the ratio of Rs to Ro. For this experiment, we calibrated the MQ-8 gas sensor using 99.99% pure hydrogen. The value of Rs/Ro was 1 at 0 ppm hydrogen concentration, 0.09 at 1000 ppm, and 0.04 at 10![[thin space (1/6-em)]](https://www.rsc.org/images/entities/char_2009.gif) 000 ppm, demonstrating a logarithmic decrease with increasing hydrogen concentration. Arduino Uno Software can save hydrogen gas generation in ppm onto computer memory by attaching Rs/Ro changes to a microcontroller.11 H2 concentration, detected in ppm by a gas sensor, was converted to μmol g−1. The experiment for hydrogen production through photocatalysis was conducted three times using the most efficient photocatalyst. The experimental setup is depicted in Scheme 2.
000 ppm, demonstrating a logarithmic decrease with increasing hydrogen concentration. Arduino Uno Software can save hydrogen gas generation in ppm onto computer memory by attaching Rs/Ro changes to a microcontroller.11 H2 concentration, detected in ppm by a gas sensor, was converted to μmol g−1. The experiment for hydrogen production through photocatalysis was conducted three times using the most efficient photocatalyst. The experimental setup is depicted in Scheme 2.
The apparent quantum efficiencies (AQEs) of the pristine VS2 and the optimal NiO–Ni(OH)2/VS2 nanocomposite for the evolution of H2 were computed using the equation below:
 | (1) |
The light intensity was determined to be 10794.1 luminous m−2 or lux using a UT382 Luminometer (Uni-t, China), with an irradiation area of approximately 0.29 m2 at λ equals 420 nm. Therefore, the mean irradiance power was determined to be 689.65 W m−2 throughout the entire duration of photocatalytic hydrogen production.
Additionally, the stability of the VN0.8 nanocomposite was assessed through seven recycling trials, each cycle lasting 120 min per day. After each cycle, the reactor was kept in dark condition and purged with N2 gas before moving to the succeeding cycle.
2.4 Materials characterization
The structural analysis of the initial samples was performed using various techniques. X-ray diffraction (XRD) was conducted using a Bruker model D8 Advance instrument with Cu-Kα radiation and a 0.02° step interval. The identification of crystalline phases relied on comparing peak positions with standard JCPDS files. Fourier transform infrared spectroscopy (FT-IR) was employed to identify main functional groups, using a Thermo Scientific Nicolet iS10 instrument within the 4000–400 cm−1 range. N2 adsorption/desorption isotherms at 77 K were employed to examine the textural surface characteristics and pore size distribution using a BELSORP36 analyzer (JP. BEL Co., Ltd). Surface composition and chemical state analysis were carried out via X-ray photoelectron spectroscopy (XPS) using Thermo Fisher Scientific equipment with Al K-alpha radiation ranging from −10 to 1350 eV. Morphological examination utilized field emission scanning electron microscopy (FE-SEM) with energy dispersive X-ray (EDX) analysis, operating at 30 kV, and high-resolution transmission electron microscopy (HR-TEM) with in situ selective area electron diffractometry (SAED), performed using a JEM-2100 instrument at 200 kV. Additionally, diffuse reflectance spectra (DRS) were measured using a Jasco UV-visible spectrophotometer model V670 with an integral sphere model (ISN-723), referencing barium sulfate.2.5 Electrochemical measurements
To evaluate the electrochemical capabilities, a potentiostat (Digi-Ivy 2116, USA) was employed alongside a conventional three-electrode cell setup. The counter electrode comprised Pt wire, while an Ag/AgCl electrode saturated with KCl served as the reference electrode. The working electrode consisted of sample films deposited on ITO glass. The working electrodes were prepared as follows: 40 mg of the material was mixed with 8 mg of PVDF and 1 mL of ethanol to form a slurry, which was then coated onto the conductive surface of the ITO glass and air-dried. Cyclic voltammetry (CV) and linear sweep voltammetry (LSV) were conducted over the voltage range of 0.2 to 1 V at a scan rate of 5 mV s−1. Electrochemical impedance spectroscopy (EIS) was carried out using a Metrohm autolab (PGSTAT 204, Netherlands) over a frequency range of 10−1 Hz–100 kHz with an alternating current (AC) amplitude of 0.5 V. An aqueous solution of 1 M H2SO4 was used as the electrolyte. The measured potentials were transformed to the reversible hydrogen electrode (RHE) scale, applying the following eqn (2):14| E(V vs. RHE) = E(V vs. Ag/AgCl) + 0.0591 × pH + 0.198 | (2) |
2.6 Computational studies
The density functional theory (DFT) calculations were conducted using the Material Studio software, employing the CASTEP code.50 The exchange–correlation effects were modeled with the generalized gradient approximation (GGA), using the Perdew–Burke–Ernzerhof (PBE) functional. Core-electron interactions were treated using the projector augmented wave (PAW) method, while the electron wave functions were expanded using a plane-wave basis set with an energy cutoff of 400 eV. Geometry optimizations and electronic structure calculations were performed until convergence was reached using BFGS, with an energy tolerance of 10−5 eV. The convergence criteria of energy and force calculations were set to 5 × 10⁻⁶ eV per atom and 0.03 eV Å−1, respectively. All simulations employed periodic boundary conditions and a Monkhorst–Pack k-point mesh for Brillouin zone sampling. A vacuum region of 15 Å was applied to avoid interactions between the neighbouring configurations. This computational strategy provided insights into the adhesion energy and electronic interactions between VS2 and NiO–Ni(OH)2 in the hybrid material.3. Results and discussion
3.1 Characterization of photocatalysts
XRD analysis was employed to examine the crystalline patterns of both pristine and coupled VS2 samples. Fig. 1(a) displays the XRD patterns for VS2, VN0.2, VN0.4, VN0.6, VN0.8, and VN1, along with the standard spectrum line from JCPDS cards VS2 PDF (01-089-1640) and elemental S PDF (98-000-0420). The analysis confirmed a layered hexagonal VS2 crystal structure with lattice parameters a = b = 3.2210 Å and c = 5.7550 Å, as evidenced by comparing diffraction peaks (lattice planes) in the pristine sample with JCPDS card 01-089-1640 data.51 After the deposition of NiO–Ni(OH)2 nanoparticles, the characteristic peaks of VS2 shifted slightly to lower angles, corresponding to the change in d-spacing of the plane for VN0.2, VN0.4, VN0.6, VN0.8, and VN1 samples as shown in Table S2 (ESI†). The high intensity observed at 35.6° for both pure and supported VS2 samples elucidated the orientation of crystal growth in the (011) lattice plane, consistent with TEM findings. No noticeable diffraction peaks for NiO–Ni(OH)2 were observed. This is expected, given that NiO–Ni(OH)2 has a low loading amount, weak crystallinity, and is well-dispersed across the VS2 surface.52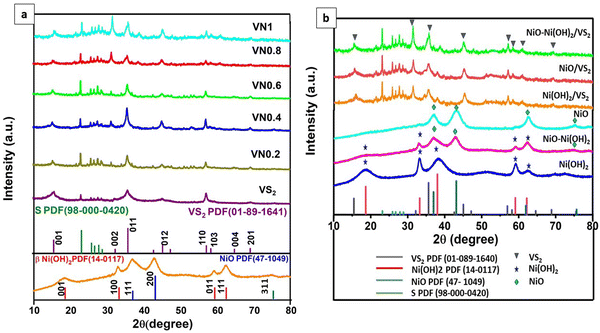 | ||
| Fig. 1 XRD patterns of (a) pristine VS2, NiO–Ni(OH)2 and NiO–Ni(OH)2/VS2 nanocomposites; and (b) Ni-based cocatalysts and their corresponding VS2 nanocomposites. | ||
The interplanar spacing ‘d’ for all lattice planes was determined by applying Bragg's law eqn (2),24 with results presented in Table S2 (ESI†),
nλ = 2d![[thin space (1/6-em)]](https://www.rsc.org/images/entities/char_2009.gif) sin sin![[thin space (1/6-em)]](https://www.rsc.org/images/entities/char_2009.gif) θ θ | (3) |
The crystallite size (D) was determined by the Debye–Scherer eqn (4),53 and shown in Table S2 (ESI†),
 | (4) |
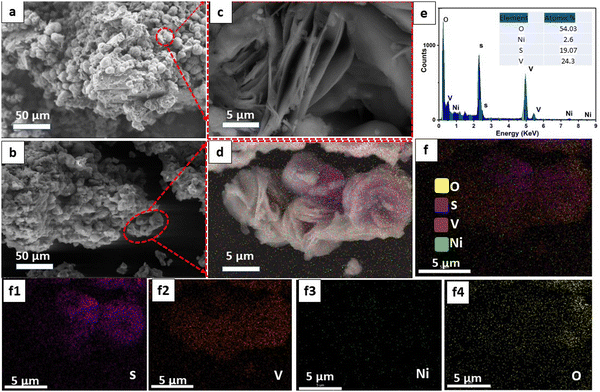
Additionally, the morphology of the samples was scrutinized via field-emission scanning electron microscopy (FE-SEM) and high-resolution transmission electron microscopy (HR-TEM), as depicted in Fig. 2 and 3, respectively. Fig. 2(a) displays a representative low-magnification FE-SEM image of VS2, revealing a flower-like microstructure comprising randomly stacked nanosheets. The high-resolution SEM image (Fig. 2(c)) provided a detailed visualization of these nanosheet layers, which were approximately 46 nm thick with a layer-to-layer distance average of 0.55 μm and arranged in an uneven orientation. In contrast, the optimal VN0.8 sample displayed a comparable spherical petal-like microstructure, characterized by a more uniform and highly porous morphology (Fig. 2(b)), with a calculated layer-to-layer distance average of 0.898 μm, which was greater than that of the pristine VS2. The incorporation of NiO–Ni(OH)2 into VS2 is expected to lead to an expansion in the in-between layer spacing, as it reduces the van der Waals forces between the layers. Larger distances between layers can lead to increased porosity within the material.14 This can enhance the accessibility of the active sites for reactions and improve the overall surface area. Energy-dispersive X-ray (EDX) analysis of the VN0.8 sample (Fig. 2(e)) confirmed the presence of V, S, Ni, and O elements, uniformly distributed throughout the sample. The corresponding EDX element maps displayed the element distribution of V, S, and Ni (Fig. 2(f)), indicating that the VN0.8 nanosheets are composed of V, S, O, and Ni elements.
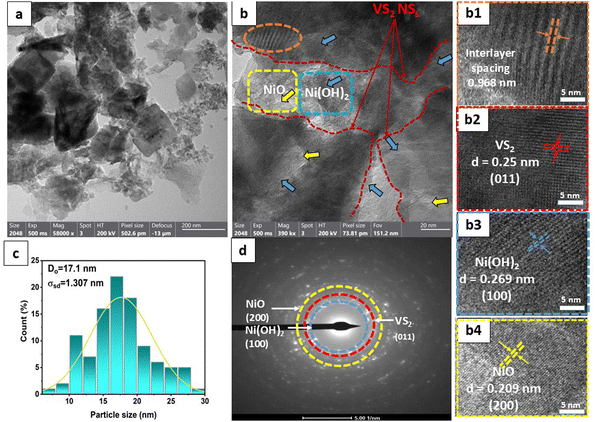
Fig. 3(a) displays the presence of nanosheet-like structures in VN0.8. TEM analysis can reveal the interface between the NiO–Ni(OH)2 cocatalyst and the VS2 nanosheets. A clearly defined interface suggests the presence of interaction between the two materials, as illustrated in Fig. 3(a) and (b). The arrows in Fig. 3(b) highlight that the NiO–Ni(OH)2 phases are evenly dispersed within the VS2 interlayers. Also, the interaction between NiO–Ni(OH)2 and VS2 layers is characterized by the expansion of interlayer spacing in VS2, akin to the behavior seen in other metal disulfides.60,61 The enlarged interlayer spacing (from approximately 0.575 of VS2 nm to 0.968 nm of VN0.8), suggested the tightly attached of this heterostructure by interactions, including electrostatic forces, with abundant interfaces.62,63 The other highlighted areas showed a periodic lattice fringe pattern with an interplanar spacing “d” of 0.25, 0.209, and 0.269 nm, corresponding to the (011) crystal plane VS2,64 (200) lattice plane of NiO,65 and (100) of Ni(OH)2,66 respectively. The SAED pattern for the as-synthesized NiO–Ni(OH)2/VS2 nanocomposite, as shown in Fig. 3(d), suggested that it possessed a polycrystalline structure. The VN0.8 sample's average particle size was calculated by fitting the particle size distribution histogram to the log-normal distribution function, which is represented as eqn (5)67,68
 | (5) |
Furthermore, X-ray photoelectron spectroscopy (XPS) analysis was conducted to examine the chemical composition and surface states of the VN0.8 sample. Fig. 4(e) shows the survey spectrum of VN0.8, indicating the presence of vanadium, sulfur, nickel, and oxygen elements with quantitative analysis closely aligning with the EDX results. Additionally, the detection of carbon in the survey scan suggested potential environmental contamination. The high-resolution XPS spectra of V 2p, S 2p, Ni 2p, and O 1s are displayed in Fig. 4(a)–(d). Fig. 4(a) revealed that V 2p peaks are observed at binding energies (B. Es) of 524.7 and 523.4 eV, corresponding to V 2p3/2, and at 517 eV and 516 eV, corresponding to V 2p1/2, respectively.69 This finding suggested that vanadium existed in the +4 oxidation state in VN0.8. The V 2p3/2 and V 2p1/2 peaks in the pristine VS2 were detected at 516.4 eV and 524.09 eV, respectively, indicating a shift of 0.61 eV to higher binding energy in VN0.8.The core level high-resolution S 2p spectrum was deconvoluted into five peaks and presented in Fig. 4(c). The peaks located at 162.8 and 163.53 eV corresponded to the S 2p3/2 and S 2p1/2 of S2− species, respectively. The peak at B.E. 164.4 eV corresponded to the presence of elemental sulfur in a low coordination state.14,70 Additional peaks around B.E. 168.9 eV and 168.29 eV could be attributed to sulfate ions, suggesting slight oxidization of VN0.8 in the air.71 The S atoms of VS2 had lower electronegativity (2.58).72 This hindered the formation of hydrogen bonds with the hydrogen atoms in Ni(OH)2. Interestingly, the S 2p peaks in the VN0.8 nanocomposite exhibited a slight shift towards higher binding energy when compared to pure VS2. The Ni 2p XPS spectrum in Fig. 4(b) exhibited eight distinct deconvoluted peaks. Major peaks at ca. 874.1 and 856.5 eV corresponded to Ni 2p1/2 and Ni 2p3/2, respectively, indicative of Ni(OH)2 phases with a spin energy separation of 17.6 eV, suggesting the presence of Ni2+ ions. Furthermore, peaks at around 879.2 eV and 861.1 eV corresponded to Ni 2p1/2 and Ni 2p3/2 satellites, consistent with previous literature reports.73 The signal at 858.27 eV for Ni 2p3/2 was attributed to Ni+2 in Ni(OH)2,74 while the spin–orbit splitting of nickel, Ni 2p1/2, and Ni 2p3/2 revealed peaks at 876.5 and 882 eV, attributing to Ni2+ in the sample.75 The signal at B. E 865.45 eV was associated with the Ni–O interactions, such as nickel oxides and Ni–OH.76 Interestingly, the Ni 2p peaks in the VN0.8 nanocomposite exhibited a 0.6 eV shift towards lower binding energy when compared to pure NiO–Ni(OH)2. As shown in Fig. 4(d), the O1s spectrum was broken up into three components. The peaks at 532.0 and 530.9 eV corresponded to Ni–O–Ni and Ni–O–H bonds, respectively,77 while the peak at 530.2 eV could be ascribed to O2− in octahedral symmetry (bulk O), coinciding with OH− of Ni(OH)2.78 The shifts in the observed peaks of V, S, and Ni suggested possible electron transfer from VS2 to NiO–Ni(OH)2, indicating a strong coupling effect between VS2 and NiO–Ni(OH)2.79 These findings revealed the significant electronic interactions between NiO–Ni(OH)2 and VS2, potentially altering the reactivity of VS2 near the interface.
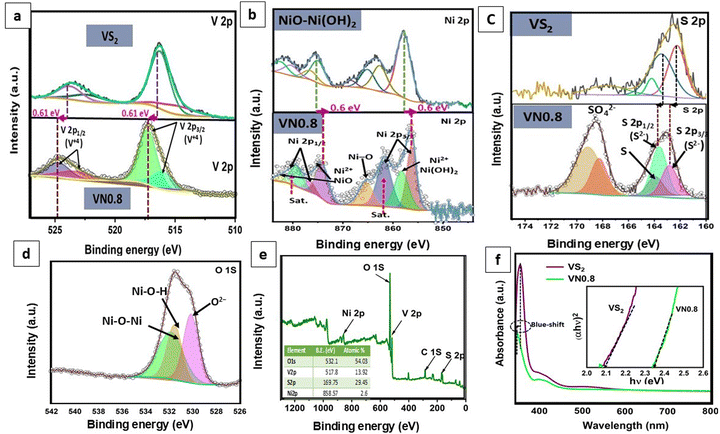 | ||
| Fig. 4 (a)–(e) XPS spectra: (a) V 2p, (b) Ni 2p, (c) S 2p, (d) O 1s, and (e) survey spectrum of VN0.8; (f) UV/Vis DRS spectra and (inset) band-gap energy plot of VS2 and VN0.8 samples. | ||
The optoelectronic properties of the VS2 and VN0.8 samples were investigated by UV-vis diffuse reflectance spectra. Fig. 4(f) presented a broad absorption peak found in the range of 300–450 nm for both VS2 and VN0.8. The alteration in the absorption peak resulting from coupling indicated a modification in the band structure. The absorption wavelength of VN0.8 exhibited a blue shift (355 nm) in comparison to its bulk counterpart VS2 (360 nm), attributed to quantum confinement effects arising from the reduction in nanoparticle size.80,81 The 2D nature of VS2 led to quantum confinement effects that adjust emission wavelengths and band gaps.82 The blue shift indicated a decrease in particle size and an increase in band gap energy, which could be elucidated by the Burstein–Moss shift.83 The optical band gap (Eg) was estimated using the fundamental absorption, which involves electron excitation from the valence to the conduction band. The band gap values were determined using eqn (6).
| (αhν)2 = A(hν − Eg)n | (6) |
Further comparison of FT-IR spectra between supported VS2 samples and pristine VS2 was conducted. The spectra confirmed the presence of the V4+ oxidation state (Fig. 5(a)). There was no considerable change in the lineaments of both V![[double bond, length as m-dash]](https://www.rsc.org/images/entities/char_e001.gif) S and V–S–V peaks. Which could be assigned to the major number of V4+ centers present in the samples. The peaks centered at 515 and 983 cm−1, indicated the ν (V–S–V) stretching and ν (V
S and V–S–V peaks. Which could be assigned to the major number of V4+ centers present in the samples. The peaks centered at 515 and 983 cm−1, indicated the ν (V–S–V) stretching and ν (V![[double bond, length as m-dash]](https://www.rsc.org/images/entities/char_e001.gif) S) in VS2, respectively.84,85 In the hybrid composites, the peak at 515 cm−1 showed a slight shift in wavenumber, indicating changes in the vibrational environment due to the composite formation. Additionally, the presence of a peak at approximately 1059 cm−1 in some of the as-prepared samples could be attributed to carbonate groups resulting from the interaction of samples with atmospheric CO2 during the analysis process.86
S) in VS2, respectively.84,85 In the hybrid composites, the peak at 515 cm−1 showed a slight shift in wavenumber, indicating changes in the vibrational environment due to the composite formation. Additionally, the presence of a peak at approximately 1059 cm−1 in some of the as-prepared samples could be attributed to carbonate groups resulting from the interaction of samples with atmospheric CO2 during the analysis process.86
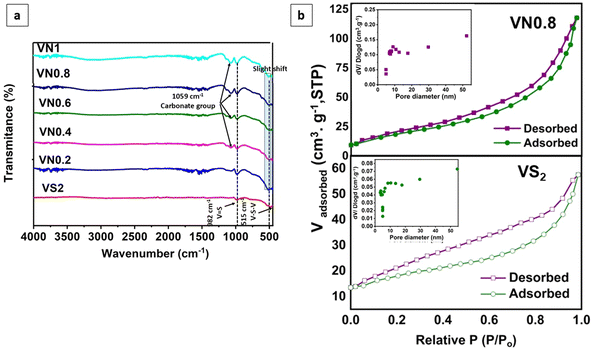 | ||
| Fig. 5 (a) FT-IR spectra of the pristine and supported VS2 samples, and (b) BET nitrogen adsorption and desorption isotherms of VS2 and VN0.8 and pore size distributions (inset). | ||
The porosity of the VN0.8 nanosheets was analyzed using the BET technique based on N2 adsorption–desorption isotherm as shown in Fig. 5(b) and Table 1. The hysteresis loop observed for VN0.8 and VS2 suggested the presence of mesopores. The loop resembles a type H3 hysteresis, which is associated with slit-like pores or aggregates of plate-like particles.87 The specific surface area of VN0.8 was 61.1 m2 g−1, which was notably higher than the 20.82 m2 g−1, observed for VS2. This suggested that incorporating NiO–Ni(OH)2 increased the surface area of VS2, thereby improving its efficiency in photocatalytic hydrogen evolution reactions. The inset in Fig. 5(b) illustrates the distributions of pore sizes.
3.2 Electrocatalytic performance
The electrochemical performance of NiO–Ni(OH)2 supported VS2 nanosheets, specifically the optimal sample VN0.8, was evaluated using cyclic voltammetry (CV) analysis. The analysis was operated in a three-electrode system using a 1 M H2SO4 as an electrolyte (see the Experimental section for more details). Fig. 6(a) shows the cyclic voltammograms (CVs) for pristine VS2 and VN0.8. The CV analysis yields two critical parameters: current density and peak-to-peak potential difference (ΔEPP). These values serve as indicators of the catalytic activity on the electrode surface. A higher current density signifies greater redox catalytic activity at the electrode surface. The peak-to-peak potential difference in a redox system is inversely related to the redox reaction rate.88Fig. 6(a) demonstrated that pristine VS2 displays two broad peaks, suggesting its faradaic redox capability. The introduction of NiO–Ni(OH)2 to VS2 nanosheets resulted in peak current density increasing. Calculations of the peak-to-peak potential difference for the VS2 and VN0.8 revealed that the pristine VS2 NSs engaged in the redox reaction with greater intensity compared to the NiO–Ni(OH)2-supported VS2, as evidenced by its lower ΔEPP at 0.03 V. Table S3 (ESI†) displays the peak-to-peak potential differences along with the reduction and oxidation peak values for pristine VS2 and VN0.8 samples. The results indicated that adding NiO–Ni(OH)2 to VS2 NSs reduced its redox capability, resulting in a higher peak-to-peak potential difference. However, there seemed to be a rise in catalytic activity observed in the VN0.8 approach level, surpassing that observed in the pristine VS2 NSs. Introducing a cocatalyst into the photocatalyst might alter the energy levels and produce new trap states, improving the separation of photogenerated electron–hole pairs, also the VN0.8 electrodes demonstrated high current density and low onset potential, which indicated that VN0.8 enhances electron migration.89 This could be a plausible explanation for the observed behavior of the improved HER activity of VN0.8 even with a small slowdown in the pace of the redox reactions. This enhanced charge separation could result in greater photocatalytic activity for hydrogen production.55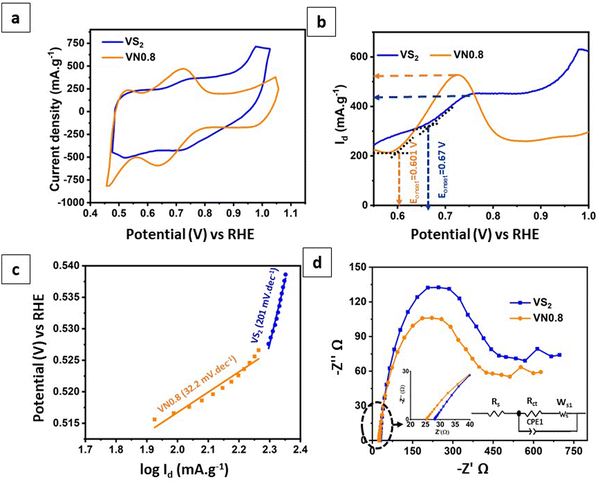 | ||
| Fig. 6 (a) CVs; (b) LSV curves; (c) the relevant Tafel plots derived from LSV curves; and (d) EIS Nyquist plots of pristine VS2 and VN0.8 with the corresponding equivalent circuit. | ||
Fig. 6(b) shows linear sweep voltammetry (LSV) curves for VS2 and VN0.8. All of the electrodes exhibit anodic currents in the range of 0.5 to 1 V (against RHE). Notably, the catalytic activity was most prominently demonstrated by the VN0.8 electrode, which exhibited a low onset potential of 0.81 V against RHE and a high anodic current density (Id) of 520 mA g−1. In contrast, pure VS2 had a high onset potential of 0.9![[thin space (1/6-em)]](https://www.rsc.org/images/entities/char_2009.gif) V versus RHE and a relatively low anodic current of 430 mA g−1. This result indicated that the introduction of NiO–Ni(OH)2 can reduce the onset potential while enhancing the current density of VS2. This, in turn, led to the dissociation of water and concomitantly generated more hydrogen intermediates (Had) on the nearby VS2 to form H2.90
V versus RHE and a relatively low anodic current of 430 mA g−1. This result indicated that the introduction of NiO–Ni(OH)2 can reduce the onset potential while enhancing the current density of VS2. This, in turn, led to the dissociation of water and concomitantly generated more hydrogen intermediates (Had) on the nearby VS2 to form H2.90
Furthermore, the kinetics of the hydrogen evolution reaction (HER) were examined through linear fittings of Tafel plots. A lower Tafel slope generally indicates faster charge transfer ability.14Fig. 6(c) illustrated that the kinetics of VN0.8 were notably efficient, as indicated by its low Tafel slope of 32.2 mV dec−1, and demanded less energy for the HER. It showed that the HER route of VN0.8 obeyed the Volmer–Tafel mechanism. Conversely, pristine VS2 exhibited a high Tafel slope (201 mV dec−1), indicating slower kinetics due to the sluggish Volmer step.
To better explain how charge transfer carriers move across the surface, we’ve included electrochemical impedance spectroscopy (EIS) Nyquist plots in Fig. 6(d), along with a corresponding equivalent circuit. As observed, the introduction of NiO–Ni(OH)2 into VS2 resulted in a smaller radius arc for the photocatalyst compared to pure VS2, indicating reduced resistance. The VN0.8 electrode showed relatively low solution resistance (Rs = 25.37 Ω) and charge-transfer resistance (Rct = 372 Ω), indicating easier charge transport between the electrolyte and electrode compared to pure VS2 (Rct = 28.19 Ω and Rct = 414 Ω). Reducing resistance benefited electron transfer and lowered electron–hole pair recombination.
Therefore, the above findings suggested that VS2, supported with optimal Ni species (0.8NiO–Ni(OH)2), may serve as an excellent hydrogen photocatalyst. This could be attributed to the reduced particle size which occurred on the coupling of VS2 with NiO–Ni(OH)2. Also, it exhibited expanded interlayer spacing, which helped to prevent the recombination of electron–hole pairs. Additionally, the incorporation of NiO–Ni(OH)2 into VS2 increased the intensity of catalytically active sites. And improved the electrochemical characteristics of VS2.
3.3 Photocatalytic hydrogen generation
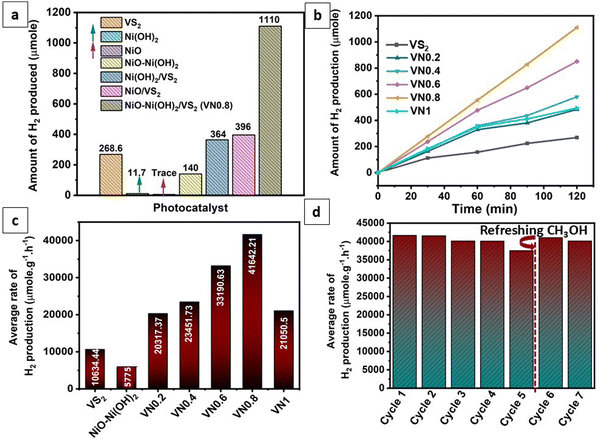
Photocatalytic hydrogen generation experiments were performed on the as-prepared samples using methanol as a sacrificial reagent under visible light irradiation. Fig. 7(a) illustrates a comparison of hydrogen production rates among various compositions including pure β-Ni(OH)2, NiO–Ni(OH)2, NiO, VS2, Ni(OH)2/VS2, NiO/VS2 and NiO–Ni(OH)2/VS2. The findings indicated that the NiO/Ni(OH)2 hybrid composites exhibited superior photocatalytic performance compared to those comprising pure Ni compounds (Ni(OH)2 and NiO). This improvement in the NiO–Ni(OH)2 hybrid was attributed to the enhanced electron transfer facilitated by the good electrical conductivity of NiO, along with the synergistic effects and additional active sites provided by Ni(OH)2. This combination resulted in improved catalytic performance during faradaic reactions.91 Pristine VS2, as well as various NiO–Ni(OH)2-supported VS2 nanocomposites (VN0.2, VN0.4, VN0.6, VN0.8, and VN1) were individually tested for their photocatalytic hydrogen production capacity, and the experimental results are displayed in Fig. 7(b). It was observed that pristine VS2 NSs exhibited relatively low photocatalytic H2 production efficiency compared to supported VS2 samples. It could be a result of the rapid photogenerated electrons and hole recombination. As seen, the NiO–Ni(OH)2 composition significantly affects the photocatalytic H2 generation efficiency of VS2. The trend noticed for the photocatalytic hydrogen production was VS2< VN0.2 < VN1 < VN0.4 < VN0.6 < VN0.8. The VN0.8 sample was identified as an ideal composition, showcasing a hydrogen production rate of 41642.2 μmol g−1 h−1 and an associated AQE of 38.46%. This rate surpassed that of pure VS2 by approximately fourfold (10634.44 μmol g−1 h−1; 9.3% AQE). Due to the incorporation of NiO–Ni(OH)2 into VS2 NSs, surface active sites increased and photogenerated holes (+h) and electrons (é) recombined less during photocatalytic HER. Particularly, when the NiO–Ni(OH)2 load was 1 mol%, the VN1 sample exhibited a significant decline in its H2-production activity. This phenomenon could be attributed to the accumulation of an excessive amount of NiO–Ni(OH)2 clusters, reducing VS2 active sites, avoiding interaction with sacrificial reagents or water molecules, and reducing light absorption.55Table 2 provides a comparison of the photocatalytic hydrogen production efficiencies of various previously reported photocatalysts, highlighting that VS2 is being utilized as a photocatalyst in hydrogen production for the first time. This comparison elucidated the superiority of the photocatalytic HER performance and the low cost of the optimal VN0.8, compared with the reported ones.| Photocatalyst name | Catalyst amount (mg) | Solution volume (mL) | Hole scavenger | Light source | Yield of H2 gas (μmol g−1 h−1) | Ref. |
|---|---|---|---|---|---|---|
| NiO–Ni(OH)2/VS2 | 20 | 50 | Methanol | 200 W tungsten lamp | 41![[thin space (1/6-em)]](https://www.rsc.org/images/entities/char_2009.gif) 624 624 |
Recent study |
| Cu(OH)2/TiO2 | 5 | 50 | Glycerol | 250 W xenon lamp | 27![[thin space (1/6-em)]](https://www.rsc.org/images/entities/char_2009.gif) 592 592 |
92 |
| Sulfur vacancies-VS2@C3N4 | 20 | 50 | Methanol | 300 W xenon lamp | 11![[thin space (1/6-em)]](https://www.rsc.org/images/entities/char_2009.gif) 840 840 |
19 |
| CdS/VS2 | 30 | 100 | Mix of Na2S and Na2SO3 | 300 W xenon lamp | 799.8 | 93 |
| NiO/TiO2 | 50 | 80 | Methanol | 300 W Xenon lamp | 377 | 55 |
| VS2/g-C3N4 | 50 | 85 | Triethanolamine | 300 W Xenon lamp | 1748 | 94 |
| Phosphorus supported CN–TiO2 | 40 | 100 | Methanol | 1000 W Xenon lamp | 2531 | 95 |
| Bi2O2CO3/g-C3N4@PAN | 50 | 100 | Methanol | 300 W Xenon lamp | 5396 | 96 |
| α-Fe2O3/CdS/g-C3N4 | 100 | 50 | Mix of Na2S and Na2SO3 | 1000 W Xenon lamp | 165 | 48 |
| NiO@La(OH)3/g-C3N4 | 20 | 100 | Triethanolamine | 300 W Xenon lamp | 602.3 | 97 |
| α-NiS/CdS | 30 | 70 | Lactic acid | 300 W Xenon lamp | 5501.9 | 98 |
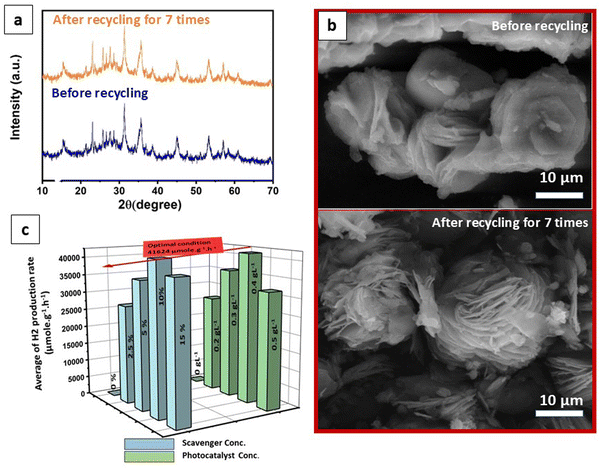
In addition, to assess the recyclability of the photocatalyst, repeat recycling stability experiments were conducted on the optimized VN0.8 catalyst. As illustrated in Fig. 7(d), The photocatalytic activity of the VN0.8 nanocomposite remained relatively consistent during the first two days of experimentation. However, starting from the third day and continuing through the fourth and fifth days, a gradual and slight decrease in activity was observed, which could be attributed to the depletion of methanol, the sacrificial agent, in the solution. To address this, an additional 5 mL of fresh methanol was added prior to the sixth cycle. This replenishment restored the hydrogen production rate as equivalent to that of the first two days, demonstrating that the temporary decline in performance was due to the reduction of available methanol, rather than the degradation of the photocatalyst itself. Additionally, XRD patterns and SEM images of the VN0.8 catalyst before and after recycling experiments were nearly identical (as shown in Fig. 8(a) and (b)), further confirming the immutability and stability of the VN0.8 catalyst. Although TEM and XPS analyses were conducted after the recycling experiments, as shown in (Fig. S4 and S5, ESI†). For TEM features, the overall structure of the material remained mostly intact. However, slight agglomeration or clustering was observed, likely due to repeated cycling, as indicated in (Fig S4, ESI†). Despite this minor structural change, the preservation of the material's integrity suggests that the photocatalyst maintained good stability throughout the recycling process. Following the recycling process, XPS analysis showed shifts in the binding energies of V, Ni and O (Fig. S5, ESI†). Specifically, Ni exhibited a reduction in its binding energy, indicating electron gain, while V displayed an increase, suggesting electron loss. During the photocatalytic process, the Ni atoms in NiO–Ni(OH)2 can be reduced, leading to the formation of Ni clusters. This is confirmed by the appearance of two additional peaks in the Ni 2p spectra at binding energies of 853.3 eV and 869.88 eV,99 following the hydrogen production reaction. The oxygen atoms will experience less electron withdrawal, decreasing their binding energy. These changes provide insight into the electron transfer occurring between the components of the heterostructure, demonstrating their interaction during the photocatalytic process.
The optimization of scavenger and photocatalyst concentrations was conducted using the optimized VN0.8 catalyst for hydrogen production, as depicted in Fig. 8(c). The same photocatalysis conditions were maintained for the optimization, except for the parameter being studied. Methanol concentration was altered from 0 to 15% (vol%). It was observed that in the absence of methanol (0% methanol solution), the amount of hydrogen produced was significantly negligible compared to solutions containing methanol. Notably, a methanol concentration of 10% provided the highest capacity for hydrogen evolution, yielding a production rate of 41642.2 μmol g−1 h−1. This finding confirmed the substantial role of methanol as a sacrificial agent. Methanol functioned by consuming holes from the valence band (VB) of the photocatalyst, thereby minimizing the recombination of photogenerated carriers and enhancing hydrogen evolution performance. However, it was also observed that there was a slight decrease in hydrogen evolution capacity as methanol concentration exceeded 10%. This increase in methanol concentration led to the formation of more intermediate products such as methane and CO2. These intermediates could further consume photogenerated excitons, consequently reducing the average rate of hydrogen production.100,101 As shown in Fig. 8(c), the average rate of H2 production significantly increased when the catalyst load was increased from 0 to 0.4 g L−1, reaching a value of 41642.2 μmol g−1 h−1. This can be attributed to the presence of more active sites on the photocatalyst surface with the higher dosage, leading to enhanced efficiency in the photogeneration of holes and electrons.102 It was conversely, increasing the catalyst loading upon 0.4 g L−1 resulted in higher solution opacity, which reduced the penetration of photon flux into the reactor and consequently lowered the photocatalytic degradation rate. Additionally, at high solid concentrations, particle–particle interactions cause agglomeration, leading to a loss in surface area.103 Therefore, the optimal concentration was determined to be 0.4 g L−1.
3.4 DFT calculations
The interactions between the NiO–Ni(OH)2 and the VS2 surface play a crucial role in determining the photocatalytic efficiency and stability of the heterostructures.104 To evaluate these interactions within the NiO–Ni(OH)2/VS2 heterostructure, the interface adhesion energy was computed using eqn (7):| Ead = (ENiO–Ni(OH)2/VS2 − EVS2 − ENiO–Ni(OH)2)/A | (7) |
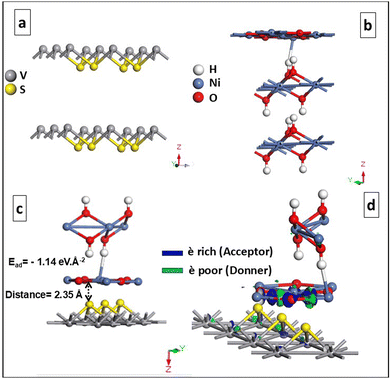 | ||
| Fig. 9 Geometrically optimized (0 1 1) slab structure of (a) VS2, (b) NiO–Ni(OH)2 and (c) NiO–Ni(OH)2/VS2; and (d) electron density difference of the NiO–Ni(OH)2/VS2 heterostructure. | ||
The electron density difference plot for the NiO–Ni(OH)2/VS2 heterostructure, shown in Fig. 9(d), clearly reveals the nature of charge transfer at the interface. The green regions indicate areas of electron depletion, primarily observed near the VS2 layer, while the blue regions represent electron accumulation, concentrated near the NiO–Ni(OH)2 structure. This suggests that the VS2 acts as an electron donor, transferring electrons to the NiO–Ni(OH)2, which behaves as an electron acceptor. The distinct separation between the charge accumulation and depletion zones highlights the interaction between the two materials, corresponding to electrostatic forces. These theoretical findings are consistent with the XPS data, which show that VS2 donates electrons, while NiO–Ni(OH)2 accepts them in the heterostructure, validating the electron transfer mechanism observed in both experimental and computational studies.
3.5 Proposed photocatalytic mechanism
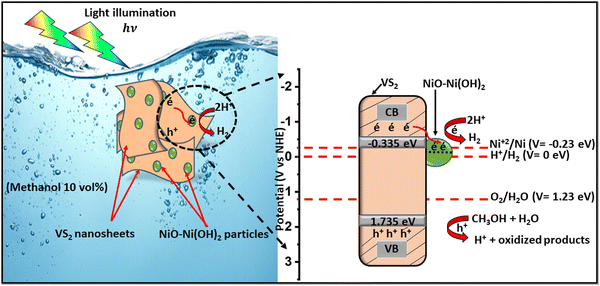
According to the computational results and XPS data, we can propose a catalytic mechanism that reveals the role of each component in the NiO–Ni(OH)2/VS2 heterostructure. The schematic elucidation is shown in Fig. 10. The valence band (VB) and conduction band (CB) positions of NiO–Ni(OH)2 and VS2 semiconductors were estimated from the empirical formulas (eqn (8) and (9)):106,107| EVB = χ − Ee + 0.5Eg | (8) |
| ECB = EVB − Eg | (9) |
| Semiconductor | E g (eV) | E CB (eV) | E VB (eV) |
|---|---|---|---|
| VS2 | 2.07 | −0.335 | 1.735 |
| NiO–Ni(OH)2 | 2.9 | −0.23 | 2.67 |
Under light illumination, electrons from the valence band (VB) of VS2 are excited to the conduction band (CB), generating positive holes in the VB. However, in the absence of NiO–Ni(OH)2, the hydrogen evolution rate is low due to the rapid recombination of charge carriers, which led to only a fraction of excitons participating in the photocatalytic reaction, resulting in low efficiency and a significant overpotential for H2 production. The addition of NiO–Ni(OH)2 allows CB electrons from VS2 to transfer to the CB of NiO–Ni(OH)2, facilitating spatial separation of the hole–electron pairs. This occurs because the CB potential of NiO–Ni(OH)2 (−0.23 eV vs. NHE) is more favorable than that of VS2 (about −0.335 eV vs. NHE). Photogenerated electrons transferred in this process can efficiently reduce some Ni2+ ions to Ni0 atoms, leading to the formation of Ni clusters, as confirmed by the XPS results (Fig. S5b, ESI†). These metal Ni clusters served as effective cocatalysts, enhancing hydrogen production and lowering the overpotential for hydrogen generation. As a result, the deposited NiO–Ni(OH)2 not only inhibited the recombination of photogenerated electron–hole pairs in VS2 and promoted hydrogen formation, but also prevents the reverse reaction of H2 and O2 by separating the evolution sites of hydrogen and oxygen.108 The positive holes in the VB of VS2 can oxidize CH3OH into H+ ions, which are then reduced by the photogenerated electrons at the NiO–Ni(OH)2 surface to yield H2 gas. Metallic Ni particles generated in situ can transfer electrons to H+ ions to reduce them to H2, effectively regenerating the NiO–Ni(OH)2 cocatalyst.42 Furthermore, the presence of both NiO–Ni(OH)2 provided active sites for the hydrogen evolution reaction (HER), with NiO acting as a charge transfer mediator and Ni(OH)2 as a hydroxyl group donor,91 accelerating the HER process and reflected in the enhanced current densities observed in our electrochemical studies.
4. Conclusions
In conclusion, we have introduced a facile and efficient method for fabricating a superior photocatalyst with remarkable durability for hydrogen generation via photocatalysis. A novel NiO–Ni(OH)2/VS2 nanocomposite was synthesized utilizing a hydrothermal synthesis approach. The as-prepared NiO–Ni(OH)2/VS2 nanocomposites were comprehensively verified using various techniques including XRD, SEM, TEM, EDX, XPS, BET and FT-IR. The photocatalytic performance of the synthesized materials was extensively investigated for the hydrogen evolution reaction (HER) utilizing methanol as a scavenger. Our experimental findings highlighted the exceptional photocatalytic efficiency of the NiO–Ni(OH)2/VS2 (VN0.8 sample), which exhibited a hydrogen evolution rate of 41642.2 μmol g−1 h−1 under visible light irradiation, surpassing that of pure VS2. Furthermore, the VN0.8 sample demonstrated outstanding stability under prolonged light exposure. The enhanced photocatalytic activity of VN0.8 can be primarily attributed to the incorporation of the NiO–Ni(OH)2 cocatalyst. This cocatalyst provides suitable potential sites to facilitate the transfer of photo-generated electrons and offers an increased number of active sites for enhancing the photocatalytic reduction reaction. Electrochemical measurements, including LSV, Tafel plots, and EIS Nyquist plots, demonstrated that the incorporation of NiO–Ni(OH)2 nanoparticles significantly improved charge separation and electron transfer efficiency. This study serves as a representative example illustrating the pivotal role of the NiO–Ni(OH)2 co-catalyst in the development of highly efficient photocatalysts.Ethical approval
Institutional Review Board Statement: the study was conducted and approved according to the guidelines of the declaration of the ethical committee of the Faculty of Science, Benha University (no. BUFS-REC-2024-164Chm).Author contributions
Ideas, M. Y. N. and H. M. A.; oversight and leadership responsibility for the research activity planning and execution, M. Y. N. and H. M. A.; verification, M. S. N. and H. M. A.; visualization/data presentation, M. Y. N., I. M. I., M. S. N. and H. M. A.; computational, M. Y. N. and M. S. N.; provision of study materials, M. Y. N. and M. S. N.; commentary and revision—including pre- and post-publication stages, M. Y. N.; conducting a research and investigation process, M. S. N.; development or design of methodology, M. S. N.; writing the initial draft, M. S. N.; formulation or evolution of overarching research goals and aims, H. M. A.; management and coordination responsibility for the research activity planning and execution, H. M. A.; critical review, H. M. A. and M. S. N.; formal techniques to analyze study data, H. M. A. All authors have reviewed and approved the final version of the manuscript for publication.Data availability
This article incorporates all the data produced or examined during this study.Conflicts of interest
The authors declare no conflict of interest.Acknowledgements
This research received no external funding.References
- S. Chu and A. Majumdar, Nature, 2012, 488, 294–303 Search PubMed.
- T. R. Cook, D. K. Dogutan, S. Y. Reece, Y. Surendranath, T. S. Teets and D. G. Nocera, Chem. Rev., 2010, 110, 6474–6502 Search PubMed.
- J. Xia, F. Wang, M. Zhou, K. Lu, W. Huang, C. Yu and K. Yang, J. Solid State Chem., 2023, 317, 123583 Search PubMed.
- J. Wang, H. Li, S. Meng, L. Zhang, X. Fu and S. Chen, Appl. Catal., B, 2017, 200, 19–30 Search PubMed.
- H. Zhang, F. Yu, Y. Wang, L. Yin, J. Li, J. Huang, X. Kong and Q. Feng, J. Chem. Eng., 2021, 426, 130777 Search PubMed.
- Y. Zhang, B. Chen, Y. Qiao, Y. Duan, X. Qi, S. He, H. Zhou, J. Chen, A. Yuan and S. Zheng, J. Mater. Sci., 2024, 201, 157–165 Search PubMed.
- X. Chen, S. Shen, L. Guo and S. S. Mao, Chem. Rev., 2010, 110, 6503–6570 Search PubMed.
- A. Kudo and Y. Miseki, Chem. Soc. Rev., 2009, 38, 253–278 Search PubMed.
- K. Chang, Z. Mei, T. Wang, Q. Kang, S. Ouyang and J. Ye, ACS Nano, 2014, 8, 7078–7087 Search PubMed.
- J. Hou, Y. Lei, F. Wang, X. Ma, S. Min, Z. Jin and J. Xu, Int. J. Hydrogen Energy, 2017, 42, 11118–11129 Search PubMed.
- Y. K. Sofi’i, E. Siswanto, T. Ueda and I. N. G. Wardana, Int. J. Hydrogen Energy, 2020, 45, 22613–22628 Search PubMed.
- J. Jia, L. Zheng, K. Li, Y. Zhang and H. Xie, J. Chem. Eng., 2022, 429, 132432 Search PubMed.
- M. Niu, L. Cao, Q. Liu, X. Li, Q. Chen, D. Liu, W. Li, J. Huang and L. Feng, Catalysis, 2022, 12, 998 Search PubMed.
- V. K. Singh, U. T. Nakate, P. Bhuyan, J. Chen, D. T. Tran and S. Park, J. Mater. Chem. A, 2022, 10, 9067–9079 Search PubMed.
- B. Balan, M. M. Xavier and S. Mathew, ACS Omega, 2023, 8, 25649–25673 Search PubMed.
- W. Liu, Y. Xiong, Q. Liu, X. Chang and J. Tian, J. Colloid Interface Sci., 2023, 651, 633–644 Search PubMed.
- A. Joseph and P. Aneesh, Mater. Res. Bull., 2022, 146, 111623 Search PubMed.
- S. A. Patil, N. K. Shrestha, H. T. Bui, V. D. Chavan, D. K. Kim, S. F. Shaikh, M. Ubaidullah, H. Kim and H. Im, Int. J. Energy Res., 2022, 46, 8413–8423 Search PubMed.
- G. Li, X. Deng, P. Chen, X. Wang, J. Ma, F. Liu and S.-F. Yin, J. Chem. Eng., 2022, 433, 134505 Search PubMed.
- Y. Zhang, Y.-Z. Lin, Z.-X. Wang, K. Li, T. Li and F.-T. Liu, Catal. Sci. Technol., 2019, 9, 583–587 Search PubMed.
- M.-Z. Xu, Q. Li, Y.-Y. Lv, Z.-M. Yuan, Y.-X. Guo, H.-J. Jiang, J.-W. Gao, J. Di, P. Song and L.-X. Kang, Tungsten, 2020, 2, 203–213 Search PubMed.
- X. Ning, J. Li, B. Yang, W. Zhen, Z. Li, B. Tian and G. Lu, Appl. Catal., B, 2017, 212, 129–139 Search PubMed.
- Y. Huang, F. Sun, T. Wu, Q. Wu, Z. Huang, H. Su and Z. Zhang, J. Solid State Chem., 2011, 184, 644–648 Search PubMed.
- M. Bhosale, G. Palanisamy, K. Selvakumar, S. Thangarasu and T.-H. Oh, J. Alloys Compd., 2023, 969, 172350 Search PubMed.
- X. Zong, H. Yan, G. Wu, G. Ma, F. Wen, L. Wang and C. Li, J. Am. Chem. Soc., 2008, 130, 7176–7177 Search PubMed.
- B. Hu, Y. Zhang, J. Zhang, J. Liu, M. Lei, C. Zhao, Q. Lu, H. Wang, F. Du and S. Zhang, New J. Chem., 2023, 47, 10973–10983 Search PubMed.
- L. Clarizia, D. Russo, I. Di Somma, R. Andreozzi and R. Marotta, Energies, 2017, 10, 1624 Search PubMed.
- B. Cao, G. Li and H. Li, Appl. Catal., B, 2016, 194, 42–49 Search PubMed.
- L. Zhang, N. Ding, L. Lou, K. Iwasaki, H. Wu, Y. Luo, D. Li, K. Nakata, A. Fujishima and Q. Meng, Adv. Funct. Mater., 2019, 29, 1806774 Search PubMed.
- A. Šuligoj, I. Arčon, M. Mazaj, G. Dražić, D. Arčon, P. Cool, U. L. Štangar and N. N. Tušar, J. Mater. Chem. A, 2018, 6, 9882–9892 Search PubMed.
- F. Zhang, Y. Dong, P. Jiang, G. Wang, N. Zhao, H. Zhang, D. Li, J. Lyu, Y. Wang and J. Li, Chem. – Asian J., 2019, 14, 4193–4200 Search PubMed.
- C.-C. Hu and H. Teng, J. Catal., 2010, 272, 1–8 Search PubMed.
- X. Liu and H. Zhuang, Int. J. Energy Res., 2021, 45, 1480–1495 Search PubMed.
- E. Kammar, E. Gad and M. Mousa, J. Therm. Anal. Calorim., 2022, 147, 1–17 Search PubMed.
- L. Liu, Y. Wang, Q. Liu, W. Wang, L. Duan, X. Yang, S. Yi, X. Xue and J. Zhang, Appl. Catal., B, 2019, 256, 117806 Search PubMed.
- X. Ruan, Y. Yang, K. Pu, M. Gao, Y. Liu and H. Pan, J. Power Sources, 2018, 397, 134–142 Search PubMed.
- M. A. Peck and M. A. Langell, Chem. Mater., 2012, 24, 4483–4490 Search PubMed.
- E. Lucas, S. Decker, A. Khaleel, A. Seitz, S. Fultz, A. Ponce, W. Li, C. Carnes and K. J. Klabunde, Chem. – Eur. J., 2001, 7, 2505–2510 Search PubMed.
- P. Ahuja, S. K. Ujjain, I. Arora and M. Samim, ACS Omega, 2018, 3, 7846–7855 Search PubMed.
- T. Sreethawong, Y. Suzuki and S. Yoshikawa, Int. J. Hydrogen Energy, 2005, 30, 1053–1062 Search PubMed.
- M. Hojamberdiev, M. M. Khan, Z. Kadirova, K. Kawashima, K. Yubuta, K. Teshima, R. Riedel and M. Hasegawa, Renewable Energy, 2019, 138, 434–444 Search PubMed.
- N. Lakshmana Reddy, K. K. Cheralathan, V. Durga Kumari, B. Neppolian and S. Muthukonda Venkatakrishnan, ACS Sustainable Chem. Eng., 2018, 6, 3754–3764 Search PubMed.
- M. Hojamberdiev, M. M. Khan, Z. Kadirova, K. Kawashima, K. Yubuta, K. Teshima, R. Riedel and M. Hasegawa, Renewable Energy, 2019, 138, 434–444 Search PubMed.
- X. Yu, J. Zhang, Z. Zhao, W. Guo, J. Qiu, X. Mou, A. Li, J. P. Claverie and H. Liu, Nano Energy, 2015, 16, 207–217 Search PubMed.
- J. Yu, Y. Hai and B. Cheng, J. Phys. Chem. C, 2011, 115, 4953–4958 Search PubMed.
- Y. Ren, L. Wang, Z. Dai, X. Huang, J. Li, N. Chen, J. Gao, H. Zhao, X. Sun and X. He, Int. J. Electrochem. Sci., 2012, 7, 12236–12243 Search PubMed.
- B. K. Kim, V. Chabot and A. Yu, Electrochim. Acta, 2013, 109, 370–380 Search PubMed.
- C. Yavuz and S. Erten-Ela, J. Alloys Compd., 2022, 908, 164584 Search PubMed.
- Z. Balta and E. B. Simsek, Int. J. Hydrogen Energy, 2023, 48, 26781–26794 Search PubMed.
- M. Segall, P. J. Lindan, M. A. Probert, C. J. Pickard, P. J. Hasnip, S. Clark and M. Payne, J. Condens. Matter Phys., 2002, 14, 2717 Search PubMed.
- J. Wen, T. Jiang and S. Arken, Hydrometallurgy, 2020, 198, 105498 Search PubMed.
- J. Yu, S. Wang, B. Cheng, Z. Lin and F. Huang, Catal. Sci. Technol., 2013, 3, 1782–1789 Search PubMed.
- Bhawna, R. Sharma, S. Kumar, R. Kumar, P. K. Sahu, V. Kumari, A. K. Mishra and V. Kumar, Separations, 2023, 10, 322 Search PubMed.
- A. Joseph and P. Aneesh, Mater. Res. Bull., 2022, 146, 111623 Search PubMed.
- L. Li, B. Cheng, Y. Wang and J. Yu, J. Colloid Interface Sci., 2015, 449, 115–121 Search PubMed.
- D. Wu, C. Wang, M. Wu, Y. Chao, P. He and J. Ma, J. Energy Chem., 2020, 43, 24–32 Search PubMed.
- X. Sun, G. Wang, J.-Y. Hwang and J. Lian, J. Mater. Chem. A, 2011, 21, 16581–16588 Search PubMed.
- H. Yan, D. Zhang, J. Xu, Y. Lu, Y. Liu, K. Qiu, Y. Zhang and Y. Luo, Nanoscale Res. Lett., 2014, 9, 1–7 Search PubMed.
- Z. Qin, Y. Wang, X. Huang, W. Shen, J. Yu and J. Li, J. Inorg. Organomet. Polym. Mater., 2020, 30, 2089–2097 Search PubMed.
- J. Zhang, C. Zhang, Z. Wang, J. Zhu, Z. Wen, X. Zhao, X. Zhang, J. Xu and Z. Lu, Small, 2018, 14, 1703098 Search PubMed.
- U. N. Pan, T. I. Singh, D. R. Paudel, C. C. Gudal, N. H. Kim and J. H. Lee, J. Mater. Chem. A, 2020, 8, 19654–19664 Search PubMed.
- B. Yang, A. G. Tamirat, D. Bin, Y. Yao, H. Lu and Y. Xia, Adv. Funct. Mater., 2021, 31, 2104543 Search PubMed.
- Q. Mu, W. Zhu, X. Li, C. Zhang, Y. Su, Y. Lian, P. Qi, Z. Deng, D. Zhang and S. Wang, Appl. Catal., B, 2020, 262, 118144 Search PubMed.
- W. A. Haider, M. Tahir, L. He, W. Yang, A. Minhas-khan, K. A. Owusu, Y. Chen, X. Hong and L. Mai, J. Alloys Compd., 2020, 823, 151769 Search PubMed.
- A. Kotta, E.-B. Kim, S. Ameen, H.-S. Shin and H. K. Seo, J. Electrochem. Soc., 2020, 167, 167517 Search PubMed.
- J. Jian, X. Kou, H. Wang, L. Chang, L. Zhang, S. Gao, Y. Xu and H. Yuan, ACS Appl. Mater. Interfaces, 2021, 13, 42861–42869 Search PubMed.
- H. Jalili, B. Aslibeiki, A. G. Varzaneh and V. A. Chernenko, Beilstein J. Nanotechnol., 2019, 10, 1348–1359 Search PubMed.
- J. Gubicza, J. Szépvölgyi, I. Mohai, L. Zsoldos and T. Ungár, Mater. Sci. Eng., A, 2000, 280, 263–269 Search PubMed.
- J. Zhu, L. Cai, X. Yin, Z. Wang, L. Zhang, H. Ma, Y. Ke, Y. Du, S. Xi and A. T. Wee, ACS Nano, 2020, 14, 5600–5608 Search PubMed.
- M. Y. Nassar, M. S. NourEldien, I. M. Ibrahim and H. M. Aly, Processes, 2023, 11, 1322 Search PubMed.
- X. Zhong, J. Tang, J. Wang, M. Shao, J. Chai, S. Wang, M. Yang, Y. Yang, N. Wang and S. Wang, Electrochim. Acta, 2018, 269, 55–61 Search PubMed.
- M. A. Mahadik, P. S. Shinde, H. H. Lee, M. Cho and J. S. Jang, Sol. Energy Mater. Sol. Cells, 2017, 159, 475–487 Search PubMed.
- H. Yan, J. Bai, J. Wang, X. Zhang, B. Wang, Q. Liu and L. Liu, CrystEngComm, 2013, 15, 10007–10015 Search PubMed.
- L. A. Hutton, M. Vidotti, A. N. Patel, M. E. Newton, P. R. Unwin and J. V. Macpherson, J. Phys. Chem. C, 2011, 115, 1649–1658 Search PubMed.
- M. M. Hussain, M. M. Rahman and A. M. Asiri, J. Environ. Sci., 2017, 53, 27–38 Search PubMed.
- C. K. Rojas-Mayorga, D. I. Mendoza-Castillo, A. Bonilla-Petriciolet and J. Silvestre-Albero, Adsorpt. Sci. Technol., 2016, 34, 368–387 Search PubMed.
- S. R. Ede, S. Anantharaj, K. Kumaran, S. Mishra and S. Kundu, RSC Adv., 2017, 7, 5898–5911 Search PubMed.
- J. Zhao, H. Liu and Q. Zhang, Appl. Surf. Sci., 2017, 392, 1097–1106 Search PubMed.
- S. Zhang, J. Wang, N. L. Torad, W. Xia, M. A. Aslam, Y. V. Kaneti, Z. Hou, Z. Ding, B. Da and A. Fatehmulla, Small, 2020, 16, 1901718 Search PubMed.
- I. Abdul Rahman, M. Ayob and S. Radiman, J. Nanotechnol., 2014, 2014, 1–8 Search PubMed.
- M. M. Khan, W. Khan, M. Ahamed and A. N. Alhazaa, Sci. Rep., 2017, 7, 12560 Search PubMed.
- R. Kumar, T. K. Dhiman, G. Lakshmi, P. R. Solanki and K. Singh, J. Environ. Chem. Eng., 2024, 12, 112011 Search PubMed.
- N. R. Yogamalar and A. Chandra Bose, Appl. Phys. A: Mater. Sci. Process., 2011, 103, 33–42 Search PubMed.
- G. M. Kumar, P. Ilanchezhiyan, H. D. Cho, D. J. Lee, D. Y. Kim and T. W. Kang, Int. J. Energy Res., 2020, 44, 811–820 Search PubMed.
- W. Fang, H. Zhao, Y. Xie, J. Fang, J. Xu and Z. Chen, ACS Appl. Mater. Interfaces, 2015, 7, 13044–13052 Search PubMed.
- Y. Ghalmi, F. Habelhames, A. Sayah, A. Bahloul, B. Nessark, M. Shalabi and J. M. Nunzi, Ionics, 2019, 25, 6025–6033 Search PubMed.
- A. Zhilkina, A. Gordienko, N. Prokudina, L. Trusov, G. Kuz’micheva, N. Dulina and E. Savinkina, Russ. J. Phys. Chem. A, 2013, 87, 674–679 Search PubMed.
- E. Meyer, A. Bede, D. Mutukwa, R. Taziwa and N. Zingwe, J. Energy Storage, 2020, 27, 101074 Search PubMed.
- L. Li, J. Xu, M. Mao, X. Li, S. Zhao, Z. Liu and Y. Li, Appl. Surf. Sci., 2019, 481, 692–701 Search PubMed.
- K. Xiong, L. Huang, Y. Gao, H. Zhang, Y. Zhuo, H. Shen, Y. Wang, L. Peng and Z. Wei, Electrochem. Commun., 2018, 92, 9–13 Search PubMed.
- B. K. Kim, V. Chabot and A. Yu, Electrochim. Acta, 2013, 109, 370–380 Search PubMed.
- S. K. Lakhera, T. Rugma, R. Krishna, N. Rabiee and N. Bernaurdshaw, Catal. Today, 2023, 423, 114007 Search PubMed.
- M. Niu, L. Cao, L. Feng, D. He, X. Li, Q. Chen, C. Fu and J. Huang, ChemNanoMat, 2022, 8, e202200163 Search PubMed.
- M. Shao, Y. Shao, S. Ding, J. Wang, J. Xu, Y. Qu, X. Zhong, X. Chen, W. F. Ip and N. Wang, Appl. Catal., B, 2018, 237, 295–301 Search PubMed.
- S. Wadhai, Y. Jadhav and P. Thakur, Sol. Energy Mater. Sol. Cells, 2021, 223, 110958 Search PubMed.
- Y. Chen, H. Zhang, K. Liu, X. Zhu, H. Yuan and C. Wang, Appl. Surf. Sci., 2022, 599, 154013 Search PubMed.
- Y. Wang, L. Gao, J. Huo, Y. Li, W. Kang, C. Zou and L. Jia, J. Chem. Eng., 2023, 460, 141667 Search PubMed.
- X. Zhang, Y. Zhou, L. Shen, Q. Ou, L. Zhou, S. Jiang, Y. Jia, S. Zhang and H. Wang, J. Mol. Struct., 2024, 1303, 137576 Search PubMed.
- A. L. Luna, E. Novoseltceva, E. Louarn, P. Beaunier, E. Kowalska, B. Ohtani, M. A. Valenzuela, H. Remita and C. Colbeau-Justin, Appl. Catal., B, 2016, 191, 18–28 Search PubMed.
- C. R. López, E. P. Melián, J. O. Méndez, D. E. Santiago, J. D. Rodríguez and O. G. Díaz, J. Photochem. Photobiol., A, 2015, 312, 45–54 Search PubMed.
- B. Bakbolat, C. Daulbayev, F. Sultanov, R. Beissenov, A. Umirzakov, A. Mereke, A. Bekbaev and I. Chuprakov, Nanomaterials, 2020, 10, 1790 Search PubMed.
- M. M. Mohamed, W. Bayoumy, M. Goher, M. Abdo and T. M. El-Ashkar, Appl. Surf. Sci., 2017, 412, 668–682 Search PubMed.
- S. Kaneco, M. A. Rahman, T. Suzuki, H. Katsumata and K. Ohta, J. Photochem. Photobiol., A, 2004, 163, 419–424 Search PubMed.
- F. Opoku, K. K. Govender, C. G. C. E. Van Sittert and P. P. Govender, New J. Chem., 2017, 41, 11701–11713 Search PubMed.
- J. Zhang, Y. Wan, Z. Liu, J. Chen, G. Wang, H. Liu and R. Wang, J. Chem. Eng., 2021, 408, 127284 Search PubMed.
- M. Butler and D. Ginley, J. Electrochem. Soc., 1978, 125, 228 Search PubMed.
- Y. Xu and M. A. Schoonen, Am. Mineral., 2000, 85, 543–556 Search PubMed.
- J. Yu, Y. Hai and B. Cheng, J. Phys. Chem. C, 2011, 115, 4953–4958 Search PubMed.
Footnote |
| † Electronic supplementary information (ESI) available. See DOI: https://doi.org/10.1039/d4ma00789a |
| This journal is © The Royal Society of Chemistry 2024 |

