 Open Access Article
Exploring the potential of waste biomass of olive as an additive for layered double hydroxide/polyurethane as an effective and safe agent for the adsorption of drug residues: a bioremediation approach†
Rania
Abdelazeem
a,
W.
Kamal
b,
Zienab E.
Eldin
c,
Mahmoud Abdelrazek
Roshdy
d,
Ahmed A.
Allam
ef,
Sara
Saeed
b,
Doaa Abdel
Tawab
b,
Sarah I.
Othman
g,
Abeer Enaiet
Allah
 b,
Abdelatty M.
Radalla
b and
Rehab
Mahmoud
 *b
*b
aEnvironmental Science and Industrial Development Department, Faculty of Postgraduate Studies for Advanced Sciences, Beni-Suef University, Beni-Suef, Egypt. E-mail: raniashaban333@gmail.com
bChemistry Department, Faculty of Science, Beni Suef University, Beni Suef 62511, Egypt. E-mail: wesamkamal16@yahoo.com; sarasaeedabdelazeem@gmail.com; rehabkhaled@science.bsu.edu.eg; abeer.abdelaal@science.bsu.edu.eg; Doaaabd@yahoo.com; amradalla@yahoo.com
cMaterials Science and Nanotechnology Department, Faculty of Postgraduate Studies for Advanced Sciences (PSAS), Beni-Suef University, Beni-Suef 62511, Egypt. E-mail: zienab_ryad@yahoo.com
dFaculty of Earth Sciences, Beni-Suef University, P. O. 62521, Beni-Suef, Egypt. E-mail: mahmoud.abd-elrazek0622.sd@esc.bsu.edu.eg
eDepartment of Zoology, Faculty of Science, Beni-suef University, Beni-suef 65211, Egypt. E-mail: Ahmed.aliahmed@science.bsu.edu.e.g
fDepartment of Biology, College of Science, Imam Mohammad bin Saud Islamic University, Riyadh 11623, Saudi Arabia
gDepartment of Biology, College of Science, Princess Nourah bint Abdulrahman University, P. O. BOX 84428, Riyadh 11671, Saudi Arabia. E-mail: sialothman@pnu.edu.sa
First published on 21st October 2024
Abstract
The increasing use of antibiotics worldwide and their presence in wastewater pose a risk to human health and the environment, even in minute amounts, making them potentially new and dangerous pollutants of the ecosystem. Drug resistance and changes in the biological cycle are two of the negative consequences of chemical pollution. The development of affordable, practical, and recyclable adsorbents is imperative because of the significant threat that the rise in antibiotic residues poses to aquatic and ecological settings. The accumulation of pharmaceutical compounds in aqueous solutions has been lessened by a number of strategies, including adsorption onto the surface of agricultural wastes. Bioactive substances such as vitamins, carotenoids, and polyphenols are abundant in pomace, including minerals, proteins, cellulose, lignin, and pectin. All of these substances exhibit sorption characteristics with respect to pharmaceutical compounds in addition to their many other positive health effects. X-Ray diffraction (XRD), Fourier transform infrared (FTIR) spectroscopy, scanning electron microscopy (SEM), Brunauer–Emmett–Teller (BET) analysis and particle size analysis were used to thoroughly examine olive pomace (O-Pom), layered double hydroxide (LDH), polyurethane (PU) and LDH/PU/O-Pom composites. FTIR spectroscopy of O-Pom and LDH/PU/O-Pom before and after the adsorption of cefotaxime was performed and the results were discussed. Next, the effects of several parameters, including pH, adsorbent amount, concentration, and contact time, on wastewater treatment efficiency were investigated. We studied nonlinear adsorption isotherm models at pH 5 using O-Pom and O-Pom-LDH/PU, which showed maximum adsorption capacities (qmax) of 163.23 mg g−1 for O-Pom and 250 mg g−1 for LDH/PU/O-Pom. By identifying the most suitable isotherm, error functions are used to assess the validity of the adsorption mathematical models against experimental data, as precise adsorption equilibrium information is essential for adsorption analysis and design. Additionally, we compared the investigated models with the corrected Akaike information criterion (AIC) to confirm that more fitting models were used in the isotherm study. The model that best fitted according to the AIC calculated for O-Pom was the Freundlich model, and the AIC values were 69.23 and 63.91 for O-Pom and LDH/PU/O-Pom, respectively. In addition, ethanol was used as a regeneration agent for the tested adsorbent loaded with cefotaxime. It retained a high removal percentage up to the fourth cycle. Additionally, kinetic experiments were carried out. The MTT assay results of normal Vero cells indicate that at the highest concentration of 1000 μg mL−1, LDH/PU, O-Pom, and LDH/PU/O-Pom resulted in cell viabilities of 66.7 ± 1.1%, 61 ± 1%, and 61.8 ± 1.3%, respectively, suggesting their low cytotoxicity and potential suitability for water treatment applications without significant health risks. LDH/PU/O-Pom demonstrated the highest antibacterial activity against both Gram-positive and Gram-negative bacteria, with E. coli being the most sensitive (MIC, 60 μg mL−1) and B. cereus being the least susceptible (MIC, 250 μg mL−1), which was attributed to differences in bacterial cell surface structures, indicating its potential as an effective water treatment agent. According to the cost analysis, the synthesis of LDH/PU/O-Pom involves a cost of 0.927 USD per g of the adsorbent, which is reasonable for large-scale industrial use. Greenness profile calculations of proposed chemical methods have become more popular worldwide. Many green chemistry calculation methods are now known to be used to evaluate the greenness of a method where many parameters, including quantity, toxicity, power, waste, miniaturization, and automation, are considered to determine how environmentally friendly an analytical methodology is. The analytical eco-scale (AES) method, the analytical method volume intensity (AMVI) method and the analytical GREENness (AGREE) calculator method were used for this assessment.
1. Introduction
One of the greatest problems of the twenty-first century is the lack of water, which has become a multifaceted crisis in recent decades.1 Another associated concern is the contamination of current water sources. Water pollution has an impact on aquatic vegetation and other life forms.2 Pharmaceutical compounds such as antibiotics are among the most harmful pollutants with nonbiodegradable structures. Prolonged exposure may alter the hormonal and genetic systems of humans, causing disease. Therefore, uncontrolled direct exposure to antibiotics in contaminated water presents a potential risk for both human health and the environment.3 The presence of antibiotics in water has increased due to the increasing population.4 Antibiotic contamination can arise from various sources, such as pharmaceutical industries, domestic sewage water, cattle, poultry, etc. These various resources lead to the presence of many antibiotics in a variety of aquatic environments, including urban, animal, and industrial wastewater.5 Despite the therapeutic benefits of antibiotics, some antibiotics have a wide range of adverse effects because they are not fully metabolized by people or animals when consumed. Consequently, releasing high levels of these antibiotics in aqueous environments (such as lakes and rivers) without sufficient treatment results in permanent harm to human health by enabling the appearance of antibiotic-resistant strains.6,7 Antibiotics may eventually become ineffective if this process is allowed to continue since organisms may eventually develop resistance.4 One of the most important types of cephalosporin antibiotics for treating infections caused by Gram-negative and Gram-positive bacteria is cefotaxime, which has an aromatic-ring structure and a lengthy half-life.8 It usually exists in wastewater and drinking water and is difficult to completely remove.9 Traditional wastewater treatment procedures cannot eliminate or significantly lower the amount of undesired antibiotics to the specified control standards.10 Many efficient treatment techniques based on oxidation, photocatalytic degradation, electrodegradation, biodegradation, and adsorption have been introduced. Some of these methods suffer some restrictions due to their complexity, time consumption, and uneconomical challenges.10Among these techniques, adsorption is considered the most effective method because it is a cheap, simple, promising method for removing antibiotics and organic and inorganic contaminants from water, as well as because of its insensitivity to toxic contaminants and lack of generation of toxic materials.5,11–14 Adsorption efficiency highly depends on the ability of the adsorbent to adsorb the pollutant effectively.
In Egypt, olive cultivation has significantly expanded over the past twenty years. This growth is attributed to substantial efforts aimed at increasing the acreage of olive groves using new cultivars in reclaimed lands. The key regions for olive production include the Nile Delta (El-Nubaria and Ismailia), El Arish, Al-Fayoum, and Marsa-Matruh, reflecting the strategic placement of these facilities as key agricultural regions.15 Owing to its fertile soil and ample water supply, the Nile Delta supports a dense network of olive mills, which are crucial for processing many olive harvests.16 El Arish, known for its ideal climatic conditions, also hosts numerous mills, capitalizing on its high-quality olive production.17 Al-Fayoum, an established agricultural center, has a significant concentration of olive mills that bolster the local farming economy.18 Marsa-Matruh, with its advantageous Mediterranean climate, further enhances the country's olive oil production capabilities with its well-placed mills.19 This distribution underscores the importance of leveraging diverse geographic and environmental conditions to optimize olive cultivation and oil production in Egypt.
Many studies have been conducted on different adsorbents, such as agricultural wastes and biomass materials, olive stones that have been used as an eco-friendly bioadsorbent for the elimination of methylene,20,21 silica,22 metal–organic frameworks (MOFs),23 and layered double hydroxides,23,24 to remove contaminants from wastewater. The scientific community's current focus is on finding adsorbents made from wastes, such as soil, mining materials, sludge, industrial byproducts, agricultural wastes, and sea materials, to replace synthetic adsorbents. In the context of the recent desire for environmental preservation and sustainability, interest in sorbents generated from agricultural wastes (stone fruits, nuts and husks, peels, forest residues, and plants) having potential for the remediation of contaminated effluents has increased.25 One of the most important biowastes is O-Pom. After olive oil is extracted from olives, they become solid wastes with a high cellulose content. They are typically regarded as waste products and are frequently disposed of or burned, which can cause environmental issues.26
Recently, it has been found that the products obtained from O-Pom, such as raw materials and biochar, might be useful for the adsorption of pollutants. Activated carbon made from O-Pom has been used in different studies to extract both organic and inorganic materials from wastewater.26,27 This substance can be used as an adsorbent for pharmaceuticals that can be harmful to the environment and human health, as well as for water purification.27,28
Owing to their high porosity, large surface area, and superior ion exchange capacity, layered double hydroxides (LDHs) have been explored as a potentially useful class of adsorbents. Although they are not widely distributed in the environment, LDHs are anionic clays that are simple to make in the laboratory. LDHs are composed of positively charged stacked layers that are separated by interlayers that are made of water and anions.29–31 Their general formula is [M1−x2+Mx3+(OH)2]x+[Ax/n]n–·mH2O, where An– is a valent anion, M3+ is a trivalent metal, and M2+ is a divalent metal.32 To further enhance the performance of O-Pom raw material as a model adsorbent for the removal of cefotaxime, the incorporation of LDH/PU within the O-Pom matrix to form a nanocomposite can be regarded as a vital strategy that has been followed by numerous researchers using different nanomaterials (Table S1, ESI†).33–35 The main objective of this research is not only to transform pomace waste into a resource, but also to use it as an antimicrobial agent against Gram-positive and Gram-negative bacteria, which can be highly practical. The antimicrobial properties of materials are crucial for ensuring the safety and quality of treated water.
2. Materials and methods
2.1. Chemicals
Cefotaxime (C16H17N5O7S2; assay 96–110%) was purchased from Arshine Pharmaceutical Co., Limited, China. O-Pom was obtained from an olive manufacturing facility in Fayoum, Egypt, and aluminum chloride (AlCl3, 99% purity) and zinc chloride (ZnCl2, 98% purity) were acquired from Loba Chemie (India). Sodium hydroxide (NaOH, 99.5% purity) was obtained from Piochem for Laboratory Chemicals in Egypt. The PU discs were supplied by the National Institute of Standards (NIS), which is located in Giza, Egypt. Double-deionized water was used to prepare all the experimental solutions. Furthermore, all the materials used were of reagent-grade purity and were used exactly as received.2.2. Materials preparation
![[thin space (1/6-em)]](https://www.rsc.org/images/entities/char_2009.gif) :
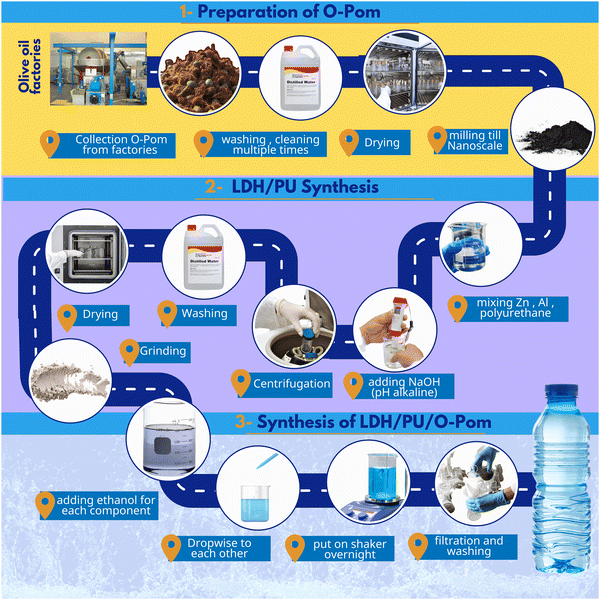
:![[thin space (1/6-em)]](https://www.rsc.org/images/entities/char_2009.gif) 1. ZnCl2 and AlCl3 were mixed in 200 mL of distilled water, and the mixture was used to submerge the PU discs. Next, NaOH (2 M) was added dropwise until the pH reached 10. This suspension was allowed to digest overnight. The PU discs began to create polymer powder under these alkaline conditions, which then covered the LDH phase. After the remaining discs were removed, the resulting powder was collected by centrifugation and rinsed with distilled water many times. Finally, the powder was dried at 80 °C overnight.
1. ZnCl2 and AlCl3 were mixed in 200 mL of distilled water, and the mixture was used to submerge the PU discs. Next, NaOH (2 M) was added dropwise until the pH reached 10. This suspension was allowed to digest overnight. The PU discs began to create polymer powder under these alkaline conditions, which then covered the LDH phase. After the remaining discs were removed, the resulting powder was collected by centrifugation and rinsed with distilled water many times. Finally, the powder was dried at 80 °C overnight.
2.3. Characterization
The crystallinity of the prepared material composite was determined using a PANalytical (Empyrean) X-ray diffractometer equipped with a Cu-Kα radiation source (wavelength 0.154 nm, I = 35 mA, V = 40 kV, and a scanning rate of 8° min−1). Fourier transform infrared (FTIR) spectroscopy (Bruker-Vertex 70, KBr pellet technique, Germany) was used to determine the functional groups between 400 and 4000 cm−1 wavenumbers. A field emission scanning electron microscope (Gemini Zeiss-Sigma 500 VP) was used to examine the morphology of the prepared adsorbents. The elemental composition of the prepared material was investigated via energy dispersive X-ray (EDX) spectroscopy.2.4. Adsorption study
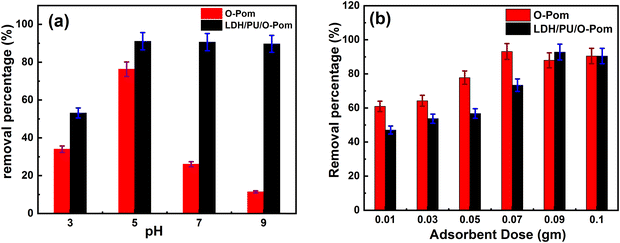
This study was carried out via the batch adsorption technique; stock standard solutions of cefotaxime were prepared for adsorbates at a concentration of 500 μg mL−1, and serial dilutions were prepared for cefotaxime to construct an ideal calibration curve. In this study, we investigated different factors that significantly influence the adsorption process, including the amount of adsorbent beads, pH, concentration of cefotaxime, and contact time between the adsorbent and the pollutant. To study the effect of pH, 0.01 g of prepared adsorbent powder was placed at the same amount in five Falcon tubes (50 mL), and then 50 μg mL−1 adsorbate solution was added followed by the addition of distilled water. The pH of each solution was then adjusted to 3, 5, 7 and 9 using 0.1 N NaOH or 0.1 N HCl. The Falcon tubes were left overnight on an orbital shaker at 200 rpm. The effect of adsorbent amount was subsequently examined by adding different amounts of adsorbent in another five Falcon tubes adjusted to the optimum pH previously identified. The adsorbent at each amount was administered in triplicate, and the average results were recorded for each amount. The investigated amounts were 0.01–0.1 g. The effects of the concentrations of the drug were investigated at concentrations ranging from 5 to 1000 μg mL−1, applying the optimum conditions resulting from the previous steps. The point of zero charge (PZC) of the prepared materials was determined by adding 0.05 g of the synthesized adsorbent to 25 mL of aqueous solution at various pH values (5, 6, 7, 8, 9, and 10). The solutions were allowed to equilibrate for 24 hours to reach the final pH. The difference between the final and initial pH values was plotted against the initial pH. The PZC is the initial pH at which the ΔpH is zero. Cefotaxime was measured via a UV-vis spectrophotometer with λmax = 286 nm.36 Additionally, the adsorption process was elucidated via adsorption isotherm and kinetic investigations. The error function was used to select the appropriate model for adsorption, which was calculated.37In our study, the regeneration of adsorbents was investigated via the use of 20.0 μg mL−1 cefotaxime-loaded adsorbents with different regeneration materials, including ethanol, acetone, and acetic acid. Each material was prepared at a concentration of 50% v/v in a 20 mL solution. Desorption studies were conducted using batch adsorbers operated for 1 h at 200 rpm and 30 °C. Multiple adsorption–desorption cycles were carried out to assess the cefotaxime removal efficiency of the regenerated prepared materials. The performance of the adsorbents was determined using eqn (1):
| Percentage removal (%) = (C0 − Cf/Cf) × 100 | (1) |
2.5. Cytotoxicity assessment
3. Results and discussion
3.1. Characterization of adsorbents
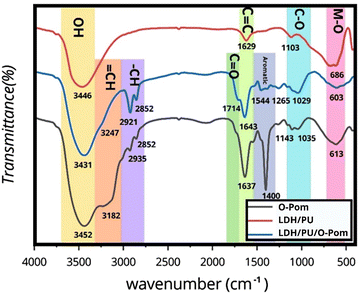
Fig. 1 shows the FTIR spectrum of O-Pom. A broad peak at 3431 cm−1 is observed, indicating the presence of hydroxyl groups. In contrast, the LDH/PU spectrum shows an OH peak at 3247 cm−1, suggesting the presence of OH groups integrated within the LDH structure.38,39 When O-Pom and LDH/PU interact or bind together to form LDH/PU/O-Pom, the change in the environment could result in a shift in the OH peak to a slightly higher wavenumber, as observed at 3452 cm−1 in the LDH/PU/O-Pom spectrum. The change in the OH peak suggests the formation of hydrogen bonds between the hydroxyl groups in O-Pom and those within the LDH structure. The observed shift in the OH peak provides evidence of interaction or binding between O-Pom and LDH in the LDH/PU/O-Pom composite. In the FTIR spectrum of O-Pom, the C![[double bond, length as m-dash]](https://www.rsc.org/images/entities/char_e001.gif) C peak observed at 1643 cm−1 suggests the existence of a conjugated system commonly found in aromatic compounds or unsaturated fatty acids, and the peak observed at 1629 cm−1 is possibly due to the stretching vibration of water molecules or hydroxide ions in the interlayer region of the LDHs.40 When O-Pom and LDH/PU interact or bind together to form LDH/PU/O-Pom, the environment surrounding the C
C peak observed at 1643 cm−1 suggests the existence of a conjugated system commonly found in aromatic compounds or unsaturated fatty acids, and the peak observed at 1629 cm−1 is possibly due to the stretching vibration of water molecules or hydroxide ions in the interlayer region of the LDHs.40 When O-Pom and LDH/PU interact or bind together to form LDH/PU/O-Pom, the environment surrounding the C![[double bond, length as m-dash]](https://www.rsc.org/images/entities/char_e001.gif) C bonds may change. This change in the environment could result in a slight change in the C
C bonds may change. This change in the environment could result in a slight change in the C![[double bond, length as m-dash]](https://www.rsc.org/images/entities/char_e001.gif) C peak, which may be attributed to electronic effects caused by interactions such as π–π interactions between the aromatic compounds present in O-Pom and LDH/PU.24
C peak, which may be attributed to electronic effects caused by interactions such as π–π interactions between the aromatic compounds present in O-Pom and LDH/PU.24
In the FTIR spectrum of O-Pom, a C–O peak is observed at 1029 cm−1, whereas in the LDH/PU spectrum, a C–O peak is detected at 1103 cm−1, possibly due to the presence of metal–oxygen (M–O) bonds within the LDH structure.24 When O-Pom and LDH/PU interact or bind together to form LDH/PU/O-Pom, new peaks at 1143 cm−1 and 1035 cm−1 in the LDH/PU/O-Pom spectrum appear. This shift and appearance of new peaks in the C–O stretching region may also be attributed to the hydroxyl groups present in both O-Pom and LDH/PU, which may participate in hydrogen bonding interactions, leading to shifts in the C–O stretching peaks or electrostatic interactions between O-Pom and LDH/PU.24
The M–O stretching peak is observed at 603 cm−1 for O-Pom, whereas in the LDH/PU spectrum, the M–O stretching peak is observed at 686 cm−1, reflecting the characteristic M–O bonds within the LDH/PU structure. When O-Pom and LDH/PU interact or bind together to form LDH/PU/O-Pom, new chemical bonds may form (Table S2, ESI†).
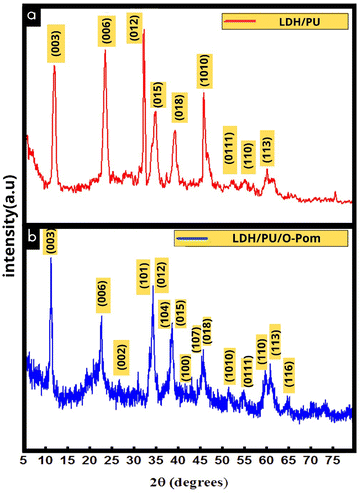
The XRD pattern of Zn Al LDH/PU corresponds to the Zn Al layered double hydroxide (LDH) incorporated into polyurethane, as represented in Fig. 2. The peaks in this pattern represent specific crystallographic planes within the material.24 The strong basal reflection patterns of the samples suggest that they are very crystalline. The generated LDH was in the standard hexagonal phase.5 The observed characteristic peaks at 2θ values of 11.589°, 23.329°, 26.603°, 33.837°, 34.508°, 37.233°, 39.117°, 42.465°, 43.805°, 46.560°, 52.749°, 56.103°, 60.021°, 61.377°, and 65.299° corresponded to crystallographic plane indices (003), (006), (002), (101), (012), (104), (015), (100), (107), (108), (1010), (0111), (110), (113), and (116), respectively, The LDH/PU exhibited distinct diffraction peaks compared with those of pure LDH,41 suggesting that PU was incorporated into the LDH layers through both chemical and physical interactions.
The XRD patterns of the Zn Al LDH/PU/O-Pom powder nanocomposites also provided valuable insights into the crystalline structure of these materials. Both the Zn Al LDH/PU and O-Pom samples exhibited similar peaks with varying intensities, suggesting the presence of LDH, PU, and O-Pom particles in the composite. The observed diffraction pattern was compared to that of LDH/PU, and the detected peaks were attributed to specific plane families. The peaks detected for the composite sample were consistent with the presence of diverse organic compounds within the matrix of the O-Pom powder, further confirming the organic nature of the material. Fig. 2 shows that 2θ values of 26.603° and 42.465° correspond to the (002) and (100) graphite crystal planes, respectively. Another distinctive peak observed at 2θ = 22.782° indicates the amorphous phase of cellulose extracted from O-Pom.42
Additionally, LDH/PU/O-Pom exhibited diffraction peaks identical to those of the LDH/PU composite but with varying intensities, suggesting the incorporation of O-Pom into LDH/PU layers through physical and chemical interactions. The (006) peak intensity of LDH/PU/O-Pom was lower than that of pure LDH/PU, indicating an interaction between O-Pom and LDH/PU. The crystallite diameters of pure LDH/PU and LDH/PU/O-Pom were 18.587 and 16.234 nm, respectively. Furthermore, d-spacing values of the (006) difference peaks were calculated using Bragg's law, resulting in 0.4 nm for O-Pom LDH-PU and 0.38 nm for pure LDH-PU.
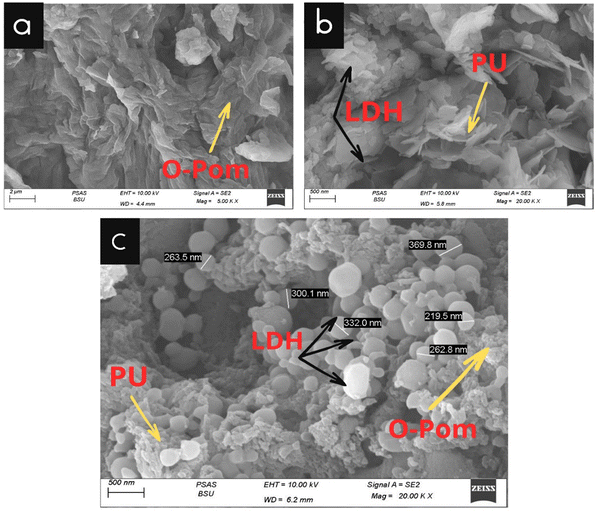
As shown in Fig. 3(a), the SEM image of O-Pom reveals a nonsmooth surface with different morphologies43 and a heterogeneous structure with various surface textures, reflecting components such as layers and flower-like shapes with pore distribution. Additionally, irregular fibrous structures and granular pieces indicate its complex composition. The presence of fibrous networks, irregular cell wall fragments, pits and pores further highlights its intricate plant tissue origin, offering valuable insights for various industrial applications.44
The SEM image of LDH/PU illustrates the complex structure, which appeared as platelets arranged in a way that resembled hexagonal plates. These plates aggregate, forming flower-like structures with high porosity. In the LDH/PU samples, polyurethane foam formed layers with an open-cell structure, connecting individual cells to create a network of voids or holes.24
In the composite sample, we can see a heterogeneous structure due to the different nature of its components. O-Pom particles exhibit irregular shapes and sizes with fibrous structures and rough textures and are embedded within the PU matrix and LDH particles. Typically, they appear as plate-like or sheet-like structures with spherical shapes and are distributed uniformly or as agglomerates, influencing the composite's properties. Effective adhesion between components, reflected by minimal voids and smooth transitions, is crucial for mechanical properties. The surface morphology, which reflects the roughness of the O-Pom and LDH layers, potentially enhances the composite surface area for adsorption. SEM highlights the porosity of the composite, which is vital for tailored mechanical or adsorption capabilities, offering critical insights into its complex interplay for optimizing properties across various applications.
3.2. Adsorption study
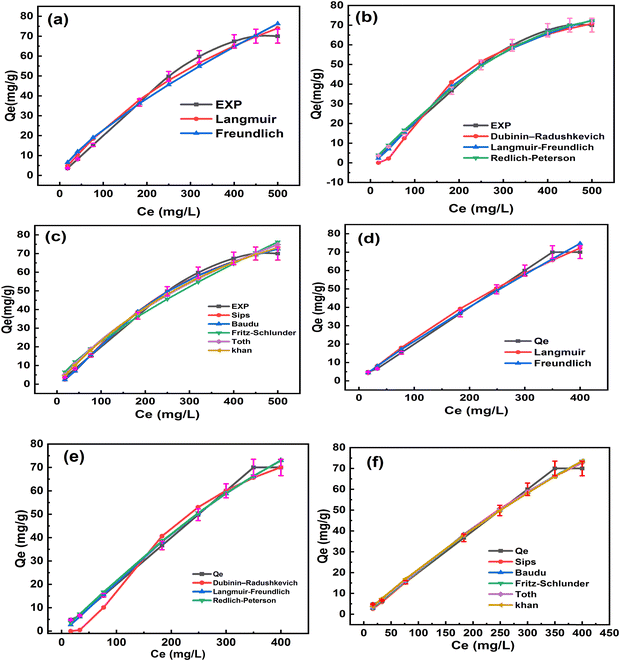 | ||
| Fig. 5 Nonlinearized fitting of different isotherm models for the adsorption of the cefotaxime drug by (a)–(c) O-Pom and (d)–(f) LDH/PU/O-Pom. | ||
The statistical analysis revealed that throughout the concentration range, the two-parameter isotherms, Freundlich and Langmuir, fitted best with the experimental results. This is because the error functions determined via statistical analysis had the lowest values and the highest coefficient of determination (R2), which was nearly equal to one. The universal indicators that provided the best fit to the experimental data were HYBRID and the chi-square test (χ2), which were used to forecast isotherm modeling in sets of eight adsorption systems. The remaining statistical criteria produced a variety of outcomes, and the type of results may have been influenced by the pressure range, model parameters, and number of experimental points. Tables S4 and S5 (ESI†) display the statistical error validity data for the isotherm models. The values of these statistical techniques decrease with model quality and increase the degree of agreement between the computed quantity adsorbed (qe, cal) and the experimental quantity adsorbed (qe, exp). The best model was compared and supported by the coefficient of regression (R2). Higher R2 values, closer qe, exp and qe, cal values, and smaller statistical error values fitted to the Redlich–Peterson isotherm for O-Pom and Toth for LDH/PU/O-Pom, enhancing the isotherm models’ capacity to describe the sorption process.
3.3. Adsorption mechanism
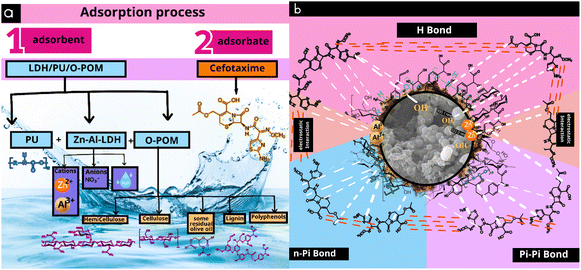
The effective adsorption of cefotaxime onto the Zn Al LDH/PU/O-Pom composite is facilitated by several crucial interactions, such as hydrogen bonding, π–π interactions, n–π interactions, and electrostatic interactions, as evidenced by the changes observed in the FTIR spectra in Fig. 7. LDH consists of a layered structure composed of octahedra centered around Zn and Al ions surrounded by OH– groups, and a PU polymer is integrated between LDH particles.57 O-Pom is rich in compounds such as cellulose, hemicellulose, lignin, and olive residue, which contribute to the adsorption process in several ways, as shown in Fig. 7. Hydrogen bonds play a crucial role in this process, with the composite containing hydroxyl groups (–OH) from both the Zn Al LDH/PU and O-Pom components. These hydroxyl groups have the ability to form hydrogen bonds with the functional groups of cefotaxime, such as its carboxyl (–COOH) and amino (–NH2) groups, thereby enhancing the stability and retention of cefotaxime on the composite surface.58π–π interactions occur between the aromatic rings present in cefotaxime and those in the composite material, particularly from the polyphenolic compounds in O-Pom. These interactions involve the stacking of aromatic rings, thereby increasing the adsorption capacity of the composite by offering additional binding sites for cefotaxime. Additionally, n–π interactions involve interactions between the lone pairs of electrons on heteroatoms (such as oxygen and nitrogen) in cefotaxime and the π-electrons of aromatic systems in the composite.24 O-Pom contains compounds such as cellulose, hemicellulose, and lignin, which have oxygen atoms with lone pairs that can participate in n–π interactions with the π-electrons of the aromatic rings of cefotaxime. Electrostatic interactions arise from the charged nature of both the composite and cefotaxime. Zn Al LDH provides positively charged sites (Zn2+ and Al3+), which can attract the negatively charged groups in cefotaxime, such as carboxylate anions (–COO−). These interactions further increase the adsorption efficiency by creating strong ionic attractions between the adsorbent and the adsorbate.24
The FTIR spectra revealed changes in peaks associated with charged groups, such as a change in the peak at 1562 cm−1 to 1490 cm−1 (Fig. 8), reflecting strong ionic attractions between the positively charged sites (Zn2+ and Al3+) in Zn–Al-LDH and the negatively charged groups in cefotaxime (such as carboxylate anions). Lignin present in O-Pom, with its aromatic structure, contributes to π–π interactions with cefotaxime, while its functional groups can also participate in hydrogen bonding and other interactions. The residual organic compounds in olive pomace contribute to the composite's adsorption ability by providing additional functional groups and aromatic sites for interaction with cefotaxime.
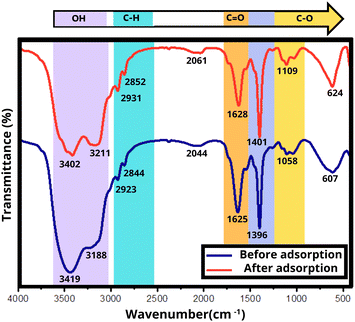 | ||
| Fig. 8 FT-IR spectra of Zn Al LDH/PU/O-Pom and cefotaxime (a) before adsorption and (b) after adsorption. | ||
Additionally, from the isotherm investigation, it was found that the mechanism involved chemical interaction according to the fitting parameters, such as the AIC values, which were low in the case of two prepared materials.
In conclusion, the adsorption process of cefotaxime onto the Zn Al LDH/PU and O-Pom composites is facilitated by multiple interactions, including hydrogen bonding, π–π interactions, n–π interactions, and electrostatic interactions, as confirmed by the significant shifts and changes in the FTIR spectra. The presence of cellulose, hemicellulose, lignin, and olive residue in olive pomace enhances these interactions, leading to a successful adsorption process. These combined effects indicate the composite's effectiveness in removing cefotaxime from aqueous solutions.
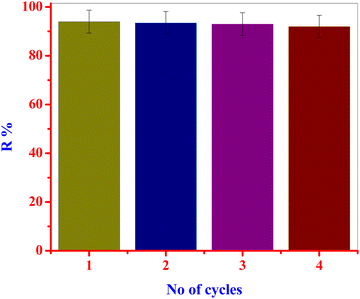
After four cycles of adsorption, desorption, and regeneration with ethanol, the LDH/PU/O-Pom material exhibited good adsorption efficiency, retaining more than 92% of its initial adsorption capacity. Ethanol aids in the effective desorption of cefotaxime by breaking bonds between molecules and the composite surface. Ethanol is used for the regeneration of our composite, demonstrating its chemical stability, preserving its functional properties and adsorption capacity over multiple cycles59 and lowering operational costs and environmental impacts of cefotaxime removal processes. Owing to its economic feasibility, ethanol, a cost-effective and widely available chemical, is a viable option for regenerating LDH/PU/O-Pom in large-scale or long-term applications. Ethanol consistently retained high removal rates of approximately 94% up to the fourth cycle, which slightly decreased to 92% by the 4th cycle. Successful regeneration of the adsorbent can extend its lifespan, restore its adsorption capacity, and result in cost savings (Fig. 9).
3.4. In vitro cytotoxicity of Zn Al LDH-PU, O-Pom and Zn Al LDH/PU/O-Pom against the Vero cell line
As illustrated in Fig. 10, the MTT assay was utilized to evaluate the potential cytotoxicity of LDH/PU, O-Pom and LDH/PU/O-Pom towards the Vero cell line. The cells were exposed to different concentrations of these compounds and incubated for 24 h. The control cells were treated with only the diluent. The results indicate that at the highest tested concentration of 1000 μg mL−1, the cell viability was 66.7 ± 1.1%, 61 ± 1%, and 61.8 ± 1.3%, respectively. The low cytotoxicity observed in Vero cells suggests that LDH/PU/O-Pom can be used in water treatment without posing significant risks to human health. This is particularly important, as water treatment materials must be nontoxic to ensure the safety of treated water for human consumption and environmental discharge.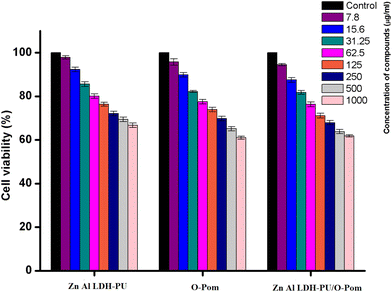 | ||
| Fig. 10 Cell viability (%) of different concentrations of Zn, Al LDH/PU, O-Pom and LDH/PU/O-Pom after 24 h (n = 3) ± SD. | ||
3.5. Antimicrobial study
The antimicrobial properties of LDH/PU, O-Pom and LDH/PU/O-Pom were evaluated via the agar dilution method. This assessment was conducted against four bacterial strains, Staphylococcus aureus (S. aureus), Bacillus cereus (B. cereus), Pseudomonas aeruginosa (P. aeruginosa) and Escherichia coli (E. coli), which served as test pathogens. As shown in Fig. 11, the synthesized LDH/PU/O-Pom demonstrated the highest antibacterial activity against the tested microorganisms, with the effectiveness increasing in proportion to the concentration used. The LDH/PU/O-Pom sample showed antimicrobial activity against both Gram-positive and Gram-negative bacteria. Among the tested bacteria, the Gram-negative species E. coli (MIC, 60 μg mL−1) presented the highest sensitivity to LDH/PU/O-Pom, followed by P. aeruginosa (MIC, 80 μg mL−1), which is also a Gram-negative bacterium. In contrast, the Gram-positive bacterium B. cereus (MIC, 250 μg mL−1) was least susceptible to the antibacterial effects of LDH/PU/O-Pom.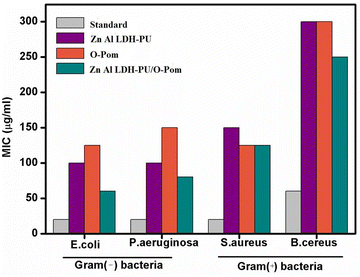 | ||
| Fig. 11 Antimicrobial activity (MIC, μg mL−1) of Zn Al LDH/PU, O-Pom and Zn Al LDH/PU/O-Pom against Gram (+) and Gram (−) bacteria. | ||
The varying antibacterial effectiveness observed between Gram-negative and Gram-positive bacteria can likely be attributed to the distinct structural and chemical compositions of their cell surfaces. Gram-negative bacteria possess a unique outer membrane that envelops their peptidoglycan layer, which is absent in Gram-positive bacteria. This outer membrane in Gram-negative bacteria appears to be particularly susceptible to damage when exposed to LDH/PU/O-Pom.60,61
The bactericidal effect of LDH/PU/O-Pom on bacterial cells can be attributed to multiple antibacterial mechanisms. The antimicrobial activity of LDH/PU/O-Pom is due primarily to specific interactions between the microorganism and the LDH/PU/O-Pom surface. The polar nature and high surface area of LDH/PU/O-Pom facilitate electrostatic interactions between the positively charged LDH surface and the negatively charged bacterial cells. This interaction reduces the charge density on the bacterial surface, leading to decreased cell viability. Additionally, the bactericidal activity of LDH/PU/O-Pom is linked to the formation of basic OH− species within the LDH layers. The generation of reactive oxygen species (ROS) from LDH further enhances its antimicrobial properties.
3.6. Greenness profile determination for the proposed method
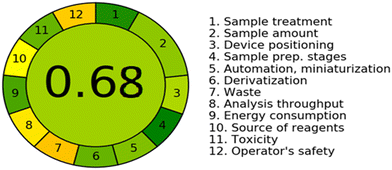
Greenness profile determination is very important for analytical chemists to consider safety, health, and environmental issues. Green profile calculations have become important worldwide. It is important to exclude or reduce hazardous, corrosive, toxic, bioaccumulative solvents, wastes and other substances while doing work. Many methods are used here to evaluate the greenness of our proposed method. The eco-scale (AES) method, GREENness calculator (AGREE) method, and volume intensity (AMVI) method were used for the assessment. Many parameters must be considered when determining how environmentally friendly an analytical methodology is, which include the quantity and toxicity of used chemicals, used power, produced waste, steps in processes, miniaturization, and automation.The analytical GREENness (AGREE) calculator, analytical eco-scale (AES), and analytical method volume intensity (AMVI) methods are selected for this study.
| Parameters | Factors | AES | PP |
|---|---|---|---|
| AES: analytical eco-scale; PP: penalty point | |||
| Toxicity | Ethanol and reagents | 25 | −12 |
| Power | FTIR ≤1.5 kWh−1 | 25 | 0 |
| Waste | Mass (g) and volume (mL) | 25 | −10 |
| Safety | Persons and instruments | 25 | −10 |
| Total points | 100 | −32 | |
| Eco-scale score | 68 | ||
| Parameters | Value |
|---|---|
| Method (volume in mL) | 30.00 |
| Volume solvent consumption method (mL) | 10 |
| No. of analyses | 3 |
| No. of analytes | 1 |
| Sample preparation (volume in mL) | 60.00 |
| Standard prep. volume (mL) | 10 |
| No. of preps. | 3 |
| Solvent sample prep. (mL) | 10 |
| Sample prep. | 3 |
| Method solvent consumption (mL) | 90.00 |
| Method volume intensity | 90.00/1 = 90.00% |
| Consumption method % | 33.70% |
| Consumption preparation % | 67.5% |
3.7. Cost estimation of the adsorption process
An essential factor of an adsorbent's actual field application in wastewater treatment is its preparation cost. The cost of energy and chemicals is part of the total cost of preparing an adsorbent. Table 3 shows the total cost associated with the preparation of LDH/PU/O-Pom. The production of 1.0 g of the LDH/PU/O-Pom adsorbent costs 0.927 USD in total. As indicated in Table 4, the cost analysis conducted for this study revealed that LDH/PU/O-Pom was very cost-effective compared with other water treatment adsorbents published elsewhere.| Material | Purchased quantity (g) | Total purchase cost (USD) | Purchasing cost (USD per g) | Used quantity (g or mL) | Cost of used quantity (USD) |
|---|---|---|---|---|---|
| ZnCl3 | 100 | 25.20 | 0.252 | 54.52 | 13.739 |
| AlCl3 | 500 | 380 | 0.76 | 13.33 | 10.13 |
| NaOH | 25 | 21.90 | 0.876 | 8 | 7.008 |
| Equipment | Time (h) | Max. power (kW) | Unit cost of power | Cost | |
| Drying | 24 | 1 | 0.24 | 5.76 | |
| Stirrer | 2 | 1 | 0.24 | 0.48 | |
| Total yield cost = 37.117 USD for 40 g | Total yield cost = 0.927 USD per g |
| Material used | Cost (USD per g) | Reference | |
|---|---|---|---|
| Zn–Fe LDH/PANI | 12.48 | USD per g | 64 |
| Zn–Fe LDH | 3.12 | USD per g | 64 |
| Activated carbon | 0.9 | USD per kg | 65 |
| Magnesium ferrite nanoparticles | 50.88 | USD per kg | 66 |
| Cellulose-based Co–Fe LDH | 2.55 | USD per g | 67 |
| ZnO/PPy composite | 115.347 | USD per kg | 68 |
| LDH/PU/O-Pom | 0.927 | USD per g | This work |
4. Conclusions
This work focused on the synthesis of a novel composite. Wastewater effluents contaminated with antibiotics and other medications pose a serious risk, necessitating the development of novel adsorbents with high adsorption capabilities and that are also easily and affordably synthesized. In this work, we focused on the synthesis of a novel O-Pom and Zn–Al LDH/PU composite. Cefotaxime was efficiently removed using the prepared nanomaterial; hence, the Zn–Al LDH/PU/O-Pom composite could be applied as a low-cost adsorbent for cefotaxime removal. The results show that the average value of the maximum adsorption capacity is (qmax) 163.23 mg g−1 for O-Pom and 250 mg g−1 for Zn–Al LDH/PU/O-Pom. The experimental adsorption data were best fitted with Langmuir, Langmuir–Freundlich, Sips, Redlich–Peterson, and Baudu isotherm models. The model that best fitted according to the AIC calculated for O-Pom was the Freundlich model, and the AIC values were 69.23 and 63.91 for O-Pom and LDH/PU/O-Pom, respectively. The pseudo-first-order and Avrami kinetic models best fit the experimental kinetic data. Consequently, more research efforts can lead to the development of an effective adsorbent for a variety of organic and inorganic applications. These findings suggest that Zn, Al LDH, PU, and O-Pom could be valuable components of water treatment systems, potentially contributing to reducing microbial contamination, improving overall water quality, and being suitable for water treatment applications without posing significant risks to human health. This is a critical consideration, as water treatment materials must be nontoxic to ensure the safety of treated water for both human consumption and environmental discharge. According to cost analysis, the use of 1 g of Zn Al LDH-PU/O-Pom for cefotaxime removal costs USD 0.927, which is relatively cheap compared with other water treatment methods. Based on our proposed method's total score, it can be considered an excellent greener approach.Ethics approval and consent to participate
The ethics statement is not applicable, as this article does not include any studies on human participants or animals conducted by any of the authors.Consent for publication
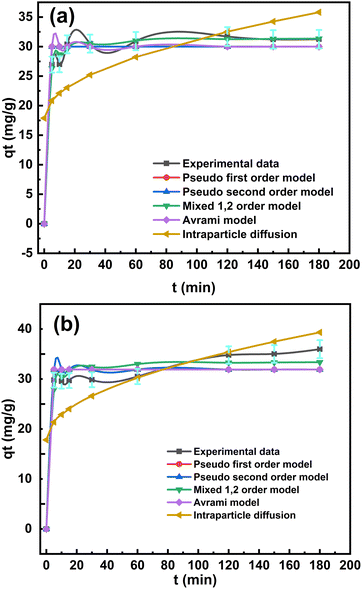
The authors confirm that the work described has not been published before, that it is not under consideration for publication elsewhere, and that its publication has been approved by all co-authors.Abbreviations
| O-Pom | Olive pomace |
| LDH | Layered double hydroxide |
| PU | Polyurethane |
| XRD | X-ray diffraction |
| FTIR | Fourier transform infrared spectroscopy |
| SEM | Scanning electron microscopy analysis |
| BET | Brunauer–Emmett–Teller |
| EDX | Energy dispersive spectroscopy |
| PZC | Point of zero charge |
| pH | Potential of hydrogen |
| UV-vis | Ultraviolet visible |
| VACSERA | Holding company for biological products and vaccines |
| FBS | Fetal bovine serum |
| MTT | 3-(4,5-Dimethylthiazol-2-yl)-2,5-diphenyl-2H-tetrazolium bromide |
| MIC | Minimum inhibitory concentration |
| M–O | Metal–oxygen |
| pKa | Acid dissociation constant |
| AES | The eco-scale score |
| PPs | Penalty points |
| AMVI | The volume intensity method |
| q max | The maximum adsorption capacity |
Data availability
The datasets used and/or analysed during the current study are available from the corresponding author upon reasonable request.Conflicts of interest
The authors declare no competing interests.Acknowledgements
The authors acknowledge the Princess Nourah bint Abdulrahman University Researchers Supporting Project number (PNURSP2024R5), Princess Nourah bint Abdulrahman University, Riyadh, Saudi Arabia. In addition, this study/publication (Project ID: Tailored Enzymatic and Nano-Based Treatment of Wastewater to Detoxify Heavy Metals and Degrade Antibiotics) is made possible by the generous support of the American people through the United States Agency for International Development (USAID). The contents are the responsibility of Prof. Hamdaa Mahmoud and do not necessarily reflect the views of USAID or the United States Government.References
- B. K. Mishra, P. Kumar, C. Saraswat, S. Chakraborty and A. Gautam, Water, 2021, 13, 490–2021, DOI:10.3390/W13040490.
- L. Lin, H. Yang and X. Xu, Front. Environ. Sci., 2022, 10, 880246, DOI:10.3389/FENVS.2022.880246/BIBTEX.
- M. Malakootian, M. Yaseri and M. Faraji, Environ. Sci. Pollut. Res., 2019, 26, 8444–8458, DOI:10.1007/s11356-019-04227-w.
- A. C. Duarte, S. Rodrigues, A. Afonso, A. Nogueira and P. Coutinho, Pharmaceuticals, 2022, 15, 393, DOI:10.3390/ph15040393.
- S. Singh, V. Kumar, A. G. Anil, D. Kapoor, S. Khasnabis, S. Shekar, N. Pavithra, J. Samuel, S. Subramanian, J. Singh and P. C. Ramamurthy, J. Environ. Manage., 2021, 300, 113569, DOI:10.1016/j.jenvman.2021.113569.
- Z. Rouhbakhsh, A. Verdian and G. Rajabzadeh, Talanta, 2020, 206, 120246, DOI:10.1016/j.talanta.2019.120246.
- A. M. Voigt, N. Zacharias, C. Timm, F. Wasser, E. Sib, D. Skutlarek, M. Parcina, R. M. Schmithausen, T. Schwartz, N. Hembach, A. Tiehm, C. Stange, S. Engelhart, G. Bierbaum, T. Kistemann, M. Exner, H. A. Faerber and C. Schreiber, Chemosphere, 2020, 241, 125032, DOI:10.1016/j.chemosphere.2019.125032.
- Z. Nikfarjam, M. M. Heravi and M. R. Bozorgmehr, PREPRINT (Version 1) available at Research, Square, 2022 DOI:10.21203/rs.3.rs-1494699/v1.
- T. A. Ternes, Water Res., 1998, 32, 3245–3260, DOI:10.1016/S0043-1354(98)00099-2.
- N. Hembach, J. Alexander, C. Hiller, A. Wieland and T. Schwartz, Sci. Rep., 2019, 9, 1–12, DOI:10.1038/s41598-019-49263-1.
- A. Kheradmand, M. Negarestani, S. Kazemi, H. Shayesteh, S. Javanshir and H. Ghiasinejad, Sci. Rep., 2022, 12, 1–17, DOI:10.1038/s41598-022-19056-0.
- M. N. Sepehr, T. J. Al-Musawi, E. Ghahramani, H. Kazemian and M. Zarrabi, Arabian J. Chem., 2017, 10, 611–623, DOI:10.1016/j.arabjc.2016.07.003.
- P. Santhosh and C. Dhandapani, Nat., Environ. Pollut. Technol., 2013, 12, 563–568 CAS.
- M. Sharma, J. Singh, S. Hazra and S. Basu, Microchem. J., 2019, 145, 105–112, DOI:10.1016/j.microc.2018.10.026.
- Ministry of Agriculture and Land Reclamation, Agricultural Economics Bulletin. Economic Affairs Sector, Cairo, Egypt, 2022.
- D. E. El-Agha, D. J. Molden and A. M. Ghanem, Irrigation and Drainage Systems, 2011, 25, 215–236, DOI:10.1007/s10795-011-9116-z.
- M. E. I. Elsorady, A. Y. Girgis and D. M. M. Mostfa, J. Agric. Res., 2015, 93(4(C)), 939–959 Search PubMed.
- A. S. El-Hassanin, M. R. Samak, A. T. A. Moustafa, A. S. Hamza and M. I. Kamel, Afr. J. Biol. Sci., 2024, 4687–4711 Search PubMed.
- E. E. Omran, I. M. Gaber and T. M. Elkashef, Climate Considerations in the Planning and Sustainability of Egyptian Cities, 2022, pp. 207–238 DOI:10.1007/978-3-031-10676-7_13.
- W. Mahyoob, Z. Alakayleh, H. A. Abu Hajar, L. Al-Mawla, A. M. Altwaiq, M. Al-Remawi and F. Al-Akayleh, J. Contam. Hydrol., 2022, 248, 104025, DOI:10.1016/j.jconhyd.2022.104025.
- S. M. Alardhi, H. G. Salih, N. S. Ali, A. H. Khalbas, I. K. Salih, N. M. C. Saady, S. Zendehboudi, T. M. Albayati and H. N. Harharah, Sci. Rep., 2023, 13, 1–14, DOI:10.1038/s41598-023-47319-x.
- P. Zhang, Q. Jiang and J. Li, Mater. Sci. Eng., B, 2020, 259, 114609, DOI:10.1016/j.mseb.2020.114609.
- M. Zheng, J. Chen, L. Zhang, Y. Cheng, C. Lu, Y. Liu, A. Singh, M. Trivedi, A. Kumar and J. Liu, Mater. Today Commun., 2022, 31, 103514, DOI:10.1016/j.mtcomm.2022.103514.
- H. K. Mohamed, A. A. Kotp, A. M. Salah, Z. E. Eldin, D. Essam, W. kamal, Y. GadelHak, A. E. Allah, S. Saeed, S. I. Othman, A. Allam, H. A. Rudayni and R. Mahmoud, Chin. J. Anal. Chem., 2024, 52, 100385, DOI:10.1016/j.cjac.2024.100385.
- S. Kainth, P. Sharma and O. P. Pandey, Appl. Surf. Sci. Adv., 2024, 19, 100562, DOI:10.1016/j.apsadv.2023.100562.
- F. Mohamed Abdoul-Latif, A. Ainane, T. Hachi, R. Abbi, M. Achira, A. Abourriche, M. Brulé and T. Ainane, Molecules, 2023, 28, 4310, DOI:10.3390/molecules28114310.
- K. Metyouy, L. Benkirane, M. E. Sánchez, J. Cara-Jiménez, K. V. Plakas and T. Chafik, Sustain. Chem. Environ., 2024, 6, 100110, DOI:10.1016/j.scenv.2024.100110.
- J. Saleem, U. Bin Shahid, M. Hijab, H. Mackey and G. McKay, Biomass Convers. Biorefin., 2019, 9, 775–802, DOI:10.1007/s13399-019-00473-7.
- A. Ali Khan, M. Tahir and N. Khan, J. Energy Chem., 2023, 84, 242–276, DOI:10.1016/j.jechem.2023.04.049.
- J. Zhao, Z. Xu, Z. Zhou, S. Xi, Y. Xia, Q. Zhang, L. Huang, L. Mei, Y. Jiang, J. Gao, Z. Zeng and C. Tan, ACS Nano, 2021, 15, 10597–10608, DOI:10.1021/acsnano.1c03341.
- Z. Zhou, T. Wang, T. Hu, H. Xu, L. Cui, B. Xue, X. Zhao, X. Pan, S. Yu, H. Li, Y. Qin, J. Zhang, L. Ma, R. Liang and C. Tan, Adv. Mater., 2024, 36, 2311002, DOI:10.1002/adma.202311002.
- G. E. de Souza dos Santos, A. H. Ide, J. L. S. Duarte, G. McKay, A. O. S. Silva and L. Meili, Powder Technol., 2020, 364, 229–240, DOI:10.1016/j.powtec.2020.01.083.
- N. Babakhouya, M. Abdouni, K. Louhab and A. History, Alger. J. Environ. Sci. Technol., 2018, 4(2) DOI:10.4172/2161-0525.S7-008.
- I. Hegazy, M. E. A. Ali, E. H. Zaghlool and R. Elsheikh, Appl. Water Sci., 2021, 11, 1–14, DOI:10.1007/s13201-021-01421-5.
- V. Rizzi, D. Lacalamita, J. Gubitosa, P. Fini, A. Petrella, R. Romita, A. Agostiano, J. A. Gabaldón, M. I. Fortea Gorbe, T. Gómez-Morte and P. Cosma, Sci. Total Environ., 2019, 693, 133620, DOI:10.1016/j.scitotenv.2019.133620.
- A. Sheikhmohammadi, H. Alamgholiloo, M. Golaki, P. Khakzad, E. Asgari and F. Rahimlu, Sci. Rep., 2024, 14, 1–17, DOI:10.1038/s41598-024-64790-2.
- J. Serafin and B. Dziejarski, Microporous Mesoporous Mater., 2023, 354, 112513, DOI:10.1016/j.micromeso.2023.112513.
- A. Christofi, P. Fella, A. Agapiou, E. M. Barampouti, S. Mai, K. Moustakas and M. Loizidou, Sustainability, 2024, 16, 1116, DOI:10.3390/su16031116.
- A. K. A. Khalil, F. Dweiri, I. W. Almanassra, A. Chatla and M. A. Atieh, Sustainability, 2022, 14, 6991, DOI:10.3390/su14126991.
- G. Y. Abo El-Reesh, A. A. Farghali, M. Taha and R. K. Mahmoud, Sci. Rep., 2020, 10, 1–20, DOI:10.1038/s41598-020-57519-4.
- Z. Zhang, Z. Hua, J. Lang, Y. Song, Q. Zhang, Q. Han, H. Fan, M. Gao, X. Li and J. Yang, CrystEngComm, 2019, 21, 4607–4619 RSC.
- P. E. Tsakiridis, M. Samouhos and M. Perraki, Constr. Build. Mater., 2017, 153, 202–210, DOI:10.1016/j.conbuildmat.2017.07.102.
- D. Djefel, S. Makhlouf, S. Khedache, G. Lefebvre and L. Royon, Int. J. Hydrogen Energy, 2015, 40, 13764–13770, DOI:10.1016/j.ijhydene.2015.05.078.
- Y. Hammoui, S. Molina-Boisseau, A. Duval, N. Djerrada, N. Adjeroud, H. Remini, F. Dahmoune and K. Madani, Mater. Des., 2015, 87, 742–749, DOI:10.1016/j.matdes.2015.08.080.
- Z. Li, Y. Liu, S. Zou, C. Lu, H. Bai, H. Mu and J. Duan, Chem. Eng. J., 2020, 382, 123008, DOI:10.1016/j.cej.2019.123008.
- O. Gulnaz, A. Sahmurova and S. Kama, Chem. Eng. J., 2011, 174, 579–585, DOI:10.1016/j.cej.2011.09.061.
- X. Yu, R. Yu, B. Xue, J. Liao, W. Zhu and S. Tian, Desalin. Water Treat., 2020, 202, 219–231, DOI:10.5004/dwt.2020.26176.
- N. Ayawei, A. N. Ebelegi and D. Wankasi, J. Chem., 2017, 2017, 3039817, DOI:10.1155/2017/3039817.
- Y. Ma and A. Jamili, J Unconvent. Oil Gas Resour., 2016, 14, 128–138, DOI:10.1016/j.juogr.2016.03.003.
- M. S. Podder and C. B. Majumder, Compos. Interfaces, 2016, 23, 327–372, DOI:10.1080/09276440.2016.1137715.
- A. Syafiuddin, S. Salmiati, J. Jonbi and M. A. Fulazzaky, J. Environ. Manage., 2018, 218, 59–70, DOI:10.1016/j.jenvman.2018.03.066.
- R. Ramadoss and D. Subramaniam, Sep. Sci. Technol., 2019, 54, 943–961, DOI:10.1080/01496395.2018.1526194.
- W. Fritz and E. U. Schluender, Chem. Eng. Sci., 1974, 29, 1279–1282, DOI:10.1016/0009-2509(74)80128-4.
- T. Sato, S. Abe, S. Ito and T. Abe, J. Environ. Chem. Eng., 2019, 7, 102958, DOI:10.1016/j.jece.2019.102958.
- W. Kamal, R. Mahmoud, A. E. Allah, A. Abdelwahab, M. Taha and A. A. Farghali, Chem. Eng. Res. Des., 2022, 188, 249–264, DOI:10.1016/j.cherd.2022.09.041.
- M. H. Sorour, H. A. Hani, H. F. Shaalan, M. M. ElSayed and M. A. El-Toukhy, Int. J. Appl. Sci. Eng., 2021, 18, 1–12, DOI:10.6703/IJASE.202109_18(5).009.
- A. A. Maamoun, A. A. El-Wakil and T. M. El-Basheer, J. Cell. Plast., 2022, 58, 645–672, DOI:10.1177/0021955X221088392.
- H. Rashidi Nodeh and H. Sereshti, RSC Adv., 2016, 6, 89953–89965, 10.1039/C6RA18341G.
- N. Ayawei, A. N. Ebelegi and D. Wankasi, J. Chem., 2017, 2017, 3039817, DOI:10.1155/2017/3039817.
- Z. Breijyeh, B. Jubeh and R. Karaman, Molecules, 2020, 25, 1340, DOI:10.3390/MOLECULES25061340.
- W. Pajerski, D. Ochonska, M. Brzychczy-Wloch, P. Indyka, M. Jarosz, M. Golda-Cepa, Z. Sojka and A. Kotarba, J. Nanopart. Res., 2019, 21, 1–12, DOI:10.1007/S11051-019-4617-Z/FIGURES/8.
- A. A. Ahmed-Anwar, M. A. Mohamed, A. A. Farghali, R. Mahmoud and M. E. M. Hassouna, Sci. Rep., 2023, 13, 1–11, DOI:10.1038/s41598-023-44846-5.
- F. Pena-Pereira, W. Wojnowski and M. Tobiszewski, Anal. Chem., 2020, 92, 10076–10082, DOI:10.1021/acs.analchem.0c01887.
- M. Kamel, G. A. El-Fatah, A. Zaher, A. A. Farghali, S. I. Othman, A. A. Allam, H. A. Rudayni, A. M. Salah, M. E. M. Hassouna and R. Mahmoud, Chin. J. Anal. Chem., 2024, 52, 100368, DOI:10.1016/J.CJAC.2024.100368.
- A. Syafiuddin, S. Salmiati, T. Hadibarata, M. R. Salim, A. B. H. Kueh and S. Suhartono, Water, Air, Soil Pollut., 2019, 230, 102, DOI:10.1007/s11270-019-4143-8.
- P. Das, P. Debnath and A. Debnath, Environ. Nanotechnol., Monit. Manage., 2021, 16, 100506, DOI:10.1016/j.enmm.2021.100506.
- A. A. Kotp, A. A. Allam, A. M. Salah, W. Kamal, D. Essam, S. M. Mahgoub, M. A. Mohamed, Z. E. Eldin, H. E. Alfassam, H. A. Rudayni, A. S. Alawam, F. A. Nasr and R. Mahmoud, J. Contam. Hydrol., 2024, 264, 104364, DOI:10.1016/j.jconhyd.2024.104364.
- B. Saha, S. Gayen and A. Debnath, J. Hazard., Toxic Radioact. Waste, 2023, 27(3) DOI:10.1061/JHTRBP.HZENG-1213.
Footnote |
| † Electronic supplementary information (ESI) available. See DOI: https://doi.org/10.1039/d4ma00910j |
| This journal is © The Royal Society of Chemistry 2024 |

