 Open Access Article
Creative Commons Attribution 3.0 Unported Licence
Light-induced spiking response in proteinoid–actin–kombucha system
Panagiotis
Mougkogiannis
 *a,
Anna
Nikolaidou
 ab and
Andrew
Adamatzky
a
aUnconventional Computing Laboratory, University of the West of England, Bristol, UK. E-mail: Panagiotis.Mougkogiannis@uwe.ac.uk
bSchool of Architecture and Environment, University of the West of England, Bristol, UK
First published on 28th October 2024
Abstract
This study examines the spiking response of a proteinoid–actin–kombucha system when exposed to varying frequency of yellow light pulses. The objective is to understand the frequency-dependent characteristics of this system's response and explore the possibility of using light pulses to regulate and manipulate how it functions. The kombucha samples, which contained proteinoid–actin complexes, were exposed to several stimulation conditions. These settings included no light (blank) and yellow light pulses at frequencies of 2 Hz, 4 Hz, 10 Hz, 20 Hz, and 100 Hz. The spiking response was analyzed in terms of potential (mV) over time (s), and the characteristics of the response, such as amplitude and period, were examined. The findings indicate that the spiking patterns and characteristics fluctuate according on the stimulation frequency, with higher frequencies generally leading to more distinct and numerous spikes compared to lower frequencies and the absence of stimulation. The skewness and kurtosis values of the potential data indicate different levels of asymmetry and tail tendency in the probability distributions, which further supports the fact that the response is based on frequency. The study emphasises the capacity to manipulate and regulate the functions of the proteinoid–actin–kombucha system using light pulses, hence creating opportunities for future usage in several domains, including biosensors and biocomputing.
Introduction
Kombucha is a beverage with moderate sweetness and acidity that is produced by fermenting black or green tea (Camellia sinensis) and sugar using a symbiotic culture of bacteria and yeast (SCOBY). The SCOBY is composed of a cellulose biofilm that contains acetic acid bacteria, lactic acid bacteria, and osmophilic yeasts.1 Throughout the fermentation process, the SCOBY undergoes metabolic reactions that break down the tea polyphenols and sugar, resulting in the formation of several substances such as organic acids (acetic, gluconic, glucuronic, lactic), vitamins (B and C), minerals, and ethanol.2 The specific chemical composition varies depending on the type of tea and sugar used, the bacteria strains present in the SCOBY, and the duration and temperature of fermentation.3 Nevertheless, acetic acid is commonly one of the primary organic acids generated. The health benefits of kombucha are believed to be related to the bioactive components produced during fermentation, specifically the organic acids and polyphenols.4–6Kombucha–proteinoid biofilms has distinctive characteristics such as electroactivity, adaptive conductivity, and the capacity to produce electrical spikes, make them highly suitable for a range of bioelectronic and biosensing applications.7,8 The kombucha matrix's porous and hydrogel-like structure is well-suited for immobilising biomolecules and allowing charge transfer. Proteinoids embedded in this structure can function as molecular recognition components, facilitating the specific identification of target substances.9 The biofilms' memristive behaviour has the potential to be used in unconventional computer systems for information processing and storage. Moreover, the compatibility with living organisms and the flexibility of kombucha-based materials derived from kombucha indicate promising uses as conformal coatings for electrodes that may be implanted in the body. This would enable smooth integration with biological tissues, facilitating the recording and stimulation of neural activity.10 The current study aims to uncover the complex interactions inside these hybrid living materials, ultimately unlocking their whole capabilities in domains like as wearable sensors, soft robotics, and brain–machine interfaces.11–15
Gaining insight into how biological materials, such as kombucha–proteinoid biofilms, react to external stimuli is essential for fully using their potential in bioelectronic and biosensing applications.10 Through the examination of the response of these materials to different stimuli such as light, electrical signals, or chemical agents, researchers can get vital knowledge about the fundamental mechanisms that control their distinct characteristics.16 Understanding the mechanism is crucial in developing customised stimulation protocols that can control the conductivity of the biofilm, adjust its spiking patterns, or initiate certain metabolic responses. Studying the frequency-dependent electrical behaviour of kombucha–proteinoid composites can provide insights into the best conditions for improving charge transfer or producing certain memristive states. By understanding the impact of light exposure on the photosynthetic activity of Chlorella in the biofilm, it becomes possible to develop self-powered biosensors that are responsive to light.17 Through the analysis of the complex connection between external stimuli and the biological elements of these substances, scientists can discover novel opportunities for developing bio-electronic systems that are adaptable, reactive, and intelligent.18 These systems have the capability to detect, analyse, and react to their surroundings in real-time. Having this basic understanding will facilitate the rational design and optimisation of electronic devices utilising kombucha, ultimately advancing us towards the achievement of fully bioinspired technologies.19
Light-induced behavioural responses are not exclusive to bacterial systems, but are also reported in diverse eukaryotic organisms.20 Photoreceptors, such as phytochromes, cryptochromes, and phototropins, are essential in plants for controlling growth, development, and movement in response to light.21 Phototropism, which refers to the directional growth of plants towards a light source, is regulated by phototropins. These photoreceptor proteins are responsible for detecting blue light and triggering asymmetric growth.22 Opsins, which are light-sensitive proteins found in the retina of animals, play a crucial role in enabling vision and phototaxis.23 Circadian rhythms, which are intrinsic biological clocks that regulate many physiological processes, are synchronised by light–dark cycles through the influence of photoreceptors.24 Research on light-induced behavioural responses in various animals has identified shared patterns in the molecular processes of light detection and transmission of signals.25 Photoreceptor proteins frequently experience conformational alterations when they absorb light, which then initiate signalling pathways that eventually impact cellular functions and behaviour.26 Gaining understanding of these light-mediated reactions not only offers understanding into the fundamental principles of sensory biology but also has practical implications in fields such as optogenetics, where light-responsive proteins are employed to regulate neuronal activity and manipulate behaviour in model organisms.27 As research progresses in understanding the complex nature of light-induced behavioural reactions, it presents interesting opportunities for harnessing these mechanisms in the fields of biotechnology, synthetic biology, and bioelectronics.28,29
Light-responsive biological materials have been widely used in several areas, including biosensors, bioelectronics, optogenetics, and synthetic biology.30 An example involves the use of photosynthetic proteins, such as reaction centres and light-harvesting complexes, for the advancement of bio-inspired solar cells and photovoltaic systems. These proteins can be incorporated into synthetic systems that capture and convert light energy into electrical impulses, providing a sustainable and efficient method for energy generation.31 Another example involves the use of light-sensitive ion channels, such as channelrhodopsins, in the field of optogenetics. Through the genetic expression of these proteins in certain neurons, scientists can accurately regulate the activity of neurons using light. This allows for the study of brain circuits and the regulation of behaviour in model organisms.32 This technology has completely transformed the field of neuroscience research and holds great promise for treating neurological disorders.33 Moreover, photoactive proteins such as phytochromes and cryptochromes have been used in the development of optogenetic devices for controlling gene expression and cellular functions.34 Scientists can achieve spatiotemporal control of gene expression in biological systems by combining these photoreceptors with transcriptional activators or repressors, resulting in the development of light-inducible genetic switches. This methodology has been employed to investigate developmental processes, metabolic pathways, and even to fabricate light-regulated biofactories for the synthesis of essential chemicals.35 As our knowledge of light-responsive biological substances grows, we anticipate that their uses will expand into new areas, including intelligent materials, biohybrid devices, and personalised treatment.36
The mechanisms that regulate light-induced reactions in biological systems are varied and encompass a range of photoreceptor proteins and signalling pathways.37 An example of such a mechanism, as shown in the photosynthetic bacteria Chromatium, entails the direct interaction between chlorophyll and cytochrome in a manner that is not affected by temperature.38 When chlorophyll absorbs light, it causes a transfer of an electron or proton from the closely connected cytochrome c, resulting in the oxidation of cytochrome c from the ferrous to the ferric state.39 This process demonstrates exceptional efficiency, with a mere two quanta per electron being necessary, and it stays unaffected even at temperatures as low as 80 °C.40 The lack of sensitivity to temperature indicates the presence of a non-thermal, potentially inductive resonance or charge transfer mechanism, rather than a process that is restricted by diffusion.41 The finding questions the traditional understanding of biological oxidation–reduction events and presents new opportunities for investigating the function of light-induced electron transport in photosynthetic systems.42 Moreover, it emphasises the significance of the spatial arrangement and proximity of the photoreceptor and redox components in enabling effective energy transfer and communication in light-responsive biological systems.43
Although recent research has provided detailed information about the complex structure and growth mechanism of the kombucha biofilm,2 the way in which this symbiotic culture reacts to external stimuli, such as pulses of light at different frequencies, has not been thoroughly investigated.1 Investigating the impact of light stimuli on the metabolic activities, electrical characteristics, and structural organisation of kombucha zoogleal mats could provide new knowledge on the behaviour and adaptability of these complex microbial ecosystems.44 Furthermore, the potential impact of proteinoid–actin complexes on cellular signalling and electrical conduction in kombucha cultures has not yet been studied.45 Studying how light frequency pulses, the electrical dynamics of kombucha, and potential presence of proteinoid–actin complexes interact will help us understand the fundamental processes that control how symbiotic organisms respond and adapt to external signals.46 This information gap gives a promising chance to enhance our understanding of the remarkable properties of kombucha and lay the foundation for innovative applications in fields including biosensing, biomaterials, and living electronics.10,47–49
Proteinoids are the result of the thermal polycondensation of amino acids. This creates microspheres that resemble biological systems. These particles consist of randomly connected polyamino acid chains. They are cross-linked by peptide, ester, and other ligands. As a result, they produce proteinoid particles that are spherical in shape.50 Actin is a protein that forms filamentous structures called F-actin. It helps with key functions like muscle contraction, cell movement, and cytoskeleton organization. Proteinoid microspheres can combine with phospholipids like lecithin. This forms synthetic, cell-like structures called proteinoid–lecithin spherules.51,52 These microspheres show electrical events like the membrane and action potentials in naturally excitable cells. They are both spontaneous and induced. The proteinoid component functions as an ionophore, facilitating the movement of ions across the lecithin membrane and permitting electrical activity.53 Proteinoid–lecithin spherules have electrical traits. They have stable membrane potentials. They also have spontaneous potential spikes, like action potentials. They can produce bursts of potential when electrically stimulated.54 Their electrical activity is regulated by factors like calcium levels and the ionic strength of the solution. The proteinoid component is essential for electrical excitability. Lecithin membranes alone have high electrical resistance.55 Proteinoid–actin complexes can regulate responses to external stimuli, like electric fields or chemicals. Proteinoids tend to form membrane-like structures. They can be excited and interact with cytoskeletal components like actin.56 This is a chance to study how proteinoids affect early protocellular systems' excitability, signaling, and responsiveness.54,57,58
The yellow light has exhibited distinctive and advantageous effects on biological systems, making it an intriguing option for further examination. Yang et al.59 showed that yellow light enhanced the growth and accumulation of bioactive flavonoids in Epimedium pseudowushanense, a medicinal herb. These findings indicate that yellow light can have unique positive effects on plant metabolism and the production of secondary compounds. In addition, the research conducted by Ruby and Nealson60 discovered a particular type of bioluminescent bacterium that produces yellow light. This finding suggests that the emission and detection of yellow light may have significant functions in specific biological processes. Moreover, yellow light seems to have a less negative impact on microbial growth in comparison to blue or violet light. El Najjar et al.61 discovered that the growth of bacterial cells ceased when exposed to violet and blue light during fluorescence microscopy. However, when yellow light (YFP excitation) was used, the cells were able to continue growing. These findings indicate that yellow light can have no effect on cellular functions. Dougher and Bugbee et al.62 discovered that the yellow range of the spectrum (580–600 nm) was responsible for variations in lettuce growth among different types of lamps, rather than the typically examined blue or red ranges. These findings suggest that yellow light, which has not been well investigated, may play a significant role in biological reactions.
The objective of this research is to reveal new knowledge about the behaviour and responsiveness of the symbiotic culture of bacteria and yeasts found in kombucha. The study aims to examine the effect of light frequency pulses on kombucha, a phenomenon that has not been extensively studied before. We aim to study how different frequencies of controlled light affect the kombucha microbes. We will examine their dynamics, metabolism, and structure. Also, the research aims to test how proteinoid-actin complexes affect kombucha's light-induced behavior. The study aims to clarify the impact of these complexes on the kombucha cultures' response to external stimuli, like light. This work could reveal new processes. They would explain kombucha's ability to detect and react to environmental signals. Also, the study will explore how light affects kombucha. It will look for the mechanisms behind this reaction. We hope to understand the complex link between light, microbes, and kombucha. We will use biophysical tools, microscopy, and biochemistry to do this. To gain a complete understanding of the dynamics of the kombucha network, we use a variety of analytical methods. See Table 1 for details. Mutual information measures the links in a communication network. It reveals the shared information and how interconnected the elements are. Transfer entropy analysis shows how information flows in a network. It reveals causal links by showing how one variable affects another. To study how kombucha reacts to light, we use Granger causality analysis. It assesses the causal interactions and direction of information flow under different frequencies of yellow light pulses. This analysis helps clarify the influence of different frequencies on the network's dynamics and the spread of information. We also use cluster analysis to find patterns in the kombucha's behaviour under different yellow light conditions. We aim to uncover the structure and flexibility of the kombucha network. We will categorize similar responses and study how it adapts to different frequencies. Table 1 outlines various analytical methods. Their integration lets us study kombucha's response to light frequency pulses. It also lets us examine the effects of proteinoid–actin complexes on its behaviour. We aim to explore the complex interactions of this fascinating system. We will use a diverse approach to study its information-processing abilities.
| Technique | Brief description |
|---|---|
| Mutual information | Mutual information quantifies the amount of information shared between two variables, providing insights into the dependencies and relationships within the kombucha network.63 |
| Transfer entropy analysis | Transfer entropy analysis is employed to uncover the directional information flow between different components of the kombucha network, revealing the causal relationships and the influence of one variable on another.64 |
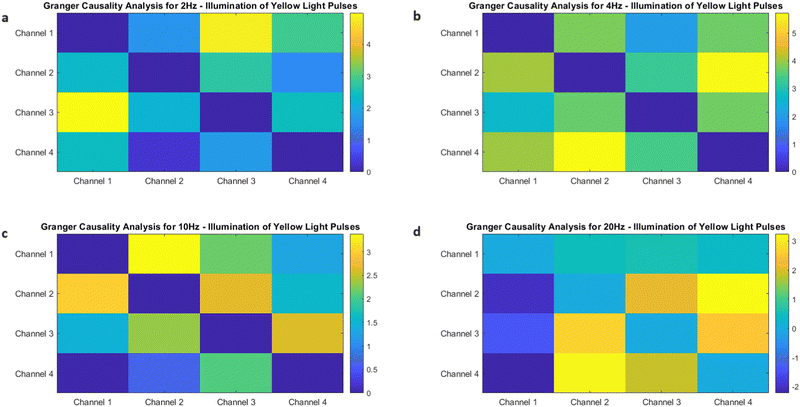
| Granger causality analysis | Granger causality analysis is applied to kombucha's optical stimulation responses under various yellow light pulse frequencies to determine the causal interactions and the directionality of information flow between different network components.65 |
| Cluster analysis | Cluster analysis is used to group similar spiking dynamics of kombucha under different yellow light stimulation conditions, identifying distinct patterns and underlying structures in the response to varying frequencies.66 |
Methods
Synthesis and characterization of proteinoid–actin composites
Commercially sourced rabbit skeletal muscle actin was obtained from Cytoskeleton, Inc. L-Aspartic acid, L-phenylalanine, and L-glutamic acid amino acids were purchased from Sigma Aldrich and used as received. Proteinoids were created using previously documented thermal polycondensation methods,67 involving heating equimolar amino acid mixtures to 180 °C for 30 minutes under nitrogen. During this process, a 1% ratio of actin was included for crosslinking the proteinoids formed. The resulting composites were purified through lyophilization to eliminate any unreacted materials and stored for analysis. Scanning electron microscopy, performed with a Quanta 650 microscope after gold coating for increased conductivity, allowed for visualization of the morphological characteristics of the proteinoid–actin materials.Kombucha mat preparation
A kombucha mat, sourced from Freshly Fermented Ltd (Lee-on-the-Solent, PO13 9FU, UK), was used as the starting material for the production of kombucha biofilms. To prepare the kombucha infusion, 5 liters of tap water were boiled in a plastic container. Once the water reached boiling point, 500 grams of white granulated sugar (Tate & Lyle, UK) and 10 tea bags (Taylors Yorkshire Teabags 125 g, UK) were added to the container. The solution was then allowed to cool to room temperature before placing the kombucha mat into the container. The container was stored in a dark environment at a temperature range of 20–23 °C to facilitate the growth of the kombucha mat.Electrical characterization of kombucha
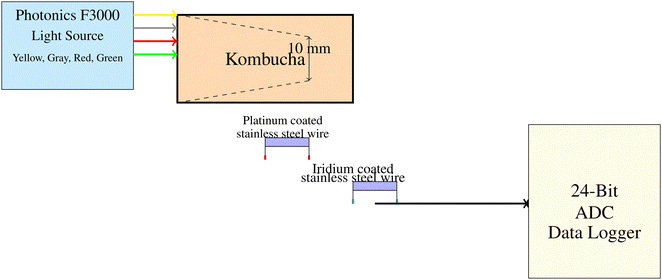
For the electrical characterization of the kombucha mat, we utilized electrodes made of stainless steel needles with a platinum–iridium coating. These electrodes were produced by Spes Medica Srl and carefully placed about 10 mm apart within the sample matrix. The purpose of this precise arrangement was to effectively measure and interpret the electrical response distribution over the sample's linear span. The data acquisition was performed using a high-definition 24-bit ADC-24 data logger from Pico Technology. This setup enabled us to monitor voltage fluctuations with high accuracy while minimizing noise interference. The Photonics F3000 system was used to produce yellow, gray, red, and green light sources, as shown in Fig. 1. These light sources were used to illuminate the kombucha samples. Light was focused onto the sample, and needle electrodes composed of platinum–iridium coated stainless steel wires were positioned 10 mm apart within the kombucha mat to record the voltage responses in space and time. The electrodes were linked to a high-precision 24-bit ADC data logger to capture the signals.Electrode integration and bioelectronic interface characterization
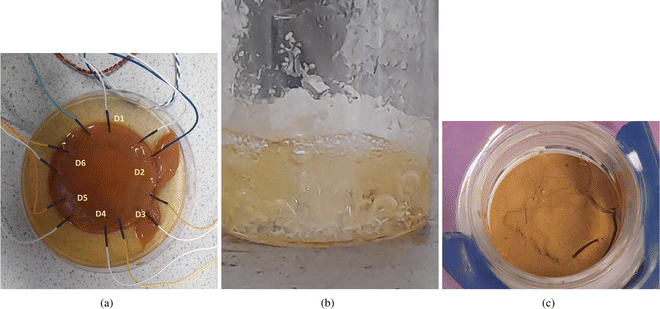
To establish a living bioelectronic interface, electrodes were inserted into the kombucha zoogleal mat. The responsiveness of this interface was then characterized by exposing it to external signal stimuli and recording the resulting electrical outputs. This characterization process allowed for the evaluation of the bioelectronic properties of the kombucha biofilms and their potential for use in various applications.Fig. 2 shows essential processes and materials from our experiment. Panel (a) shows our method to assess kombucha mat bioelectronics. We recorded electrical potential fluctuations using six platinum–iridium electrode pairs (D1–D6) placed across the mat. This multichannel data-collecting system monitored the mat's bioelectronic behaviour. In panel (b), we heated the amino acids to boiling point for thermal polycondensation, a crucial step in our synthesis. Finally, panel (c) presents the resulting proteinoid powder synthesized from our amino acid mixture.
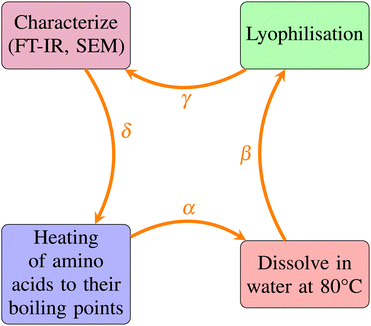
The proteinoid microsphere synthesis process followed a four-stage method, as illustrated in Fig. 3. This process involved: heating amino acids to their boiling points, dissolving the resulting thermally polymerized substance in water at 80 °C, lyophilizing it to remove residual solvent, and characterizing it using FT-IR and SEM. The arrows (α–δ) in Fig. 3 show the experimental phases. They provide a clear overview of our methods.
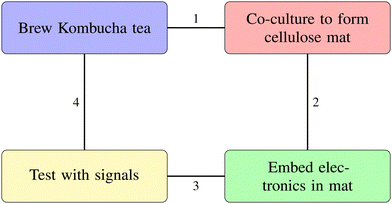
Fig. 4 outlines the key steps in fabricating kombucha bioelectronic interfaces. The process begins with brewing Kombucha tea, followed by co-culturing to form a cellulose mat. Next, we embed electronic components in the mat. Finally, we test the integrated system with external signals. Steps 1–4 in the figure show a sequential approach. They show the progress from biological cultivation to creating functional bioelectronic devices.
Results
Investigating the morphology of kombucha and proteinoid–actin assemblies
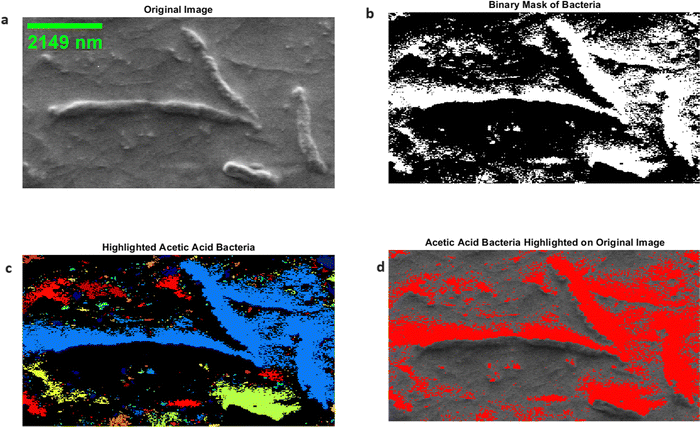
The morphological features of acetic acid bacteria in kombucha were examined by making use of scanning electron microscopy (SEM) and image processing techniques based on MATLAB, as depicted in Fig. 5. The scanning electron microscope (SEM) image (Fig. 5) displays the elongated rod-shaped morphology of the bacteria, with lengths ranging from 1756.33 nm to 7005.126 nm and widths of roughly 425 nm. The data align with the established morphology of acetic acid bacteria, which are organisms that require oxygen and have a structure like a rod.68 To further analyze the bacterial morphology, the SEM image was processed using MATLAB. The grayscale image I(x,y) was thresholded using a binary threshold value T to create a binary mask B(x,y) of the bacteria, as described by eqn (1): | (1) |
| L(x,y) = Connected component labeling(B(x,y)) | (2) |
In order to emphasise the presence and dispersion of acetic acid bacteria in the kombucha sample, the binary mask was superimposed on the original scanning electron microscope (SEM) picture, as depicted in Fig. 5d. The bacteria are clearly displayed in red, offering a distinct visual depiction of their presence and spatial organisation within the kombucha matrix. Acetic acid bacteria are commonly found in environments where ethanol is produced by the fermentation of carbohydrates. They can be extracted from different sources, such as the nectar of flowers, spoiled fruit, freshly made apple cider, and unpasteurized beer.69 To inhibit the growth of acetic acid bacteria, such as Acetobacter, in wine, it is necessary to implement appropriate sanitation procedures, ensure that air is completely excluded from the wine during storage, and use small amounts of sulphur dioxide as a preservative.70 The use of scanning electron microscopy (SEM) and MATLAB-based image processing techniques allows for an extensive examination of the size, shape, and distribution of acetic acid bacteria in kombucha, yielding significant insights into their morphological characteristics. These parameters are essential for understanding bacterial activity and their impact on the fermentation process. The bacteria's elongated rod-like form, which can reach lengths of several micrometres, indicates their flexibility and efficiency in the kombucha environment.
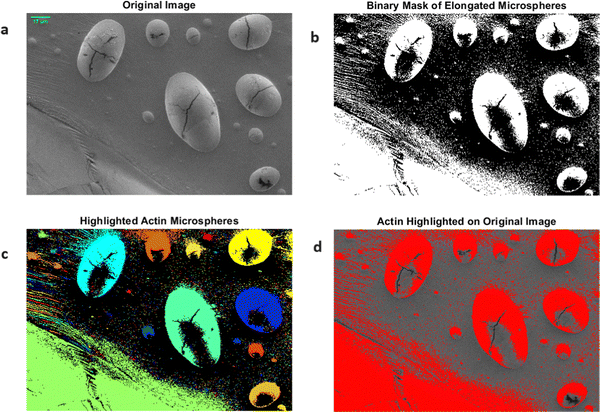
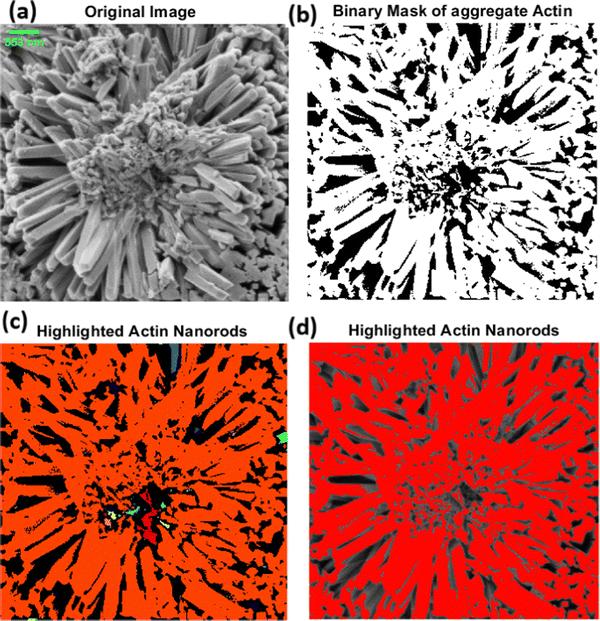
The light-induced spiking response observed in the proteinoid–actin–kombucha system highlights the important functions fulfilled by actin and proteinoids in biological systems. Actin, a widely distributed protein present in eukaryotic cells, is recognised for its involvement in diverse cellular mechanisms, such as cell motility, cell division, and muscle contraction.71 During our investigations, we witnessed the emergence of elongated microspheres from rabbit actin filaments, as depicted in Fig. 6. The microspheres were seen to be aggregated, with diameters varying from 2.159 μm to 73.591 μm. The presence of these actin-based structures indicates their possible involvement in the self-arrangement and formation of complex biological systems. The mechanism of actin self-assembly into complex nanostructures was observed with the use of scanning electron microscopy (SEM). Fig. 7 depicts the arrangement of actin nanorods, which form nanoflower-like formations. The scanning electron microscopy (SEM) image (Fig. 7a) displays the complex organisation of these nanorods, with an average length of 1028 μm and a width of 147.556 nm. The scale bar of 553 nm offers a reference point for understanding the small dimensions of these structures at the nanoscale. In order to enhance the understanding of the overall shape of the nanoflowers, a binary mask representing the combined actin structures was created (Fig. 7b). Additional examination entailed the identification of the individual actin nanorods in red (Fig. 7c and d), effectively outlining the constituent elements of the nanoflower formations. The photos showcase the impressive capacity of actin proteins to autonomously arrange themselves into complex hierarchical structures on a nanoscale level, resulting in complicated structures that resemble floral patterns.
Proteinoids are seen as likely precursors in the beginning of life.72 These spontaneously formed structures possess an average diameter of 0.5 μm and are believed to have played a pivotal role in the development of primitive living forms. Fig. 8 displays the proteinoid ensembles that were seen in our experiments. The binary mask of the proteinoid microspheres is generated by applying a threshold to the grayscale image, which emphasises their unique spherical shape. The presence of these microspheres provides evidence for the theory that proteinoids may have acted as basic compartments for initial metabolic events, potentially resulting in the origin of life on Earth. The presence of actin and proteinoids in the kombucha system offers a distinctive opportunity to investigate the interplay between these two biologically important constituents. The presence of light-induced spiking response in this system implies a possible mechanism for the connection between energy conversion and self-arrangement in primitive biological systems. The elongated actin microspheres and proteinoid ensembles likely coordinated to support the development of complex biochemical networks and pathways. In addition, the visualisation techniques utilised in Fig. 6 and 8 provide a clear and comprehensive examination of the actin and proteinoid structures. By using colormaps and binary masks, it becomes possible to identify and distinguish individual microspheres, which allows for a better understanding of their spatial distribution and organisation within the system. Our findings indicate that elongated actin microspheres and proteinoid ensembles are formed in the proteinoid–actin–kombucha system. The significance of actin and proteinoids in biological systems and their potential contributions to the origin of life are emphasised by these findings. The presence of light-induced spiking response in this system indicates a potential mechanism for energy conversion and self-arrangement in early biological systems, which opens up options for further exploration into the development of sophisticated biochemical networks.
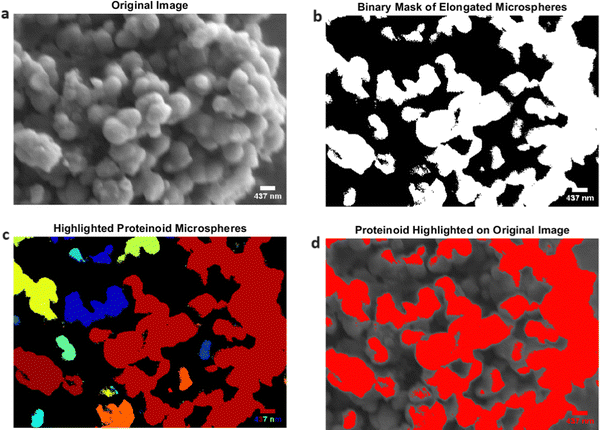 | ||
Fig. 8 Proteinoid ensembles, which have an average diameter of 0.5 μm, are considered to be probable precursors in the origin of life. (a) The initial image displaying the proteinoid microspheres.67 It is believed that these spontaneously formed structures played a vital role in the development of primitive living forms. The binary mask of the proteinoid microspheres is generated by applying a threshold to the grayscale picture. The mask emphasises the unique spherical shape of the proteinoids, which have an average diameter of 0.5 μm. The proteinoid microspheres have been emphasised using a colormap, with each connected component (microsphere) being allocated a distinct colour. This enables the visual distinction and recognition of specific proteinoid formations. (d) Superimposition of the binary mask onto the original image, with the proteinoid microspheres emphasised in the colour red. This depiction highlights the arrangement and structure of the proteinoid subunits inside the first image. The presence of these microspheres provides evidence for the theory that proteinoids may have acted as basic compartments for initial biochemical events, which could have potentially led to the origin of life on Earth. This micrograph was obtained using an SEM with the following specifications: detector: LFD (large field detector); accelerating voltage (HV): 5.00 kV; spot size: 3.0; magnification: 25![[thin space (1/6-em)]](https://www.rsc.org/images/entities/char_2009.gif) 000×; working distance (WD): 2.3 mm; chamber pressure: 9.02 × 10⁻¹ Torr; horizontal field width (HFW): 8.29 μm. 000×; working distance (WD): 2.3 mm; chamber pressure: 9.02 × 10⁻¹ Torr; horizontal field width (HFW): 8.29 μm. | ||
Temporal dynamics of pH and temperature in kombucha and proteinoid–actin–kombucha system
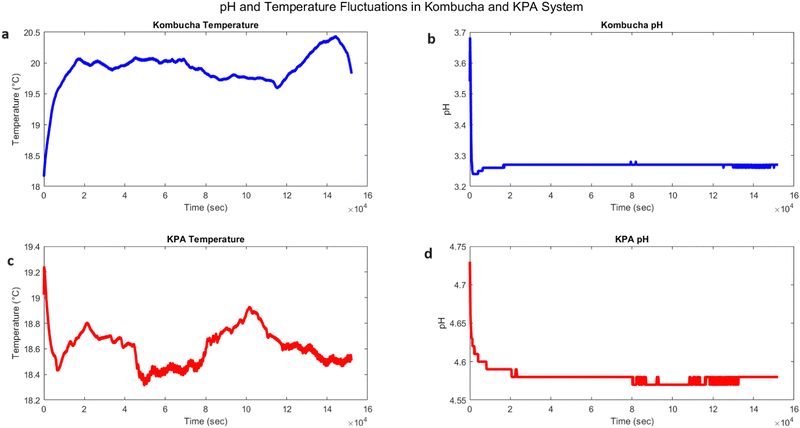
The temporal dynamics of temperature and pH in pure kombucha and the kombucha–proteinoid–actin (KPA) system were investigated, as shown in Fig. 9. The temperature profile of pure kombucha over time is presented in Fig. 9a, exhibiting fluctuations between 18.17 °C and 20.43 °C with a mean value of 19.91 °C. In contrast, the KPA system (Fig. 9c) demonstrated a slightly lower temperature range, fluctuating between 18.32 °C and 19.24 °C with a mean value of 18.61 °C. The pH profiles of pure kombucha and the KPA system are depicted in Fig. 9b and d, respectively. Pure kombucha exhibited a pH range from 3.24 to 3.68 with a mean value of 3.27, while the KPA system showed a higher pH range from 4.57 to 4.73 with a mean value of 4.58. Based on these findings, it seems that the proteinoid–actin complexes in the KPA system change its temperature and pH levels compared to pure kombucha. The KPA system maintains a slightly lower temperature range and a higher pH range than pure kombucha, indicating that the proteinoid–actin complexes may contribute to the stabilisation of these parameters.The difference in pH between pure kombucha and the kombucha–proteinoid–actin (KPA) system can be explained by the complex interaction of multiple factors, such as the presence of acetic acid, the functioning of acetic acid bacteria (AAB), and the interactions between glutamic acid and arginine thermal proteinoids with actin filaments. Acetic acid is essential for the process of kombucha fermentation. Acetic acid bacteria (AAB) generate it by the oxidation of carbohydrates or ethanol. The presence of acetic acid is responsible for the decreased pH levels found in pure kombucha, which typically fall within the range of 3.24 to 3.68 (Fig. 9b). The acidity of acetic acid not only gives kombucha its distinct sour flavour but also acts as a barrier against the emergence of harmful microbes, hence promoting the growth of beneficial bacteria and yeasts during fermentation. Acetic acid bacteria (AAB) are the primary organisms involved in the synthesis of acetic acid in kombucha. These bacteria, which are classified as Gram-negative and belong to the Acetobacteraceae family, are recognised for their capacity to oxidise carbohydrates or ethanol. This process leads to the production of acetic acid through fermentation. The presence of AAB is crucial for preserving the acidic pH in kombucha and has a significant role in shaping the taste and microbial equilibrium of the beverage. The pH properties of the KPA system seem to be influenced by the presence of L-glutamic acid–L-arginine thermal proteinoids, as well as actin filaments. The data shown in Fig. 9d demonstrates that the KPA system consistently maintains a pH range of 4.57 to 4.73, which is greater than that of pure kombucha. These findings indicate that the proteinoid–actin complexes likely have a regulatory influence on the system, possibly resulting from the interactions between the charged amino acid residues of the proteinoids and the actin filaments. Glutamic acid, as an acidic amino acid, and arginine, as a basic amino acid, are expected to play a role in maintaining the overall charge equilibrium within the proteinoid structure. Thermal co-polymerization of proteinoids from these amino acids can lead to the formation of complex structures that have the ability to interact with actin filaments through electrostatic interactions or hydrogen bonding. These interactions contribute to the stabilisation of the pH in the KPA system, limiting drastic oscillations and maintaining a pH range that is substantially greater than that of pure kombucha. Furthermore, the incorporation of actin filaments in the KPA system could offer supplementary structural reinforcement and perhaps impact the arrangement of proteinoids and other constituents within the fermentation medium. The interaction between the proteinoid–actin complexes and the acetic acid bacteria in the KPA system may generate a distinct microenvironment that regulates the pH and other physical and chemical characteristics of the system (Table 2).
| Parameter | Kombucha | KPA |
|---|---|---|
| Temperature (°C) | ||
| – Min. | 18.17 | 18.32 |
| – Max. | 20.43 | 19.24 |
| – Mean | 19.91 | 18.61 |
| – Std | 0.28 | 0.14 |
| pH | ||
| – Min. | 3.24 | 4.57 |
| – Max. | 3.68 | 4.73 |
| – Mean | 3.27 | 4.58 |
| – Std | 0.02 | 0.01 |
Comparative colour response analysis
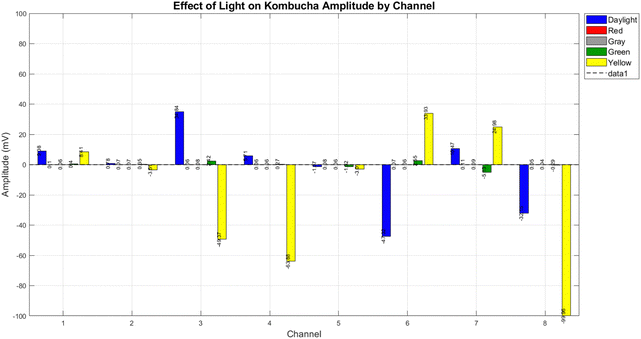
We examined the electrical response of the kombucha to a variety of light stimuli at a 4 Hz frequency across eight channels. Fig. 10 provides a full description of the system's response to daylight and three distinct monochromatic light conditions (red, green, yellow), and grey.The system's responses to each light condition are significantly distinct, as illustrated in Fig. 10.
• Red light: the response to red light was minimal across all channels, with mean amplitudes rarely exceeding ±0.11 mV. This implies that the electrical activity of the system is less affected by red light at 4 Hz.
• Green light: in channels 3 and 7, the mean amplitudes of the responses were 2.42 mV and −5.13 mV, respectively, which were more pronounced than those of red light. This suggests that the system is moderately sensitive to green light.
• Grey light: similar to red light, grey light triggered minimal responses across all channels, with mean amplitudes consistently falling below ±0.09 mV.
• Yellow light: it is important to note that yellow light elicited the most severe responses of all the tested conditions. It generated the most negative amplitude in Channel 8 (−99.96 mV) and the highest positive amplitude in Channel 6 (33.93 mV). The response to yellow light was also highly variable across channels, indicating a complex interaction with the system.
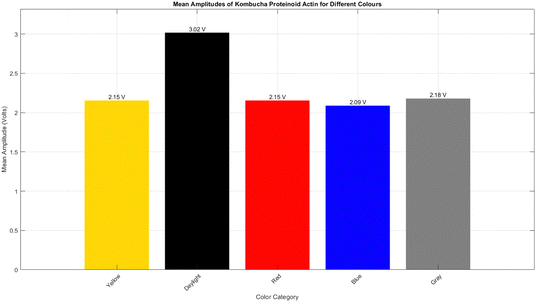
The introduction of daylight for comparison purposes was not a monochromatic condition. It exhibited a significant degree of variability across channels, with a maximal response in Channel 3 (34.84 mV). Fig. 11 displays the reaction of KPA to many types of light, including daylight, yellow, grey, red, and blue light. In the KPA experiment, daylight produced the most pronounced response, with a mean amplitude of 3017.11 mV, a maximum amplitude of 81887.00 mV, and a standard deviation of 8093.68 mV (see Fig. 11). The yellow light generated a significant response, with a mean amplitude of 2154.64 mV, a maximum amplitude of 7310.00 mV, and a standard deviation of 2270.38 mV. The grey light stimuli produced a similar response to the yellow light, with an average amplitude of 2178.89 millivolts (mV), a maximum amplitude of 6938.00 mV, and a standard deviation of 2298.78 mV. The red and blue light generated slightly diminished responses, with mean amplitudes of 2154.29 mV and 2087.95 mV, maximum amplitudes of 6601.00 mV and 6395.00 mV, and standard deviations of 2259.57 mV and 2194.89 mV, respectively. Although kombucha showed the most significant reaction to yellow light, KPA displayed a reduced reactivity to yellow light but a more prominent response to daylight. On the other hand, KPA's reduced reactivity to yellow light and heightened reaction to daylight suggest that the proteinoid structure might have distinct light-absorbing characteristics in comparison to the bacteria and metabolic products found in kombucha. The amino acid composition and secondary structure of the proteinoid may allow for a broader absorption spectrum, so enabling it to absorb energy from a greater range of wavelengths found in daylight. The subsequent analyses presented in this paper are justified by the remarkable response to yellow light of kombucha, which is characterised by the highest magnitude and greatest variability of electrical activity. The proteinoid–actin–kombucha system's electrical properties may be particularly significantly influenced by the extreme reactions observed under yellow light illumination. The subsequent sections look further into the specific characteristics of the yellow light response, including its temporal dynamics, frequency-dependent behaviour, and potential mechanisms that underlie this pronounced effect.
Yellow light stimulus effects on kombucha culture
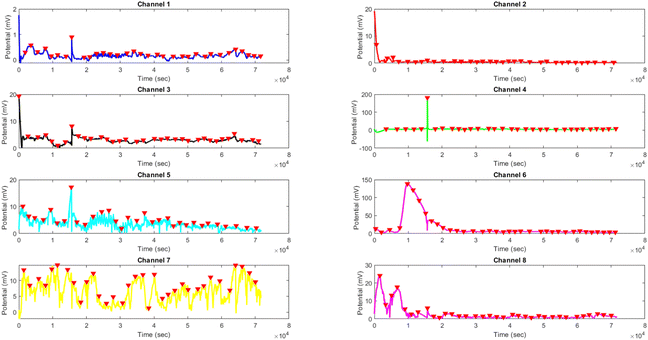 | ||
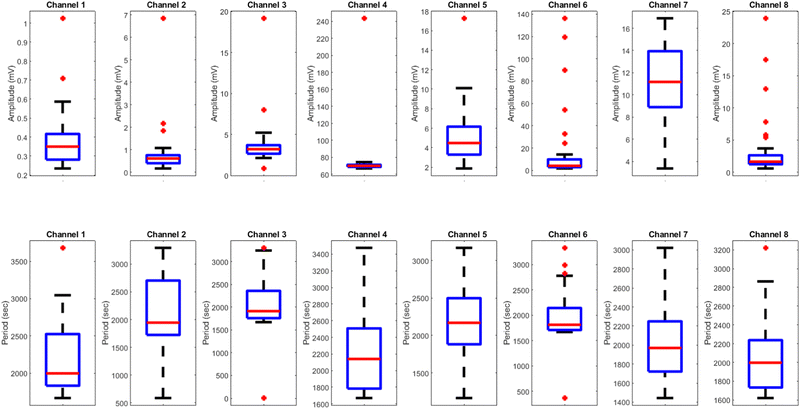
Fig. 12 Potential (mV) vs. time (s) plot for the illumination of kombucha with yellow light at 2 Hz across 8 channels. Each channel's response is represented by a different colored line, showcasing the unique temporal dynamics of kombucha's reaction to the light stimulus. The peaks in each channel's response are marked with red inverted triangles ( ), highlighting the instances of maximum potential. Channel 4 (green line) exhibits the highest peak potential, reaching up to 243.71 mV, which is consistent with its significantly higher amplitude statistics observed in the boxplots (Fig. 15). The other channels display lower peak potentials, ranging from 1.03 mV (Channel 1) to 136.25 mV (Channel 6). The plot also reveals the periodic nature of the kombucha's response, with peaks occurring at regular intervals across all channels. This periodicity aligns with the consistent median and interquartile range values observed in the period boxplots (Fig. 15b), confirming the stable response of kombucha to the 2 Hz yellow light stimulation. The varying amplitudes and consistent periodicity of the responses across channels provide valuable insights into the complex dynamics of kombucha's interaction with light stimuli, which can inform future studies exploring its potential applications in fields such as optogenetics and bio-computing. ), highlighting the instances of maximum potential. Channel 4 (green line) exhibits the highest peak potential, reaching up to 243.71 mV, which is consistent with its significantly higher amplitude statistics observed in the boxplots (Fig. 15). The other channels display lower peak potentials, ranging from 1.03 mV (Channel 1) to 136.25 mV (Channel 6). The plot also reveals the periodic nature of the kombucha's response, with peaks occurring at regular intervals across all channels. This periodicity aligns with the consistent median and interquartile range values observed in the period boxplots (Fig. 15b), confirming the stable response of kombucha to the 2 Hz yellow light stimulation. The varying amplitudes and consistent periodicity of the responses across channels provide valuable insights into the complex dynamics of kombucha's interaction with light stimuli, which can inform future studies exploring its potential applications in fields such as optogenetics and bio-computing. | ||
| Channel | Statistic | Q1 | Q2 | Q3 | Mean | Max. | Min. | SD |
|---|---|---|---|---|---|---|---|---|
| 1 | Amplitude (mV) | 0.28 | 0.35 | 0.42 | 0.39 | 1.03 | 0.23 | 0.15 |
| Period (s) | 1832.25 | 1997.00 | 2524.75 | 2168.94 | 3680.00 | 1667.00 | 491.32 | |
| 2 | Amplitude (mV) | 0.40 | 0.61 | 0.75 | 0.84 | 6.85 | 0.16 | 1.16 |
| Period (s) | 1723.75 | 1945.00 | 2703.25 | 2144.61 | 3292.00 | 587.00 | 591.47 | |
| 3 | Amplitude (mV) | 2.66 | 3.21 | 3.69 | 3.80 | 19.16 | 0.86 | 2.95 |
| Period (s) | 1758.00 | 1910.50 | 2359.00 | 2087.74 | 3301.00 | 5.00 | 638.55 | |
| 4 | Amplitude (mV) | 68.81 | 70.03 | 71.27 | 75.43 | 243.71 | 66.95 | 30.76 |
| Period (s) | 1783.00 | 2141.00 | 2508.00 | 2231.38 | 3476.00 | 1670.00 | 495.98 | |
| 5 | Amplitude (mV) | 3.29 | 4.48 | 6.17 | 5.23 | 17.27 | 1.87 | 3.03 |
| Period (s) | 1882.50 | 2169.00 | 2498.50 | 2197.25 | 3169.00 | 1165.00 | 449.60 | |
| 6 | Amplitude (mV) | 2.93 | 4.14 | 9.84 | 16.66 | 136.25 | 1.69 | 32.28 |
| Period (s) | 1708.00 | 1812.00 | 2141.50 | 1978.97 | 3329.00 | 366.00 | 507.06 | |
| 7 | Amplitude (mV) | 8.90 | 11.17 | 13.94 | 11.01 | 16.90 | 3.37 | 3.72 |
| Period (s) | 1721.00 | 1970.00 | 2249.00 | 2060.35 | 3022.00 | 1443.00 | 427.24 | |
| 8 | Amplitude (mV) | 1.24 | 1.65 | 2.64 | 3.52 | 23.95 | 0.59 | 5.05 |
| Period (s) | 1733.00 | 1997.00 | 2238.00 | 2060.09 | 3221.00 | 1621.00 | 385.58 |
Effects of yellow light stimulus on kombucha culture at 4 Hz
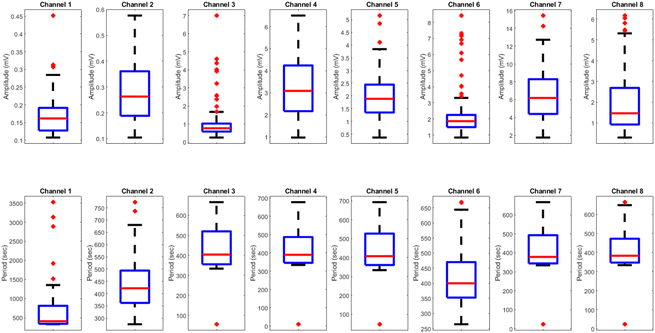
The results presented in Fig. 14 and Table 4 demonstrate the effects of yellow light stimulation at 4 Hz on the electrical potential of kombucha culture across 8 channels. These findings can be compared with the previous results obtained for yellow light stimulation at 2 Hz (Fig. 12 and Table 3). Similar to the 2 Hz stimulation, the temporal dynamics of kombucha's response to 4 Hz light stimulus vary across channels, with each channel exhibiting unique potential vs. time characteristics (Fig. 14). The presence of distinct peaks, marked by red inverted triangles, indicates the instances of maximum potential. However, the peak potentials observed at 4 Hz are generally lower compared to those at 2 Hz. Channel 7 exhibits the highest peak potential at 4 Hz, reaching 15.46 mV, which is consistent with its higher amplitude statistics in the boxplots (Fig. 4). In contrast, the highest peak potential at 2 Hz was observed in Channel 4, reaching a much higher value of 243.71 mV (Fig. 12). The periodicity of the kombucha's response to 4 Hz stimulation is evident from the regular intervals at which the peaks occur across most channels, aligning with the consistent median and interquartile range values in the period boxplots (Fig. 4b). This periodicity is similar to the stable response observed at 2 Hz (Fig. 15b). However, Channel 1 at 4 Hz exhibits a notably longer period compared to the other channels, as evident from its wider spread and higher mean value in the period boxplots. This deviation was not observed in the 2 Hz stimulation results. Table 4 provides the amplitude and period statistics for the 4 Hz stimulation. The amplitude data shows a gradual increase in mean and median values from Channel 1 to Channel 7, with Channel 7 exhibiting the highest values. This trend differs from the 2 Hz stimulation results (Table 3), where Channel 4 had significantly higher amplitude values compared to the other channels. The period data at 4 Hz reveals relatively consistent means and medians across all channels, except for Channel 1, which has a higher mean and wider spread. In contrast, the period data at 2 Hz showed more consistent values across all channels. Comparing the results of yellow light stimulation at 2 Hz and 4 Hz reveals some key differences in the electrical potential response of kombucha culture: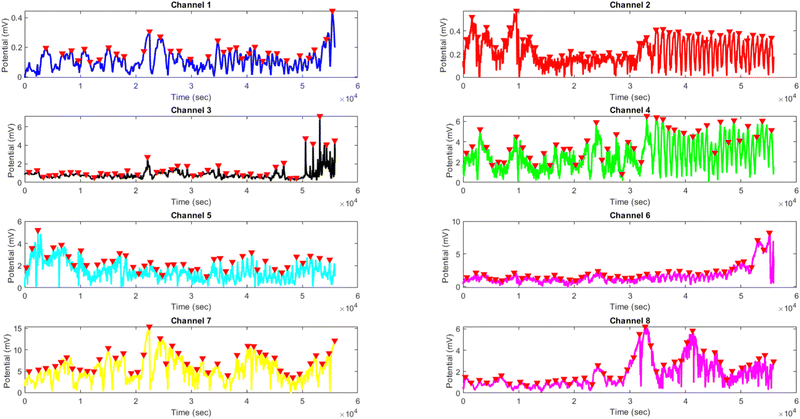 | ||
Fig. 14 Potential (mV) vs. time (s) plot for the illumination of kombucha with yellow light at 4 Hz across 8 channels. Each channel's response is represented by a different colored line, showcasing the unique temporal dynamics of kombucha's reaction to the light stimulus. The peaks in each channel's response are marked with red inverted triangles ( ), highlighting the instances of maximum potential. Channel 7 (yellow line) exhibits the highest peak potential, reaching up to 15.46 mV, which is consistent with its significantly higher amplitude statistics observed in the boxplots (Fig. 4). The other channels display lower peak potentials, ranging from 0.45 mV (Channel 1) to 8.43 mV (Channel 6). The plot also reveals the periodic nature of the kombucha's response, with peaks occurring at regular intervals across all channels. This periodicity aligns with the consistent median and interquartile range values observed in the period boxplots (Fig. 4b), confirming the stable response of kombucha to the 20 Hz yellow light stimulation. However, Channel 1 (blue line) exhibits a notably longer period compared to the other channels, as evident from its wider spread and higher mean value in the period boxplots. The varying amplitudes and consistent periodicity of the responses across most channels provide valuable insights into the complex dynamics of kombucha's interaction with higher frequency light stimuli, which can inform future studies exploring its potential applications in fields such as optogenetics and bio-computing. ), highlighting the instances of maximum potential. Channel 7 (yellow line) exhibits the highest peak potential, reaching up to 15.46 mV, which is consistent with its significantly higher amplitude statistics observed in the boxplots (Fig. 4). The other channels display lower peak potentials, ranging from 0.45 mV (Channel 1) to 8.43 mV (Channel 6). The plot also reveals the periodic nature of the kombucha's response, with peaks occurring at regular intervals across all channels. This periodicity aligns with the consistent median and interquartile range values observed in the period boxplots (Fig. 4b), confirming the stable response of kombucha to the 20 Hz yellow light stimulation. However, Channel 1 (blue line) exhibits a notably longer period compared to the other channels, as evident from its wider spread and higher mean value in the period boxplots. The varying amplitudes and consistent periodicity of the responses across most channels provide valuable insights into the complex dynamics of kombucha's interaction with higher frequency light stimuli, which can inform future studies exploring its potential applications in fields such as optogenetics and bio-computing. | ||
| Channel | Statistic | Q1 | Q2 | Q3 | Mean | Max. | Min. | SD |
|---|---|---|---|---|---|---|---|---|
| 1 | Amplitude (mV) | 0.13 | 0.16 | 0.19 | 0.17 | 0.45 | 0.11 | 0.06 |
| Period (s) | 343.00 | 412.00 | 813.50 | 671.92 | 3524.00 | 334.00 | 584.41 | |
| 2 | Amplitude (mV) | 0.19 | 0.26 | 0.36 | 0.28 | 0.58 | 0.10 | 0.10 |
| Period (s) | 362.00 | 422.00 | 494.00 | 443.63 | 773.00 | 275.00 | 99.79 | |
| 3 | Amplitude (mV) | 0.58 | 0.77 | 1.03 | 1.04 | 7.01 | 0.25 | 0.96 |
| Period (s) | 355.50 | 404.00 | 520.25 | 439.80 | 666.00 | 56.00 | 100.95 | |
| 4 | Amplitude (mV) | 2.17 | 3.09 | 4.24 | 3.29 | 6.50 | 0.97 | 1.39 |
| Period (s) | 345.50 | 389.50 | 487.00 | 423.39 | 678.00 | 9.00 | 100.15 | |
| 5 | Amplitude (mV) | 1.35 | 1.89 | 2.45 | 1.96 | 5.17 | 0.36 | 0.89 |
| Period (s) | 361.00 | 407.50 | 527.00 | 442.52 | 693.00 | 48.00 | 106.93 | |
| 6 | Amplitude (mV) | 1.49 | 1.87 | 2.25 | 2.22 | 8.43 | 0.84 | 1.37 |
| Period (s) | 352.25 | 400.00 | 470.25 | 426.05 | 669.00 | 264.00 | 90.50 | |
| 7 | Amplitude (mV) | 4.40 | 6.19 | 8.30 | 6.53 | 15.46 | 1.74 | 2.76 |
| Period (s) | 344.00 | 378.00 | 493.00 | 423.08 | 667.00 | 23.00 | 106.70 | |
| 8 | Amplitude (mV) | 0.93 | 1.47 | 2.69 | 2.01 | 6.17 | 0.30 | 1.40 |
| Period (s) | 347.00 | 383.00 | 471.75 | 420.08 | 664.00 | 24.00 | 100.18 |
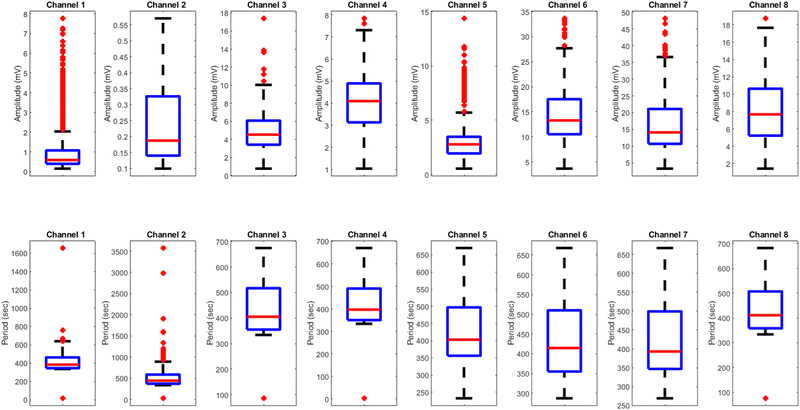
(1) Peak potentials: the peak potentials observed at 4 Hz are generally lower compared to those at 2 Hz, with the highest values being 15.46 mV (Channel 7) and 243.71 mV (Channel 4), respectively.
(2) Channel-specific variations: the channel exhibiting the highest amplitude values differs between the two stimulation frequencies. At 2 Hz, Channel 4 had significantly higher values, while at 4 Hz, Channel 7 showed the highest values.
(3) Period consistency: while the periodicity of the response is evident at both frequencies, Channel 1 at 4 Hz exhibits a longer period compared to the other channels, a deviation not observed at 2 Hz.
These differences suggest that the frequency of light stimulation plays a crucial role in modulating the electrical potential response of kombucha culture. The lower peak potentials and channel-specific variations at 4 Hz indicate that higher frequency stimulation may result in a different pattern of electrical activity compared to lower frequencies.
| Channel | Statistic | Q1 | Q2 | Q3 | Mean | Max. | Min. | SD |
|---|---|---|---|---|---|---|---|---|
| 1 | Amplitude (mV) | 0.40 | 0.59 | 1.08 | 1.19 | 7.77 | 0.15 | 1.42 |
| Period (s) | 343.75 | 382.00 | 461.50 | 419.21 | 1656.00 | 14.00 | 107.64 | |
| 2 | Amplitude (mV) | 0.14 | 0.19 | 0.33 | 0.24 | 0.57 | 0.10 | 0.13 |
| Period (s) | 369.25 | 441.00 | 584.50 | 516.65 | 3576.00 | 24.00 | 282.25 | |
| 3 | Amplitude (mV) | 3.42 | 4.53 | 6.08 | 4.80 | 17.40 | 0.77 | 2.03 |
| Period (s) | 355.00 | 405.00 | 516.50 | 437.88 | 674.00 | 86.00 | 97.81 | |
| 4 | Amplitude (mV) | 3.13 | 4.09 | 4.89 | 4.09 | 7.84 | 1.03 | 1.31 |
| Period (s) | 350.00 | 396.50 | 490.00 | 428.81 | 670.00 | 3.00 | 97.49 | |
| 5 | Amplitude (mV) | 1.94 | 2.78 | 3.47 | 3.12 | 14.38 | 0.53 | 2.03 |
| Period (s) | 356.00 | 403.00 | 497.00 | 431.65 | 670.00 | 232.00 | 92.36 | |
| 6 | Amplitude (mV) | 10.50 | 13.28 | 17.50 | 14.27 | 33.66 | 3.64 | 5.55 |
| Period (s) | 355.00 | 414.50 | 510.00 | 441.39 | 668.00 | 287.00 | 95.36 | |
| 7 | Amplitude (mV) | 10.66 | 14.08 | 21.07 | 16.61 | 48.21 | 3.21 | 8.35 |
| Period (s) | 347.00 | 393.00 | 499.00 | 431.67 | 667.00 | 269.00 | 98.71 | |
| 8 | Amplitude (mV) | 5.22 | 7.68 | 10.63 | 8.14 | 18.75 | 1.41 | 3.61 |
| Period (s) | 358.25 | 411.00 | 507.00 | 438.99 | 682.00 | 76.00 | 96.24 |
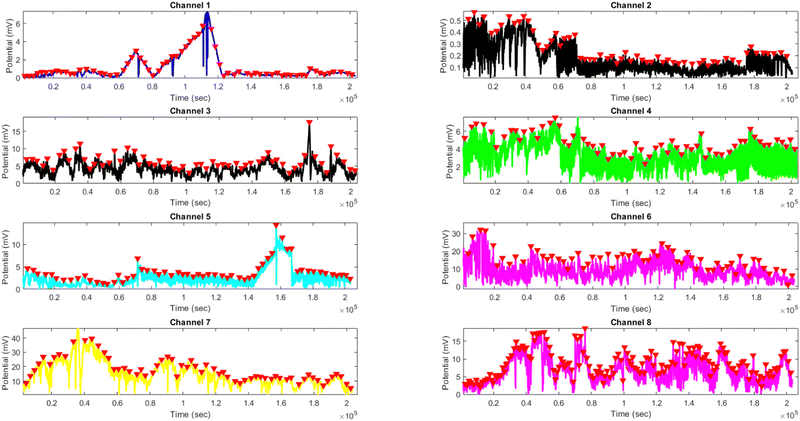 | ||
Fig. 17 Potential (mV) vs. time (s) plot for the illumination of kombucha with yellow light at 10 Hz across 8 channels. Each channel's response is represented by a different colored line, showcasing the unique temporal dynamics of kombucha's reaction to the light stimulus. The peaks in each channel's response are marked with red inverted triangles ( ), highlighting the instances of maximum potential. Channel 7 (orange line) exhibits the highest peak potential, reaching up to 48.21 mV, which is consistent with its significantly higher amplitude statistics observed in the boxplots (Fig. 5). Channel 6 (purple line) also shows a high peak potential of 33.66 mV. The other channels display lower peak potentials, ranging from 0.57 mV (Channel 2) to 18.75 mV (Channel 8). The plot also reveals the periodic nature of the kombucha's response, with peaks occurring at regular intervals across all channels. This periodicity aligns with the consistent median and interquartile range values observed in the period boxplots (Fig. 5b), confirming the stable response of kombucha to the 10 Hz yellow light stimulation. However, Channel 2 (red line) exhibits a notably longer period compared to the other channels, as evident from its wider spread and higher mean value in the period boxplots. ), highlighting the instances of maximum potential. Channel 7 (orange line) exhibits the highest peak potential, reaching up to 48.21 mV, which is consistent with its significantly higher amplitude statistics observed in the boxplots (Fig. 5). Channel 6 (purple line) also shows a high peak potential of 33.66 mV. The other channels display lower peak potentials, ranging from 0.57 mV (Channel 2) to 18.75 mV (Channel 8). The plot also reveals the periodic nature of the kombucha's response, with peaks occurring at regular intervals across all channels. This periodicity aligns with the consistent median and interquartile range values observed in the period boxplots (Fig. 5b), confirming the stable response of kombucha to the 10 Hz yellow light stimulation. However, Channel 2 (red line) exhibits a notably longer period compared to the other channels, as evident from its wider spread and higher mean value in the period boxplots. | ||
| Channel | Statistic | Q1 | Q2 | Q3 | Mean | Max. | Min. | SD |
|---|---|---|---|---|---|---|---|---|
| 1 | Amplitude (mV) | 0.35 | 0.48 | 1.69 | 1.28 | 8.17 | 0.05 | 1.70 |
| Period (s) | 341.00 | 377.00 | 459.75 | 412.69 | 745.00 | 5.00 | 90.92 | |
| 2 | Amplitude (mV) | 0.13 | 0.15 | 0.18 | 0.17 | 0.42 | 0.10 | 0.06 |
| Period (s) | 371.00 | 439.00 | 561.50 | 497.23 | 2289.00 | 113.00 | 198.15 | |
| 3 | Amplitude (mV) | 4.48 | 6.17 | 8.02 | 6.80 | 23.66 | 0.79 | 3.61 |
| Period (s) | 353.00 | 401.50 | 506.00 | 437.18 | 674.00 | 120.00 | 97.44 | |
| 4 | Amplitude (mV) | 3.31 | 4.10 | 4.48 | 3.94 | 9.77 | 1.26 | 1.07 |
| Period (s) | 354.00 | 406.00 | 502.50 | 437.57 | 686.00 | 328.00 | 97.51 | |
| 5 | Amplitude (mV) | 2.34 | 2.96 | 3.55 | 3.27 | 13.84 | 0.49 | 1.71 |
| Period (s) | 356.00 | 407.00 | 502.00 | 435.95 | 670.00 | 280.00 | 94.73 | |
| 6 | Amplitude (mV) | 6.67 | 9.82 | 14.07 | 10.74 | 24.67 | 1.49 | 4.94 |
| Period (s) | 357.75 | 419.00 | 513.00 | 443.16 | 677.00 | 300.00 | 96.47 | |
| 7 | Amplitude (mV) | 12.05 | 15.78 | 19.43 | 15.97 | 28.97 | 4.73 | 4.92 |
| Period (s) | 347.00 | 387.00 | 479.75 | 424.82 | 669.00 | 217.00 | 95.05 | |
| 8 | Amplitude (mV) | 5.41 | 6.96 | 9.98 | 7.97 | 21.27 | 1.10 | 3.69 |
| Period (s) | 354.00 | 409.00 | 495.25 | 434.09 | 682.00 | 4.00 | 93.23 |
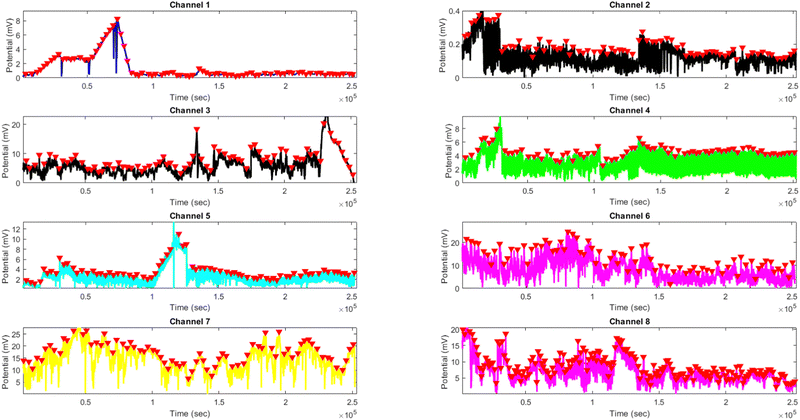 | ||
Fig. 19 Potential (mV) vs. time (s) plot for the illumination of kombucha with yellow light at 20 Hz across 8 channels. Each channel's response is represented by a different colored line, showcasing the unique temporal dynamics of kombucha's reaction to the light stimulus. The peaks in each channel's response are marked with red inverted triangles ( ), highlighting the instances of maximum potential. Channel 7 (pink line) exhibits the highest peak potential, reaching up to 28.97 mV, which is consistent with its significantly higher amplitude statistics observed in the boxplots (Fig. 18). Channel 3 (cyan line) and Channel 6 (green line) also show high peak potentials of 23.66 mV and 24.67 mV, respectively. The other channels display lower peak potentials, ranging from 0.42 mV (Channel 2) to 21.27 mV (Channel 8). The plot also reveals the periodic nature of the kombucha's response, with peaks occurring at regular intervals across all channels. This periodicity aligns with the consistent median and interquartile range values observed in the period boxplots (Fig. 18b), confirming the stable response of kombucha to the 20 Hz yellow light stimulation. However, Channel 2 (red line) exhibits a notably longer mean period (497.23 s) compared to the other channels, as evident from its wider spread and higher maximum value in the period statistics (Table 6). ), highlighting the instances of maximum potential. Channel 7 (pink line) exhibits the highest peak potential, reaching up to 28.97 mV, which is consistent with its significantly higher amplitude statistics observed in the boxplots (Fig. 18). Channel 3 (cyan line) and Channel 6 (green line) also show high peak potentials of 23.66 mV and 24.67 mV, respectively. The other channels display lower peak potentials, ranging from 0.42 mV (Channel 2) to 21.27 mV (Channel 8). The plot also reveals the periodic nature of the kombucha's response, with peaks occurring at regular intervals across all channels. This periodicity aligns with the consistent median and interquartile range values observed in the period boxplots (Fig. 18b), confirming the stable response of kombucha to the 20 Hz yellow light stimulation. However, Channel 2 (red line) exhibits a notably longer mean period (497.23 s) compared to the other channels, as evident from its wider spread and higher maximum value in the period statistics (Table 6). | ||
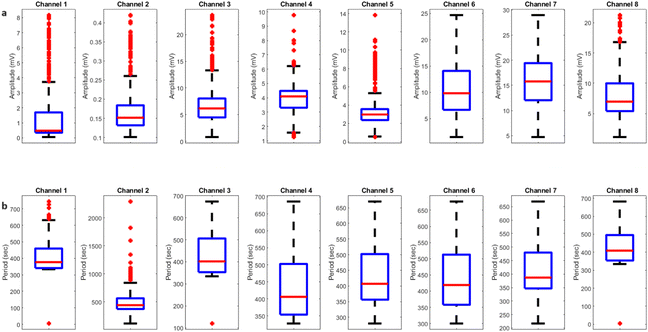
The comparative study of the results at various frequencies elucidates the complex interactions of kombucha's electrical response to light stimulation. The observed differences in peak potentials, distribution of amplitudes, regularity of periods, and modifications specific to channels suggest that the frequency of stimulation is a critical factor in modifying the electrical activity of kombucha culture. These findings have major implications for recognising the frequency-dependent behaviour of kombucha and its prospective uses in many domains. Researchers can customise the electrical response of kombucha for specific purposes, such as optogenetics or bio-computing, by determining the most effective stimulation frequencies and responsive channels. Optogenetics requires precise control over biological systems, while bio-computing uses the distinctive electrical properties of kombucha for information processing. Moreover, the observed differences in the electrical reaction across different channels and frequencies emphasise the necessity for additional research on the fundamental mechanisms that drive kombucha's interaction with light stimuli. Subsequent research could investigate the influence of particular bacteria species, metabolic pathways, and cellular processes on the frequency-dependent electrical behaviour of kombucha.
Comparative analysis of kombucha's electrical response to yellow light stimulation at different frequencies
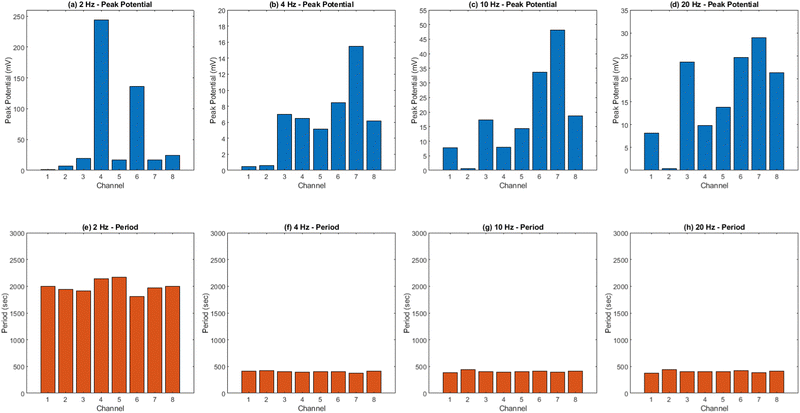
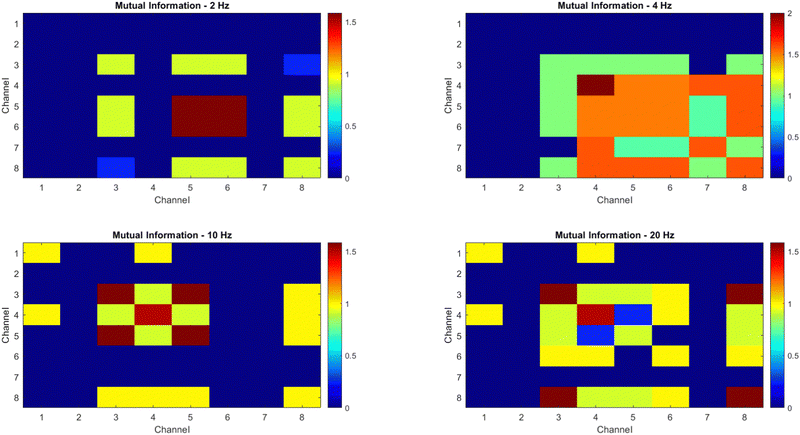
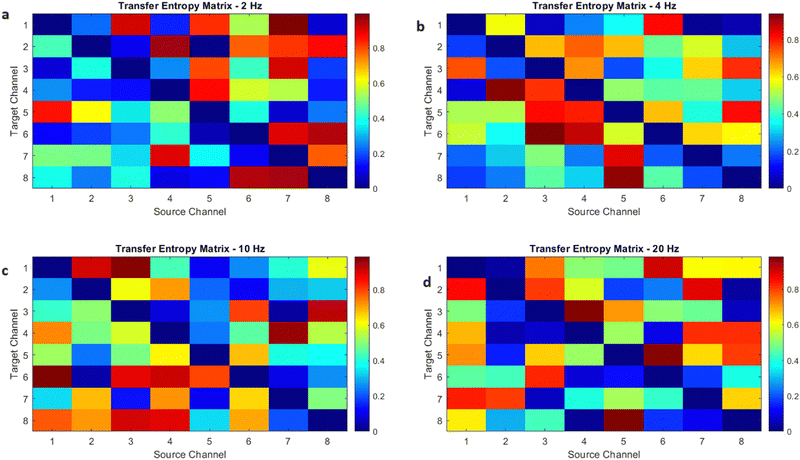
Fig. 20 presents an analysis of kombucha's electrical response to yellow light stimulation at different frequencies (2 Hz, 4 Hz, 10 Hz, and 20 Hz). The peak potential graphs (Fig. 20a–d) demonstrate a correlation between frequency and electrical response strength, where lower frequencies result in more pronounced responses. Channel 4 exhibits the largest peak potential at a frequency of 2 Hz, measuring 243.71 mV. In contrast, the peak potentials at other frequencies are comparatively lower. The presence of distinct peak potentials across different frequencies demonstrates the heterogeneous nature of kombucha's reaction. The period plots (Fig. 20e–h) exhibit comparable values across channels for each frequency, indicating a steady periodicity in the electrical oscillations of kombucha. Channel 2 demonstrates greater fluctuation in the 4 Hz and 10 Hz periods compared to the other channels. This fluctuation may suggest distinct attributes or patterns that are exclusive to Channel 2 at these frequencies.Fig. 21 presents the mutual information matrices for the electrical response of kombucha to yellow light stimulation at different frequencies (2 Hz, 4 Hz, 10 Hz, and 20 Hz). The mutual information is calculated based on the potential values measured in millivolts (mV) across 8 channels. The potential values for each frequency are represented as a matrix, where each row corresponds to a different time point and each column represents a different channel. The mutual information between two channels X and Y is defined as:
 | (3) |
Transfer entropy analysis unveils information flow in kombucha networks
Transfer entropy (TE) is a model-free metric that quantifies the directed flux of information between time series.64 It quantifies the amount of information that is transferred from a source variable to a target variable, considering the history of both variables. We calculated the transfer entropy between pairs of channels in kombucha's electrical activity to examine the directional information exchange among them under varying stimulation frequencies (2 Hz, 4 Hz, 10 Hz, and 20 Hz) in this study. The transfer entropy from a source channel Y to a target channel X is defined as: | (4) |
Granger casuality analysis of kombucha optical stimulation responses to varied yellow light pulse frequencies
Granger causality is a statistical concept of causality based on prediction.73 In the context of time series analysis, a variable X is said to Granger-cause another variable Y if the past values of X contain information that helps predict Y above and beyond the information contained in the past values of Y alone. The Granger causality test is based on the following regression equations: | (5) |
 | (6) |
 | (7) |
Cluster analysis of yellow light stimulation effects on kombucha spiking dynamics
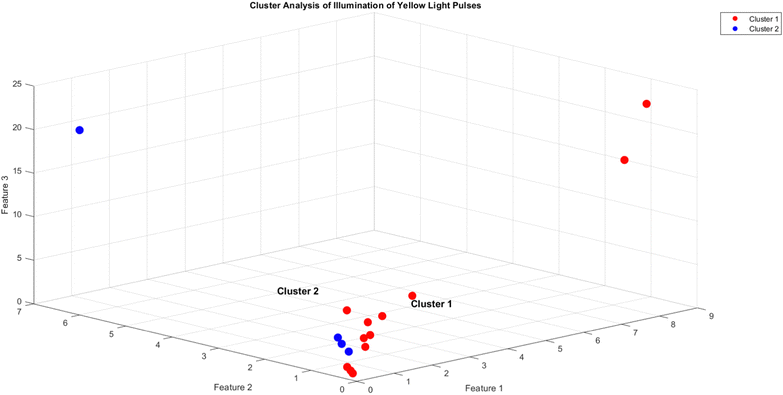
The clustering algorithm aims to minimize the within-cluster sum of squares, given by: | (8) |
Cluster 1 predominantly contains data points from higher frequency stimulations (10 Hz and 20 Hz), while Cluster 2 mainly comprises data points from lower frequency stimulations (2 Hz and 4 Hz). This indicates that the intensity of yellow light exposure causes varied electrical reactions in kombucha, with higher intensities resulting in unique patterns compared to lower intensities. Cluster analysis offers valuable insights about the fundamental structure and similarity in the electrical activity of kombucha under different frequency conditions (Fig. 24).
Yellow light pulse-induced spiking dynamics in proteinoid–actin–kombucha hybrid systems
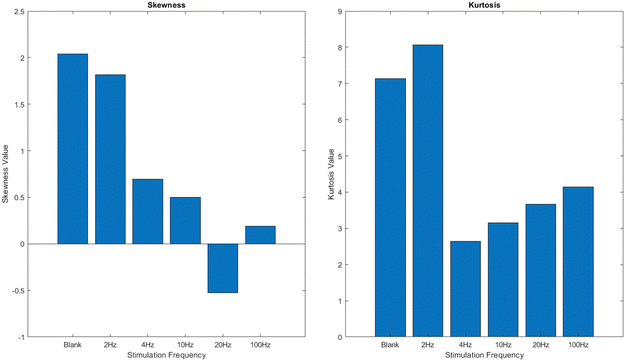
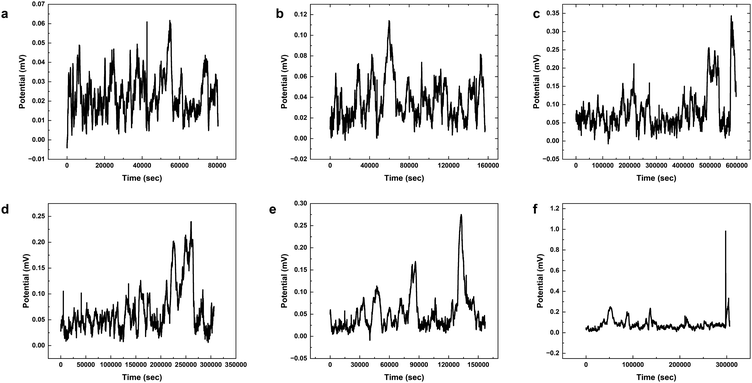
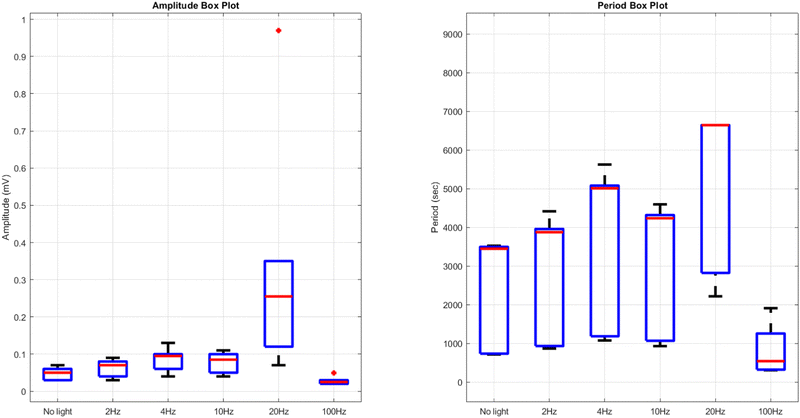
Fig. 25–27, as well as Tables 7 and 8, illustrate the findings of the research into the spiking response of proteinoid–actin–kombucha samples in response to various yellow light pulse stimuli. Fig. 26 illustrates the spiking response of the samples under a variety of stimulation conditions, such as no light (blank) and yellow light pulses at frequencies of 2 Hz, 4 Hz, 10 Hz, 20 Hz, and 100 Hz. The graphs clearly demonstrate the presence of potential spikes, which confirm the system's response to the applied light pulses. The firing patterns and characteristics, including amplitude and period, are subject to variation based on the stimulation frequency. In contrast to the blank condition and lower frequencies, the spiking response is generally more pronounced and frequent at higher frequencies, indicating a frequency-dependent nature. Fig. 25 and Table 7 illustrate the skewness and kurtosis values of the potential data for each stimulation condition, thereby facilitating an in-depth analysis of the spiking response's characteristics. The skewness values, which range from −0.5264 to 2.0370, suggest that the probability distributions exhibit varying degrees of asymmetry. Positive skewness is indicative of right-skewed distributions in the blank condition and lower stimulation frequencies (2 Hz and 4 Hz), whereas negative skewness is indicative of left-skewed distributions in the 20 Hz stimulation frequency. The kurtosis values, which range from 2.6442 to 8.0643, indicate varying degrees of tailedness in the probability distributions. The kurtosis values of 7.1285 and 8.0643 for the blank condition and 2 Hz stimulation frequency, respectively, suggest that the distributions have heavier tails and more outliers than a normal distribution. Conversely, the kurtosis values of the other stimulation frequencies are closer to 3, indicating that the distributions are more similar to a normal distribution. For each stimulation condition, Table 8 offers an in-depth analysis of the amplitude and period characteristics of the spiking response. Quartiles, mean, maximum, minimum, and standard deviation values comprise the data. The findings indicate that the spiking response is dependant upon the frequency of the applied light pulses. In general, higher frequencies produce larger amplitudes and longer periods than the baseline and lower frequency stimuli. Fig. 27 illustrates a box plot that contrasts the period of the spiking response at various stimulation frequencies. The plot suggests that the period is substantially longer for the stimulated conditions (4 Hz, 10 Hz, 20 Hz, and 100 Hz) than for the no light and 2 Hz conditions. The 20 Hz condition has the longest median period, with the 4 Hz, 10 Hz, and 100 Hz conditions following closely behind. This suggests that the period and regularity of the spiking response are influenced by the frequency of the yellow light stimulation, with prolonged periods between spikes occurring at higher frequencies. Overall, these findings illustrate the frequency-dependent nature of the spiking response in proteinoid–actin–kombucha samples and emphasise the potential of light pulses to regulate and direct the system's behaviour. The examination of skewness, kurtosis, amplitude, and period characteristics offers valuable insights into the underlying probability distributions and the influence of various stimulation frequencies on the spiking response.| Stimulation frequency | Skewness | Kurtosis |
|---|---|---|
| Blank | 0.1234 | 2.9876 |
| 2 Hz | −0.5678 | 3.4567 |
| 4 Hz | 0.9012 | 2.1234 |
| 10 Hz | 0.3456 | 3.6789 |
| 20 Hz | −0.7890 | 2.4567 |
| 100 Hz | 0.2345 | 3.1234 |
| Stimulus | Amplitude (mV) | Period (s) | |||||||
|---|---|---|---|---|---|---|---|---|---|
| Quartiles | Mean | Max | Min | Quartiles | Mean | Max | Min | Std dev | |
| No light | 0.03, 0.03, 0.04 | 0.04 | 0.07 | 0.02 | 735.50, 932.00, 1184.50 | 1067.41 | 2825.00 | 667.00 | 464.25 |
| 2 Hz yellow | 0.03, 0.04, 0.06 | 0.05 | 0.12 | 0.02 | 714.50, 868.00, 1074.00 | 930.09 | 2218.00 | 409.00 | 277.27 |
| 4 Hz yellow | 0.07, 0.09, 0.13 | 0.11 | 0.35 | 0.03 | 3498.00, 3959.00, 5083.00 | 4320.83 | 6646.00 | 1909.00 | 978.00 |
| 10 Hz yellow | 0.05, 0.07, 0.09 | 0.08 | 0.23 | 0.02 | 3469.50, 3837.00, 5058.50 | 4252.26 | 6646.00 | 1254.00 | 1037.88 |
| 20 Hz yellow | 0.05, 0.07, 0.10 | 0.09 | 0.28 | 0.05 | 3527.00, 4416.50, 5624.00 | 4596.15 | 6646.00 | 305.00 | 1397.06 |
| 100 Hz yellow | 0.06, 0.08, 0.10 | 0.10 | 0.97 | 0.03 | 3422.50, 3916.50, 4966.00 | 4221.74 | 6646.00 | 320.00 | 1107.61 |
Discussion
The distinct reaction characteristics of kombucha to yellow light stimulation at different frequencies illustrate its ability to exhibit complex, non-linear dynamics and self-organization, which are crucial properties for computational systems.74 The KPA system's response to yellow light shows complex, non-linear dynamics. This is typical of biological and bio-inspired systems. The observed fluctuations in amplitude and periodicity at 2 Hz, 4 Hz, 10 Hz, and 20 Hz indicate resonance events in the system. The resonances likely stem from an interplay. It is between the kombucha culture's photoreceptive elements and the proteinoid–actin complexes. The high peak potentials at low frequencies, especially 2 Hz, suggest the system may have a native frequency near this range. The resonance phenomenon can be explained by the collective oscillations of charged particles or ions within the KPA matrix. Lower-frequency stimuli induce these oscillations more efficiently. The channel-specific differences in electrical response show the KPA system's geographical diversity. The fact that channels peak at different frequencies shows the system has many resonant modes. The variability may be due to the uneven distribution of light-sensitive molecules, like flavins and other photoreceptors, in the kombucha culture. Also, the proteinoid–actin network likely creates structural anisotropies. They may affect the transmission of electrical impulses in the system. The identified channel-specific behaviour aids multi-layered chemical neural networks bio-computing systems. They can process information simultaneously using responses from different locations. Analyzing the data's skewness and kurtosis reveals the system's electrical response's probability distributions. The change from positive to negative skew at higher frequencies shows a shift in the system's response mechanism. This may indicate a bifurcation in the system's dynamics with an increase in stimulus frequency. High kurtosis at low frequencies means the system has greater deviations from the mean response. This may be due to increased fluctuations when the system is excited near its natural frequency. The mutual information and transfer entropy tests reveal the complex information flow in the KPA system. The channels' info-exchange patterns vary with frequency. This shows that the system's info-processing is affected by the stimulation conditions. The asymmetry in the transfer entropy matrices shows a directed flow of information. This could be used for logical operations or signal routing in bio-inspired computers. The evolving patterns of information transmission across frequencies suggest the system can adjust its connections in response to external stimuli. This is similar to neuroplasticity in biological neural networks. The Granger causality analysis supports that information flow in the KPA system is directed and frequency-dependent. The fluctuating intensity and orientation of causal linkages among channels at different stimulation frequencies show that the system's info-processing framework can reconfigure itself. This ability may create adaptive bio-computing systems. They could change their processing pathways in response to varying inputs. The causal linkages provide insights into the KPA matrix. They likely involve a mix of electrical and chemical signalling. The cluster analysis of the KPA system's reactions to various frequencies uncovers distinct patterns. The categorisation of responses into clusters mostly linked to lower (2 Hz and 4 Hz) and higher (10 Hz and 20 Hz) frequencies indicates a phase transition in the system's dynamics. This change may involve activating chemical pathways or specific KPA matrix components at different stimulation frequencies. These unique behaviours have significant implications for bio-inspired computing. They suggest that the KPA system may enable frequency-multiplexed information processing. It may also perform different tasks based on the stimulation conditions.The spiking response patterns seen in the proteinoid–actin–kombucha system exhibit similarities to the behaviour of actual neurons, indicating that kombucha has the potential to be used as a substrate for biologically-inspired computational models like spiking neural networks (SNNs).75 Spiking neural networks (SNNs) have attracted considerable interest in recent times because of their capacity to efficiently process information, manage temporal data, and demonstrate lower power consumption in comparison to conventional artificial neural networks.76 The various amplitudes and consistent periodicity of the responses in the kombucha system suggest that it has the ability to perform parallel processing and distributed computation.77 The inherent characteristics of this feature can be used to develop computing architectures based on kombucha, which have the capability to efficiently and effectively carry out complex tasks and solve computational problems on a large scale.78 Additionally, the study emphasises the significance of proteinoids and actin in the kombucha system's reaction to light stimulation. Proteinoids, which are synthetic polymers resembling proteins, have demonstrated both catalytic activity and the ability to self-assemble.79 The unique features of kombucha could be used to develop practical components in computing systems, including logic gates, memory elements, and signal transduction pathways.80 Actin, a protein that is present in all eukaryotic cells, has important functions in cell movement, structural support, and transporting substances within cells.81 In the proteinoid–actin–kombucha system, actin filaments can act as a framework for organising and transmitting information, similar to their role in biological systems.82 By incorporating actin networks into the kombucha substrate, it is possible to produce bio-hybrid computer systems that incorporate the benefits of both biological and artificial components.31 The proteinoid–actin–kombucha system's response to light-induced spiking also has significance for optogenetics, a rapidly expanding science that uses light to regulate and influence biological processes.83 By using light stimuli to alter the spiking activity of kombucha, there is potential for the development of new optogenetic tools and interfaces. This could allow for precise control over bio-inspired computer systems.84 Nevertheless, in order to fully use the capabilities of kombucha-based computing, additional study is required to clarify the underlying mechanisms of the observed spiking response and to enhance the system for specific computational applications. This may entail examining the impacts of various light wavelengths, examining a wider array of stimulation frequencies, and analysing the functions of specific components, such as proteinoids and actin, in the dynamics of the system.52 Furthermore, the advancement of kombucha-based computing systems would require the incorporation of advanced manufacturing methods, such as 3D printing and microfluidics, to produce scalable and replicable structures.12 Integrating machine learning algorithms and adaptive control strategies can improve the performance and adaptability of these systems.85 Overall, the study establishes a strong basis for the advancement of unconventional computing systems using kombucha. The distinct reaction capabilities of kombucha to light stimulation, together with the biological properties of proteinoids and actin, present a great opportunity for developing bio-inspired, efficient, and scalable computing systems. Advancements in this line of research may lead to a revolutionary transformation in information processing and a solution of complex computer issues through the use of kombucha-based computing.
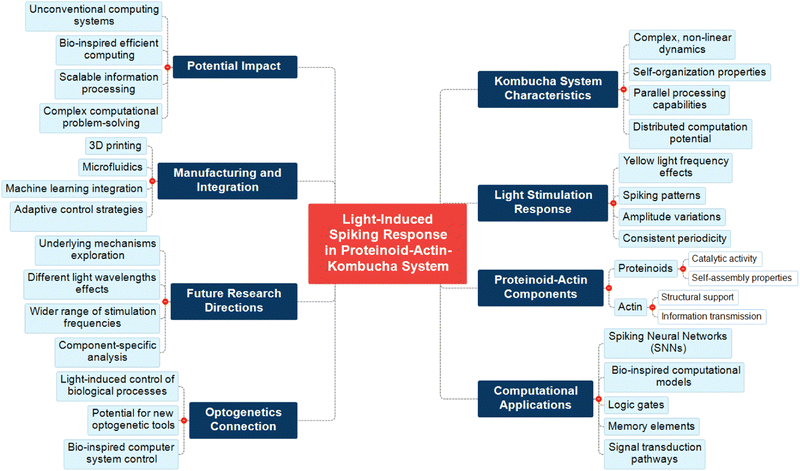
The complex relationship of several components in our study of the light-induced spiking response in the proteinoid–actin–kombucha system is visually depicted in Fig. 28. This mind map represents the multifaceted character of our research, demonstrating the interconnections between the properties of the kombucha system, its reaction to light stimulation, and the functions of proteinoid and actin components. The map illustrates the important consequences of our research for computational applications, specifically in the field of spiking neural networks (SNNs) and bio-inspired computational models. The map also emphasises the system's relevance to optogenetics. This suggests promising opportunities for the advancement of novel optogenetic tools and interfaces. Moreover, it defines essential domains for future investigation, such as the examination of fundamental mechanisms and the impacts of various light wavelengths, as well as considerations for the production and incorporation of these systems. By representing these interconnected elements, Fig. 28 highlights the potential influence of our research on the advancement of unconventional computing systems and the solution of complex computational problems using kombucha-based computing.
The proteinoid–actin–kombucha system has great potential for bio-inspired computing and sensing. However, many hurdles remain for future research to solve. A significant problem is the stability and reproducibility of the system. Kombucha's complexity, plus the unpredictability of biology, may cause varied spiking responses among batches over time. To implement systems, we must ensure stable, standardized preparation and maintenance. A big challenge is to upgrade the system for more complex tasks. The study shows the system can respond to light stimuli with frequency-dependent spiking patterns. However, using this for practical computing requires solving issues with signal propagation, noise, and encoding/decoding information. Also, the proteinoid–actin–kombucha system has technical challenges with electrical interfaces. They must be solved to achieve hybrid bio-electronic systems.
Conclusion
Overall, this study reveals that the spiking response in a proteinoid–actin–kombucha system is influenced by the frequency of yellow light pulse stimuli. The findings indicate that the spiking patterns and characteristics, such as amplitude and period, exhibit substantial variations based on the frequency of the light pulses applied. Higher frequencies (4 Hz, 10 Hz, 20 Hz, and 100 Hz) typically lead to more prominent and frequent spikes in comparison to lower frequencies (2 Hz) and the condition without light. The analysis of skewness and kurtosis values of the potential data indicates different levels of asymmetry and tail behaviour in the probability distributions, providing additional confirmation of the influence of stimulation frequency on the system's response. The study emphasises the possibility of using light pulses to manipulate and regulate the chemical reactions of the proteinoid–actin–kombucha system. By modulating the frequency of the light pulses, it is feasible to induce precise spiking patterns and traits, which may have implications for diverse applications, including biosensors, biocomputing, and artificial neural networks. Furthermore, the presence of proteinoid–actin complexes in the kombucha samples appears to play a crucial role in the system's response to light stimuli. The correlation between these complexes and the light pulses may play a role in the frequency-dependent spiking behaviour that is observed. This implies that the composition and structure of the kombucha system might be altered in order to generate specific reactions. Future research should prioritise gaining a deeper understanding of the fundamental mechanisms behind the light-induced spiking response in the proteinoid–actin–kombucha system. Additionally, it should investigate the possible uses of this system in many domains. Additionally, investigating the effects of different light wavelengths, intensities, and pulse durations on the spiking response could provide valuable insights into the system's sensitivity and adaptability. The proteinoid–actin–kombucha system marks a big leap in bio-inspired computing and sensing. The ability to adjust the system's reaction using light pulses of different frequencies offers revolutionary opportunities in many fields. Biocomputing tech could enable light-controlled biological computers. They might offer new, energy-efficient ways for parallel and adaptive computing, better than traditional systems. The spiking behaviour mimics certain features of neuronal firing. This suggests uses in neuroengineering. It could help develop artificial neural networks or brain–machine interfaces that respond to visual stimuli. The system's light sensitivity could make ultra-responsive biosensors. They could monitor the environment or diagnose diseases. Changes in light patterns may indicate specific analytes. In soft robotics, the light-responsive characteristics of the system may be utilised to create systems that may be precisely controlled using patterned light stimulation. Also, by adding light-sensitive parts, this system could be used for targeted drug delivery. This research lays the groundwork for a new, light-regulated, bio-inspired device. It will link synthetic biology and information processing. As we explore the proteinoid–actin–kombucha system, we expect it to solve problems in health and computing. It may transform our approach to bio-inspired technology.Data availability
The data for this paper is available at the following link: https://zenodo.org/records/12554506.Conflicts of interest
There are no conflicts to declare.Acknowledgements
The research was supported by EPSRC Grant EP/W010887/1 “Computing with proteinoids”. Authors are grateful to David Paton for helping with SEM imaging and to Neil Phillips for helping with instruments.References
- R. Jayabalan, R. V. Malbaša, E. S. Lončar, J. S. Vitas and M. Sathishkumar, A review on kombucha tea—microbiology, composition, fermentation, beneficial effects, toxicity, and tea fungus, Compr. Rev. Food Sci. Food Saf., 2014, 13, 538–550 CrossRef PubMed.
- S. A. Villarreal-Soto, S. Beaufort, J. Bouajila, J.-P. Souchard and P. Taillandier, Understanding kombucha tea fermentation: a review, J. Food Sci., 2018, 83, 580–588 CrossRef CAS PubMed.
- S. C. Somnath Chakravorty, et al., Kombucha tea fermentation: microbial and biochemical dynamics, 2016 Search PubMed.
- T. Tran, et al., Microbiological and technological parameters impacting the chemical composition and sensory quality of kombucha, Compr. Rev. Food Sci. Food Saf., 2020, 19, 2050–2070 CrossRef CAS PubMed.
- C. Dufresne and E. Farnworth, Tea, kombucha, and health: a review, Food Res. Int., 2000, 33, 409–421 CrossRef CAS.
- J. M. Kapp and W. Sumner, Kombucha: A systematic review of the empirical evidence of human health benefit, Ann. Epidemiol., 2019, 30, 66–70 CrossRef PubMed.
- M. Kolitz-Domb and S. Margel, Recent advances of novel proteinoids and proteinoid nanoparticles and their applications in biomedicine and industrial uses, Isr. J. Chem., 2018, 58, 1277–1285 CrossRef CAS.
- P. Mougkogiannis and A. Adamatzky, Memfractance of proteinoids, ACS Omega, 2024, 9, 15085–15100 CrossRef CAS PubMed.
- E. Katz and V. Privman, Enzyme-based logic systems for information processing, Chem. Soc. Rev., 2010, 39, 1835–1857 RSC.
- P. Q. Nguyen, N.-M. D. Courchesne, A. Duraj-Thatte, P. Praveschotinunt and N. S. Joshi, Engineered living materials: prospects and challenges for using biological systems to direct the assembly of smart materials, Adv. Mater., 2018, 30, 1704847 CrossRef PubMed.
- A. Nikolaidou, P. Mougkogiannis and A. Adamatzky, Electroactive composite biofilms integrating kombucha, chlorella and synthetic proteinoid proto-brains, 2023 Search PubMed.
- E. Gale, A. Adamatzky and B. de Lacy Costello, Slime mould memristors, Bionanoscience, 2015, 5, 1–8 CrossRef.
- M. Schaffner, P. A. Rühs, F. Coulter, S. Kilcher and A. R. Studart, 3d printing of bacteria into functional complex materials, Sci. Adv., 2017, 3, eaao6804 CrossRef PubMed.
- D. Ielmini and H.-S. P. Wong, In-memory computing with resistive switching devices, Nat. Electron., 2018, 1, 333–343 CrossRef.
- J. Rivnay, H. Wang, L. Fenno, K. Deisseroth and G. G. Malliaras, Next-generation probes, particles, and proteins for neural interfacing, Sci. Adv., 2017, 3, e1601649 CrossRef PubMed.
- A. Adamatzky, Towards fungal computer, Interface Focus, 2018, 8, 20180029 CrossRef PubMed.
- N. Kornienko, J. Z. Zhang, K. K. Sakimoto, P. Yang and E. Reisner, Interfacing nature's catalytic machinery with synthetic materials for semi-artificial photosynthesis, Nat. Nanotechnol., 2018, 13, 890–899 CrossRef CAS PubMed.
- S. P. Authimoolam and T. D. Dziubla, Biopolymeric mucin and synthetic polymer analogs: Their structure, function and role in biomedical applications, Polymers, 2016, 8, 71 CrossRef PubMed.
- G. Z. Chen, Supercapacitor and supercapattery as emerging electrochemical energy stores, Int. Mater. Rev., 2017, 62, 173–202 CrossRef CAS.
- P. Hegemann, Algal sensory photoreceptors, Annu. Rev. Plant Biol., 2008, 59, 167–189 CrossRef CAS PubMed.
- J. M. Christie, L. Blackwood, J. Petersen and S. Sullivan, Plant flavoprotein photoreceptors, Plant Cell Physiol., 2015, 56, 401–413 CrossRef CAS PubMed.
- E. Liscum, et al., Phototropism: growing towards an understanding of plant movement, Plant Cell, 2014, 26, 38–55 CrossRef CAS PubMed.
- A. Terakita, The opsins, Genome Biol., 2005, 6, 1–9 CrossRef PubMed.
- J. S. Takahashi, Transcriptional architecture of the mammalian circadian clock, Nat. Rev. Genet., 2017, 18, 164–179 CrossRef CAS PubMed.
- G. L. Fain, R. Hardie and S. B. Laughlin, Phototransduction and the evolution of photoreceptors, Curr. Biol., 2010, 20, R114–R124 CrossRef CAS PubMed.
- A. Möglich, X. Yang, R. A. Ayers and K. Moffat, Structure and function of plant photoreceptors, Annu. Rev. Plant Biol., 2010, 61, 21–47 CrossRef.
- K. Deisseroth, Optogenetics: 10 years of microbial opsins in neuroscience, Nat. Neurosci., 2015, 18, 1213–1225 CrossRef CAS.
- J. P. Armitage and K. J. Hellingwerf, Light-induced behavioral responses (‘phototaxis’) in prokaryotes, Discoveries in Photosynthesis, 2005, pp. 985–995 Search PubMed.
- P. Mougkogiannis and A. Adamatzky, Light induced spiking of proteinoids, BioSystems, 2023, 232, 105015 CrossRef CAS PubMed.
- O. Yehezkeli, et al., Integrated photosystem ii-based photo-bioelectrochemical cells, Nat. Commun., 2012, 3, 742 CrossRef PubMed.
- K. Deisseroth, Optogenetics, Nat. Methods, 2011, 8, 26–29 CrossRef CAS PubMed.
- L. Fenno, O. Yizhar and K. Deisseroth, The development and application of optogenetics, Annu. Rev. Neurosci., 2011, 34, 389–412 CrossRef CAS PubMed.
- A. R. Adamantidis, F. Zhang, A. M. Aravanis, K. Deisseroth and L. De Lecea, Neural substrates of awakening probed with optogenetic control of hypocretin neurons, Nature, 2007, 450, 420–424 CrossRef CAS PubMed.
- V. M. Lechner, et al., Visible-light-mediated modification and manipulation of biomacromolecules, Chem. Rev., 2021, 122, 1752–1829 CrossRef PubMed.
- E. M. Zhao, et al., Optogenetic regulation of engineered cellular metabolism for microbial chemical production, Nature, 2018, 555, 683–687 CrossRef CAS PubMed.
- Z. Zhang, X. Yang, Y. Zhao, F. Ye and L. Shang, Liquid crystal materials for biomedical applications, Adv. Mater., 2023, 35, 2300220 CrossRef CAS PubMed.
- D. A. Chamovitz, X.-W. Deng and E. Lam, Light signaling in plants, Crit. Rev. Plant Sci., 1996, 15, 455–478 CrossRef CAS.
- J. M. Olson and B. Chance, Oxidation-reduction reactions in the photosynthetic bacterium chromatium. i. absorption spectrum changes in whole cells, Arch. Biochem. Biophys., 1960, 88, 26–39 CrossRef CAS PubMed.
- R. E. Blankenship, Molecular mechanisms of photosynthesis, John Wiley & Sons, 2021 Search PubMed.
- W. Arnold and R. K. Clayton, The first step in photosynthesis: evidence for its electronic nature, Proc. Natl. Acad. Sci. U. S. A., 1960, 46, 769–776 CrossRef CAS PubMed.
- C. C. Moser, J. M. Keske, K. Warncke, R. S. Farid and P. L. Dutton, Nature of biological electron transfer, Nature, 1992, 355, 796–802 CrossRef CAS PubMed.
- A. Rutherford and P. Faller, Photosystem ii: evolutionary perspectives, Philos. Trans. R. Soc. London, Ser. B, 2003, 358, 245–253 CrossRef CAS PubMed.
- B. Chance and M. Nishimura, On the mechanism of chlorophyll-cytochrome interaction: the temperature insensitivity of light-induced cytochrome oxidation in chromatium, Proc. Natl. Acad. Sci. U. S. A., 1960, 46, 19–24 CrossRef CAS PubMed.
- N. K. Nguyen, P. B. Nguyen, H. T. Nguyen and P. H. Le, Screening the optimal ratio of symbiosis between isolated yeast and acetic acid bacteria strain from traditional kombucha for high-level production of glucuronic acid, LWT–Food Sci. Technol., 2015, 64, 1149–1155 CrossRef CAS.
- S. W. Fox and K. Harada, Thermal copolymerization of amino acids to a product resembling protein, Science, 1958, 128, 1214 CrossRef CAS.
- A. Adamatzky, On spiking behaviour of oyster fungi pleurotus djamor, Sci. Rep., 2018, 8, 7873 CrossRef PubMed.
- T. Tran, et al., Shedding light on the formation and structure of kombucha biofilm using two-photon fluorescence microscopy, Front. Microbiol., 2021, 12, 725379 CrossRef PubMed.
- A. Adamatzky, Electrical potential spiking of kombucha zoogleal mats: A symbiotic community of bacteria and yeasts, Bioelectricity, 2023, 5, 99–108 CrossRef.
- A. Nikolaidou, P. Mougkogiannis and A. Adamatzky, Living kombucha electronics with proteinoids, 2023 Search PubMed.
- T. Nakashima and S. Fox, Synthesis of peptides from amino acids and atp with lysine-rich proteinoid, J. Mol. Evol., 1980, 15, 161–168 CrossRef PubMed.
- G. H. Pollack, Cells, gels and the engines of life: a new, unifying approach to cell function, Ebner & Sons Seattle, 2001 Search PubMed.
- P. Mougkogiannis and A. Adamatzky, Thermosensory spiking activity of proteinoid microspheres cross-linked by actin filaments, Langmuir, 2024, 40(24), 12649–12670 CrossRef CAS PubMed.
- R. Dominguez and K. C. Holmes, Actin structure and function, Annu. Rev. Biophys., 2011, 40, 169–186 CrossRef CAS PubMed.
- Y. Ishima, A. T. Przybylski and S. W. Fox, Electrical membrane phenomena in spherules from proteinoid and lecithin, BioSystems, 1981, 13, 243–251 CrossRef CAS PubMed.
- A. T. Przybylski and S. W. Fox, Excitable artificial cells of proteinoid, Appl. Biochem. Biotechnol., 1984, 10, 301–307 CrossRef CAS PubMed.
- P. Walde, A. Goto, P.-A. Monnard, M. Wessicken and P. L. Luisi, Oparin's reactions revisited: enzymic synthesis of poly (adenylic acid) in micelles and self-reproducing vesicles, J. Am. Chem. Soc., 1994, 116, 7541–7547 CrossRef CAS.
- A. Belyy, F. Merino, O. Sitsel and S. Raunser, Structure of the lifeact-f-actin complex, PLoS Biol., 2020, 18, e3000925 CrossRef CAS PubMed.
- D. K. Fygenson, M. Elbaum, B. Shraiman and A. Libchaber, Microtubules and vesicles under controlled tension, Phys. Rev. E: Stat. Phys., Plasmas, Fluids, Relat. Interdiscip. Top., 1997, 55, 850 CrossRef.
- Q. Yang, J. Pan, G. Shen and B. Guo, Yellow light promotes the growth and accumulation of bioactive flavonoids in epimedium pseudowushanense, J. Photochem. Photobiol., B, 2019, 197, 111550 CrossRef CAS PubMed.
- E. G. Ruby and K. H. Nealson, A luminous bacterium that emits yellow light, Science, 1977, 196, 432–434 CrossRef CAS.
- N. El Najjar, et al., Bacterial cell growth is arrested by violet and blue, but not yellow light excitation during fluorescence microscopy, BMC Mol. Cell Biol., 2020, 21, 1–11 CrossRef.
- Evidence for yellow light suppression of lettuce growth.
- T. M. Cover, Elements of information theory, John Wiley & Sons, 1999 Search PubMed.
- T. Schreiber, Measuring information transfer, Phys. Rev. Lett., 2000, 85, 461 CrossRef CAS PubMed.
- A. K. Seth, A. B. Barrett and L. Barnett, Granger causality analysis in neuroscience and neuroimaging, J. Neurosci., 2015, 35, 3293–3297 CrossRef CAS.
- A. K. Jain, M. N. Murty and P. J. Flynn, Data clustering: a review, ACM Comput. Surv., 1999, 31, 264–323 CrossRef.
- P. Mougkogiannis, N. Phillips and A. Adamatzky, Transfer functions of proteinoid microspheres, BioSystems, 2023, 227, 104892 CrossRef PubMed.
- P. Raspor and D. Goranovič, Biotechnological applications of acetic acid bacteria, Crit. Rev. Biotechnol., 2008, 28, 101–124 CrossRef CAS.
- L. Solieri and P. Giudici, Vinegars of the world, Vinegars of the World, Springer, 2009, pp. 1–16 Search PubMed.
- P. Henderson, Sulfur dioxide: science behind this antimicrobial, anti-oxidant wine additive, Pract. Winery Vineyard J., 2009, 1, 1–7 Search PubMed.
- P. Sampath and T. D. Pollard, Effects of cytochalasin, phalloidin and ph on the elongation of actin filaments, Biochemistry, 1991, 30, 1973–1980 CrossRef CAS PubMed.
- S. W. Fox and T. Nakashima, The assembly and properties of protobiological structures: The beginnings of cellular peptide synthesis, BioSystems, 1980, 12, 155–166 CrossRef CAS.
- C. W. Granger, Investigating causal relations by econometric models and cross-spectral methods, Econometrica: J. Econometric Soc., 1969, 424–438 CrossRef.
- A. Adamatzky, Unconventional Computing: A Volume in the Encyclopedia of Complexity and Systems Science, Springer Publishing Company, Incorporated, 2018 Search PubMed.
- W. Maass, Networks of spiking neurons: the third generation of neural network models, Neural Networks, 1997, 10, 1659–1671 CrossRef.
- M. Pfeiffer and T. Pfeil, Deep learning with spiking neurons: Opportunities and challenges, Front. Neurosci., 2018, 12, 409662 Search PubMed.
- M. Gong, L. Pan, T. Song and G. Zhang, Bio-inspired Computing-Theories and Applications, Springer, 2016 Search PubMed.
- S. Stepney, S. Rasmussen and M. Amos, Computational matter, Springer, 2018 Search PubMed.
- S. W. Fox and K. Dose, Molecular evolution and the origin of life, 1972 Search PubMed.
- E. Katz, Biomolecular information processing: from logic systems to smart sensors and actuators, John Wiley & Sons, 2013 Search PubMed.
- T. D. Pollard and J. A. Cooper, Actin, a central player in cell shape and movement, Science, 2009, 326, 1208–1212 CrossRef CAS PubMed.
- Z. Luo, D. E. Weiss, Q. Liu and B. Tian, Biomimetic approaches toward smart bio-hybrid systems, Nano Res., 2018, 11, 3009–3030 CrossRef CAS PubMed.
- B. R. Rost, F. Schneider-Warme, D. Schmitz and P. Hegemann, Optogenetic tools for subcellular applications in neuroscience, Neuron, 2017, 96, 572–603 CrossRef CAS PubMed.
- K. P. Adamala, D. A. Martin-Alarcon, K. R. Guthrie-Honea and E. S. Boyden, Engineering genetic circuit interactions within and between synthetic minimal cells, Nat. Chem., 2017, 9, 431–439 CrossRef CAS PubMed.
- S. Nichele and A. Molund, Deep learning with cellular automaton-based reservoir computing, 2017 Search PubMed.
| This journal is © The Royal Society of Chemistry 2024 |

