 Open Access Article
Creative Commons Attribution 3.0 Unported Licence
Disorder induced augmentation of the specific capacitance of δ-MnO2 nanoflowers by incorporating Fe3O4 nanodiamonds for supercapacitor electrodes†
Md. Raihan
Siddiki
a,
Shahid Abubakar
Abtahee
ac,
Mizanur
Rahaman
b,
Muhammad Rakibul
Islam
 b and
Md. Abdullah
Zubair
 *a
*a
aDepartment of Nanomaterials and Ceramic Engineering, Bangladesh University of Engineering and Technology, Dhaka, Bangladesh. E-mail: mazubair2017@gmail.com
bDepartment of Physics, Bangladesh University of Engineering and Technology, Dhaka, Bangladesh
cMechanical Engineering and Engineering Science, The University of North Carolina at Charlotte, North Carolina, USA
First published on 7th November 2024
Abstract
In this study, delta manganese dioxide (δ-MnO2) nanoflowers and magnetite (Fe3O4) nanodiamond incorporated δ-MnO2 nanoflowers (δ-MnO2/Fe3O4 nanocomposites) were synthesized via a simple hydrothermal method for electrode materials in supercapacitors. The Fe3O4 content was varied between 0 and 5 wt% to determine the optimized combination of δ-MnO2 and Fe3O4 for the nanocomposite that would exhibit superior electrochemical properties for high-performance energy storage devices. In a three-electrode system, the δ-MnO2/Fe3O4 nanocomposite with 3 wt% Fe3O4 exhibited the highest specific capacitance of 459 F g−1 at a current density of 0.3 A g−1, compared to 76 F g−1 for pure δ-MnO2 nanoflowers and retained about 75% of its initial capacitance after 4000 charge–discharge cycles at a high current density of 6 A g−1. The modulation of the electrochemical performance of the nanostructured composites was evaluated in terms of crystallographic and morphological aspects like interplanar spacing, crystallinity, defect formation and internal surface modification of the nanostructures and electrochemical impedance spectroscopic analysis. This study demonstrates that the optimized δ-MnO2/(3%) Fe3O4 nanocomposite, with its high charge storage capacity and good long-term stability, is a relatively more effective electrode material for high-performance supercapacitors compared to other combinations with different morphologies.
Introduction
Recently, nanostructured metal oxides with transitional properties are considered as favorable options for extensive research for developing energy storage device-electrodes due to their compositional diversities, morphologies, large specific surface area, and high specific capacitance. They play a crucial role in making electrochemical supercapacitors, offering improved capacitance through defects and surface/interface control at the nanoscale. Despite their appreciable characteristics, challenges associated with low electrical conductivity, uncontrollable volume expansion, and slow ion diffusion prevent the metal oxides from reaching their peak potential.1–10 Nevertheless, numerous efforts, including doping, multi-cation formation, introducing porous structures, and compositing, have been made to assist these promising compounds to surpass their constraints, enabling them to thrive and contribute to the optimization sought by researchers.11–20Among the rigorously researched metal oxides for supercapacitor electrodes, MnO2 has garnered significant interest due to its advantages, including natural abundance, low work function (4.4 eV), reversible charge–discharge characteristics, cost-effectiveness, and high specific theoretical capacitance (1370 F g−1).21–26 Several studies have focused on various morphologies of MnO2 nanoparticles, particularly in the context of composite materials.27–35 A favorable component for combining with MnO2 or Mn2O3 is Fe3O4 (magnetite), owing to its outstanding magnetic and surface properties. The presence of different valence states in Fe3O4 enhances electrical conductivity, arising from electron transitions between Fe2+ and Fe3+ cations in the octahedral sites. Typically, composites incorporating Fe3O4 exhibit stability and recyclability; on top of that surface functionalization further contributes to the stability and increased specific surface area of Fe3O4 nanoparticles.36,37
Iron oxide materials also have limitations when used alone, due to their inherently low electrical conductivity and slow ion diffusion kinetics. Numerous iron oxide-based electrodes with varying nanostructures were tried, such as spheres, buttons, microspheres, octahedra, nanowires, etc., and they have demonstrated convincing electrochemical performance. Similar to other nanocomposites, in order to eliminate their individual shortcomings, iron oxides, especially Fe3O4, have been combined with MnO2 for electrochemical applications.38–43 Their combinations were reported to be successful in boosting electrochemical properties. For instance, Zeng and colleagues developed a low-temperature technique for assembling MnO2 nanosheets over Fe2O3 nano-spindles, resulting in improved capacity retention.44 Zhu et al. also achieved a high specific capacitance of 448 F g−1 at 5 mV s−1 using MnO2 microspheres incorporated with Fe3O4 nanoparticles.45 Besides, Sarkar et al. fabricated Fe2O3@MnO2 core@shell nanowire heterostructures with superior supercapacitor performance compared to bare Fe2O3 nanowires.46 Tu et al. synthesized a MnO2@Fe3O4 double hollow nanosphere and formed an asymmetric supercapacitor with activated carbon (AC). It exhibited a specific capacitance of 375.14 F g−1 at 0.5 A g−1.38 Chen et al. produced Yolk@shell structured Fe3O4@MnO2 microspheres, which displayed a capacitance of 715 F g−1 at 1 A g−1. Integrating MnO2 and iron oxide in one structure shows great potential for creating high-performance supercapacitor electrodes. This combination may offer advantages such as increased specific capacitance due to the high redox electroactivity of both materials and a shortened diffusion path, promoting fast and reversible faradaic reactions.47
In this work, diamond shaped Fe3O4 nanoparticles were integrated into birnessite (δ)-MnO2 as a means to enhance the specific capacitance of the latter. δ-MnO2 particles had flower shaped nanostructures, and they were grown with a hierarchical configuration of numerous nano-petals. To the best of our knowledge, no prior work had been conducted where diamond shaped Fe3O4 nanoparticles were incorporated into δ-MnO2 nanoflowers in a hierarchical fashion. In order to investigate the extent of Fe3O4 nano-diamonds in increasing the electrochemical performance of δ-MnO2 nanoflowers, three nanocomposites, i.e., δ-MnO2/(1%) Fe3O4, δ-MnO2/(3%)Fe3O4, and δ-MnO2/(5%) Fe3O4 were synthesized using a facile hydrothermal method. After synthesizing Fe3O4 nano-diamonds, they were added to the precursor solution of δ-MnO2 nanoparticles in different weight percentages (% w/w), to prepare nanostructured composite samples. Then, these nanocomposites and a sample of pure δ-MnO2 nanoflowers were characterized by electrochemical measurements to evaluate the optimized level of Fe3O4 content in terms of the electrochemical performance of the material.
Materials and methods
Materials
For hydrothermal synthesis of δ-MnO2 nanoflowers, potassium permanganate (KMnO4) and manganese sulfate (MnSO4) were used. And for Fe3O4 nanoparticles, iron(III) chloride hexahydrate (FeCl3·6H2O), polyethylene glycol (PEG 8000), and hydrazine 64% (N2H4) were used. All reagents were 98% pure and obtained from Merck, India. The reagents were of analytical grade; therefore, no further purification was needed. Throughout the synthesis processes, deionized (DI) water was employed as solvent.Synthesis of diamond shaped Fe3O4 nanoparticles
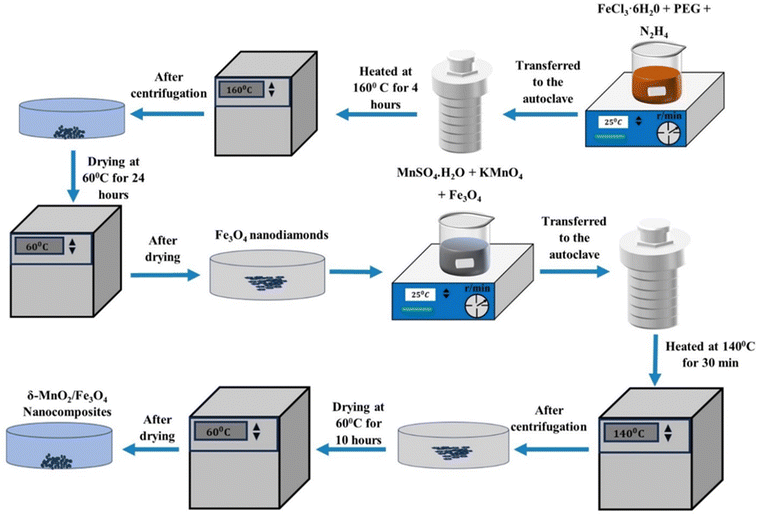
A solution of 80 mL DI-water, 0.028 mol FeCl3·6H2O and 0.0003 mol PEG was prepared by magnetic stirring for around 30 minutes. During the continuous stirring process, 9 mL of N2H4 was added dropwise, resulting in a dark brown solution. It was then immediately transferred to a Teflon-lined autoclave and heated at 160 °C in an oven for 4 hours. After natural cooling, the precipitate was centrifuged with DI-water and ethanol. After drying the precipitate at 60 °C for 24 hours, the final Fe3O4 nanoparticles were obtained.48Synthesis of δ-MnO2 nanoflowers
First of all, 0.00631 mol of MnSO4·H2O was dissolved in 80 mL of DI-water and stirred vigorously to obtain a clear solution. Then, 0.0169 mol KMnO4 was added to the solution while it was continuously stirred for about 15 more minutes. As soon as the solution became homogeneous, it was transferred to a Teflon-lined autoclave and heated in the oven at 140 °C for 30 minutes. The resulting precipitate was collected by centrifuging the suspension and washed with DI-water and ethanol. The final material was obtained after drying the cleaned precipitates at 60 °C for 10 hours.Synthesis of δ-MnO2 nanoflower–Fe3O4 nano-diamond composites
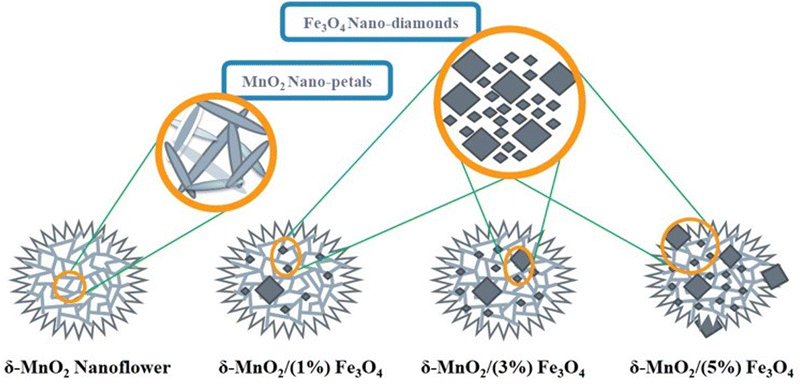
To synthesize δ-MnO2/(1 wt%) Fe3O4, a solution of 80 mL DI-water, 0.00631 mol of MnSO4·H2O and 0.0169 mol KMnO4 was vigorously stirred for 30 minutes. Then, an appropriate amount of previously synthesized Fe3O4 nano-diamonds was added to the solution and sonicated for 30 minutes to make the suspension homogeneous. After that, the suspended solution was immediately transferred to a Teflon-lined autoclave which was then put into the oven at 140° for 30 minutes. The primarily obtained material was separated by centrifuging, washed with ethanol and DI-water several times and dried at 60° for 24 hours to obtain the δ-MnO2/(1 wt%) Fe3O4 nanocomposite. In a similar process, different amounts of Fe3O4, i.e., 3% and 5 wt% were used to obtain δ-MnO2/(3 wt%) Fe3O4 and δ-MnO2/(5 wt%) Fe3O4 nanocomposites, respectively. The synthesis procedure is schematically illustrated in Fig. 1.Fig. 2 illustrates the nanoflowers of pure δ-MnO2 and δ-MnO2/Fe3O4 nanocomposites. MnO2 nanoflowers are formed by numerous nano-petals. In nanocomposites, the MnO2 nanoflowers contain diamond-shaped Fe3O4 nanoparticles possibly buried in them. When the Fe3O4 content is increased to 5%, its nanoparticles protrude from the surface of δ-MnO2 nanoflowers and hamper the growth of δ-MnO2 nano-petals in those regions.
Electrode preparation
To create working electrodes, a slurry of active material was deposited onto a defined area (0.3 cm2) of a glassy carbon electrode. This slurry was prepared by blending the active material (96%) with poly vinyl alcohol (PVA, 4%) and dimethyl sulfoxide, followed by sonication for an hour. After deposition, the working electrodes were dried at 65 °C for several hours. In this process, PVA serves as a binder, as its hydroxyl groups help to form hydrogen bonds between the glassy carbon electrode and the active materials.49,50 Meanwhile, dimethyl sulfoxide is a polar aprotic solvent and capable of dissolving both polar and non-polar compounds.Characterization
For the purpose of crystallographic analysis, the X-ray diffraction (XRD) patterns of the nanoparticles (NPs) were obtained over a 2θ range of 10°–70° using an X-ray diffractometer (PANalytical Empyrean) equipped with a Cu-Kα X-ray source (λCuKα = 1.54278 Å). A silicon zero background holder was used to place the powder samples. The sample surface was accurately aligned with the diffraction plane and the sample was rotated at 60 rpm during diffraction pattern acquisition adopting a reflection-transmission spinner module as the sample stage to maintain a uniform irradiation area both at low and high X-ray incident-angles. The adopted scan speed was 0.041683° per second in continuous scanning mode of operation. Surface morphologies were investigated using a field emission scanning electron microscope (JEOL JSM 7600F). High resolution transmission electron microscopy (HR-TEM) was carried out by using a JEOL JEM 2100 F transmission electron microscope to study the micromorphology of δ-MnO2/Fe3O4 nanocomposites. The material was dispersed into a small amount of ethanol and sonicated for 20 minutes. The sonicated sample was then placed on a carbon-coated 3 mm Cu grid and inserted into the microscope after drying for microstructural analysis. The electrochemical performance of electrodes comprising pure MnO2 nanoflowers and MnO2 nanoflowers with varying proportions of Fe3O4 was examined using a CS310 electrochemical workstation (Corrtest) in a 0.5 M Na2SO4 electrolyte with a three-electrode configuration. The working electrode was a glassy carbon electrode, the reference electrode was Ag/AgCl, and the counter electrode was a platinum plate measuring 1 cm × 1 cm area. The electrochemical measurements were conducted by cyclic voltammetry (CV), galvanostatic charge–discharge (GCD), and electrochemical impedance spectroscopy (EIS) in a 0.5 M Na2SO4 aqueous solution. The potential window for CV and GCD analysis was from −0.2 V to 0.7 V with scan rates of 20, 40, 60, 80 and 100 mV s−1. The EIS measurements were conducted using a sinusoidal bias voltage over a frequency range from 0.1 to 105 Hz.Results and discussion
X-ray diffraction (XRD)
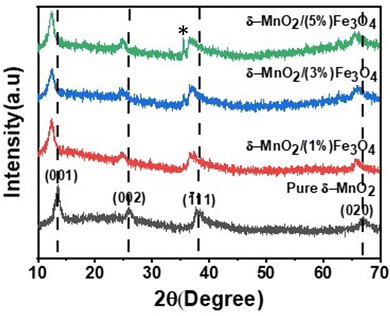
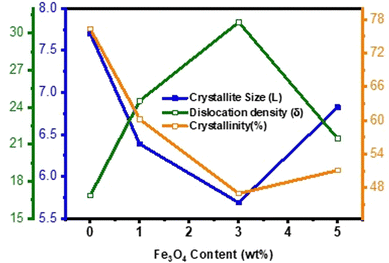
The crystallographic structures of both δ-MnO2 and δ-MnO2/Fe3O4 composites were examined using the X-ray diffraction (XRD) technique. Fig. 3 displays the XRD patterns obtained for δ-MnO2 nanoflower and δ-MnO2/Fe3O4 nanocomposites. The observed XRD peaks for pristine δ-MnO2 nanoflowers correspond to the JCPDS card number 80–1098, with diffraction peaks indexed as (001), (002), (![[1 with combining macron]](https://www.rsc.org/images/entities/char_0031_0304.gif) 11), and (020) reflections.51 The peak marked with asterisks (*) in the nanocomposites corresponds to the (311) plane of diamond Fe3O4 nanoparticles.48 The diffractograms exhibit a notably high noise-to-signal ratio. The weak and diffuse XRD peaks indicate the inferior crystallinity of the synthesized δ-MnO2 nanostructure. However, the most intense peak, denoted as (001), signifies a well-stacked interlayer distance along the c axis, which is a feature that has been documented for other birnessites.52 An additional peak observed in the diffractograms of δ-MnO2/Fe3O4 nanocomposites at a 2θ value of 37° corresponds to Fe3O4 nanodiamonds which is regarded as the reflection with the highest relative intensity in polycrystalline Fe3O4. However, no other peaks of Fe3O4 are evident in the diffraction patterns of the δ-MnO2/Fe3O4 nanocomposites, which can be attributed to a relatively minute amount of Fe3O4 nanodiamonds in the composites. The peak position shifted to lower angles when Fe3O4 nanodiamonds were added to δ-MnO2, as indicated by the dotted line in Fig. 3.53–55 This peak shift may be attributed to uniform strain caused by defects like interstitial incorporation of Fe2+/Fe3+ into the MnO2 lattice possibly leading to a reduction in the average crystallite size, which decreases with the addition of Fe3O4 nanodiamonds, as shown in Fig. 3.56 The possible migration of Fe ions across the δ-MnO2/Fe3O4 interface due to incorporation of Fe3O4 nanodiamonds into δ-MnO2 nanoflowers could cause the following reactions to occur, leading to crystal defect formation:
11), and (020) reflections.51 The peak marked with asterisks (*) in the nanocomposites corresponds to the (311) plane of diamond Fe3O4 nanoparticles.48 The diffractograms exhibit a notably high noise-to-signal ratio. The weak and diffuse XRD peaks indicate the inferior crystallinity of the synthesized δ-MnO2 nanostructure. However, the most intense peak, denoted as (001), signifies a well-stacked interlayer distance along the c axis, which is a feature that has been documented for other birnessites.52 An additional peak observed in the diffractograms of δ-MnO2/Fe3O4 nanocomposites at a 2θ value of 37° corresponds to Fe3O4 nanodiamonds which is regarded as the reflection with the highest relative intensity in polycrystalline Fe3O4. However, no other peaks of Fe3O4 are evident in the diffraction patterns of the δ-MnO2/Fe3O4 nanocomposites, which can be attributed to a relatively minute amount of Fe3O4 nanodiamonds in the composites. The peak position shifted to lower angles when Fe3O4 nanodiamonds were added to δ-MnO2, as indicated by the dotted line in Fig. 3.53–55 This peak shift may be attributed to uniform strain caused by defects like interstitial incorporation of Fe2+/Fe3+ into the MnO2 lattice possibly leading to a reduction in the average crystallite size, which decreases with the addition of Fe3O4 nanodiamonds, as shown in Fig. 3.56 The possible migration of Fe ions across the δ-MnO2/Fe3O4 interface due to incorporation of Fe3O4 nanodiamonds into δ-MnO2 nanoflowers could cause the following reactions to occur, leading to crystal defect formation:
Vacancies:
 | (1) |
 | (2) |
 | (3) |
 | (4) |
 | (5) |
![[triple bond, length as m-dash]](https://www.rsc.org/images/entities/char_e002.gif) 2θ, n is the total number of (hkl) reflection, Θi is the angular dispersion of ith (hkl) reflection in the 2θ scale, Θfull is the full angular range of the diffraction pattern and I(Θ) is the X-ray intensity at an angle Θ. The average crystallite size (L) of the sample was determined from the (001) peak by using the Scherrer formula,58
2θ, n is the total number of (hkl) reflection, Θi is the angular dispersion of ith (hkl) reflection in the 2θ scale, Θfull is the full angular range of the diffraction pattern and I(Θ) is the X-ray intensity at an angle Θ. The average crystallite size (L) of the sample was determined from the (001) peak by using the Scherrer formula,58 | (6) |
 | (7) |
Collectively, these factors favor the enhancement of the surface area of the nanocomposites, introduction of new active sites, and improvement of the intercalation/deintercalation kinetics of the charge carriers during the charging/discharging process.61–64 Nonetheless, among all the samples, δ-MnO2/(3%) Fe3O4 exhibits the lowest crystallite size, poorest crystallinity, highest dislocation density and crystal defects, and the widest interplanar spacing. These are the potential facilitators for enhanced charge transportation and improved electrochemical performance of this nanocomposite.60,65
Scanning electron microscopy (SEM)
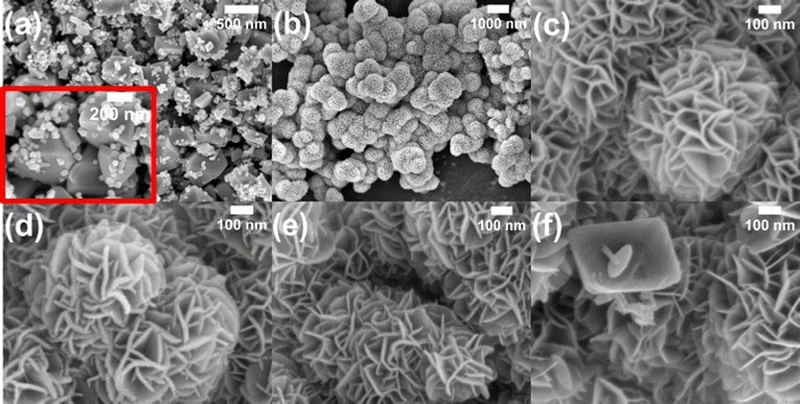
In Fig. 5(a), the FE-SEM micrograph of Fe3O4 nanoparticles is displayed. Due to the resemblance with the diamond shape, these particles of Fe3O4 were addressed as nano-diamonds. The Fe3O4 particles exhibit two distinct size distributions: the small particles (>80% in terms of the particle number) were ∼40–50 nm, whereas the large ones (<20% in terms of the particle number) were ∼300–350 nm. Fig. 5(b) and (c) show the micrographs of pristine δ-MnO2 nanostructured particles at different magnifications. δ-MnO2 particles exhibited a flower-like structure, made of numerous nano-petals. The nano-petals were attached with one another in a hierarchical manner, giving rise to flower-like structures. The hierarchical nanostructure is something where the nanoscale sub-units are aligned in a well-organized manner. Here, the 2D nano-petals aligned with one another to form 3D flower like patterns.66 Nonetheless, in the micrograph in Fig. 5(b), the nanoflowers can be seen to have formed clusters. The average diameter of the nanoflowers is ∼680 nm and the average thickness of the nano-petals is ∼17 nm. In Fig. 5(d), the micrograph of the δ-MnO2/(1%) Fe3O4 nanocomposite is shown. Since the % (w/w) of Fe3O4 is very little, it appears that this micrograph is quite similar to that of the pristine δ-MnO2 nanoflowers. However, the average thickness of the nano-petals slightly increased to ∼18 nm. The micrograph of δ-MnO2/(3%) Fe3O4 is shown in Fig. 5(e), where δ-MnO2 nanoflowers are retained without any visible distortion despite the increase in the amount of Fe3O4 nano-diamonds. It appears that the Fe3O4 nano-diamonds took positions in between the nano-petals of δ-MnO2 nanoflowers. However, the average thickness of nano-petals decreased by ∼3 nm up to 3% Fe3O4. Upon further increase in the wt% of the Fe3O4 nano-diamonds, some of their larger particles protrude from the surface of the δ-MnO2 nanoflowers, as evident in Fig. 5(f). This bulging out of the Fe3O4 nano-diamonds from the interior of the δ-MnO2 nanoflowers hampers the growth of nano-petals, causing some visible distortions in the surface regions. Furthermore, their average thickness reduces to ∼13 nm.Besides, the Mn/O atom % ratio obtained from the semiquantitative EDX spectra in Fig. SF1 (ESI†) clearly exhibits a variation with the addition of diamond shaped Fe3O4 as shown in Fig. SF2 (ESI†). The ratio is ∼0.5 in MnO2 as shown in Fig. SF2 (ESI†), indicating the stoichiometric proportion of Mn and O in this compound. However, the MnO2/(3%) Fe3O4 nanocomposite shows the highest ratio of ∼1.04 among all nanocomposites. The value of the ratio above 0.5 suggests a deviation from the typical oxygen stoichiometric composition of MnO2, indicating a relative oxygen deficiency. This deficiency is accommodated by the formation of oxygen vacancies within the matrix lattice, which indicates the dominance of anionic defects in the crystal structure.67
Transmission electron microscopy (TEM)
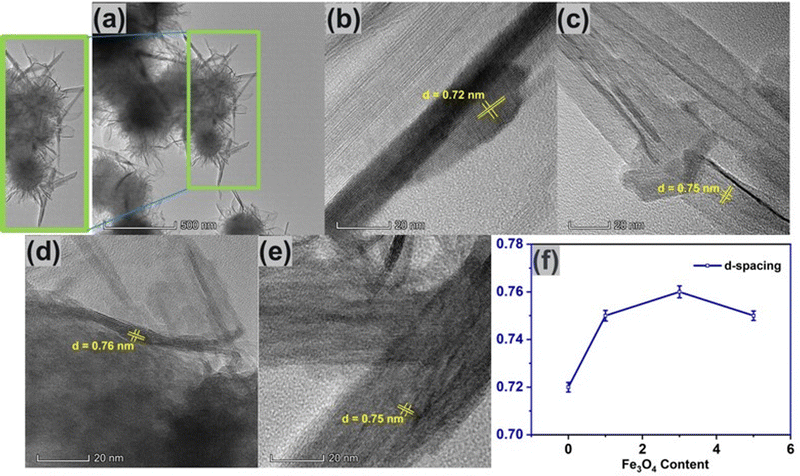
Fig. 6(a) shows the TEM image of pure δ-MnO2 nanoflowers. These nanoflowers are made up of an assembly of numerous nano-petals, which stack with one another, growing from a central region to radially outward direction in a hierarchical manner. As in the inset of Fig. 6(a), petal like nanostructures seem to originate from a nanoflower core.68 Besides, the nano-petals were observed to overlap each other due to their nanosized thickness.69,70Fig. 6(b) shows the lattice fringes of δ-MnO2 nanopetals having a lattice spacing of 0.72 nm which corresponds to the (001) plane of the monoclinic phase, in accordance with JCPDS card: 80–1098.51Fig. 6(c)–(e) shows the HRTEM images of δ-MnO2/Fe3O4 nanocomposites and from the HRTEM image the lattice spacing corresponding to the (001) planes of δ-MnO2 are found to be 0.75 nm, 0.76 nm, and 0.75 nm for 1%, 3%, and 5% of Fe3O4, respectively indicating that incorporation of Fe3O4 nanoparticles suddenly increases the lattice spacing of the composite as shown in Fig. 6(f). This widening of the lattice spacing can be attributed to the generation of defects in the δ-MnO2 crystal structure due to the incorporation of Fe3O4 as mentioned before. These defects shorten the path of electrolyte ions by providing accessible storage sites. Additionally, the increased interlayer spacing may prevent the collapse of the crystallographic layers during rapid charge–discharge operations.71 The porous surface of the hydrothermally produced δ-MnO2/Fe3O4 nanocomposite, along with its broad interlayer spacing and increased specific surface area, may contribute to enhanced capacitance.72Electrochemical performance analysis
Cyclic voltammetry (CV)
To investigate the charge storage mechanism of pure δ-MnO2 and Fe3O4 nanodiamond incorporated δ-MnO2, cyclic voltammetry (CV) was conducted. Fig. 7(a) displays the CV curves of all the nanocomposites at a specific scan rate of 60 mV s−1. Fig. 7(b) shows the graphical trend of the area calculated from the CV loops of Fig. 7(a). It is observed that the inclusion of Fe3O4 nano-diamonds increased the area of CV curves, with δ-MnO2/(3%) Fe3O4 nanocomposite exhibiting the largest area. Therefore, the incorporation of Fe3O4 nano-diamonds can be attributed for the improvement of specific capacitance of δ-MnO2 nanoflowers.73 However, when the Fe3O4 nano-diamond content is increased to 5%, the area of the cyclic voltammetry (CV) curve decreases, causing a possible reduction in specific capacitance of δ-MnO2. As it has been shown that at high Fe3O4 content (∼5%), some of the Fe3O4 nano-diamonds protrude the surface of δ-MnO2 nanoflowers (Fig. 5(f)), hampering nano-petal formations in those regions. This could adversely affect the surface area of δ-MnO2 nanoflowers and in turn, its specific capacitance.Since the δ-MnO2/(3%) Fe3O4 nanocomposite exhibited the best performance, further CV measurement was conducted on this sample at different scan rates as depicted in Fig. 7(c). The quasi-rectangular shape of the CV curves, irrespective of scan rate suggests that both of electric double-layer capacitance (EDLC) effect and pseudocapacitance mechanism are possibly active for charge storage process.74 Pseudocapacitance could arise through processes including underpotential deposition, intercalation and surface redox reactions. In the underpotential deposition mechanism, alkali cations are adsorbed onto or desorbed from the electrode/electrolyte interface, via a surface process, such as:
 | (8) |
The second mechanism involves the intercalation or extraction of alkali cations (Na+) from the electrolyte into the bulk of the δ-MnO2 nanostructure. SEM images in Fig. 5 exhibit that the surfaces of pure δ-MnO2 nanoflowers and δ-MnO2/Fe3O4 nanocomposites possess a nanoporous structure which is suitable to facilitate the intercalation process of Na+ ions by increasing specific surface area for intercalation to take place.76–79 The intercalation process can be shown by following equation:
 | (9) |
 | (10) |
 | (11) |
Galvanostatic charge–discharge (GCD)
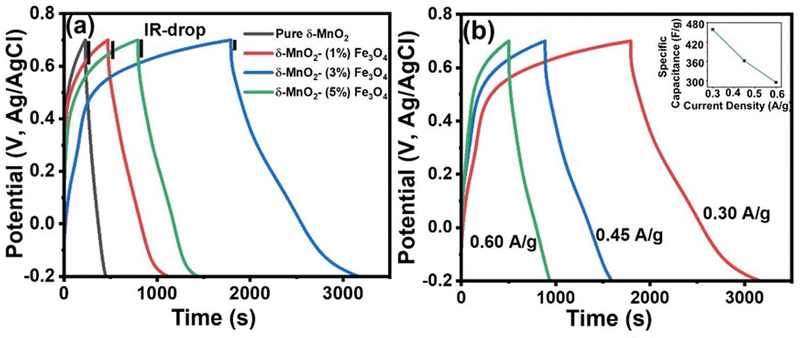
The supercapacitive characteristics of the material can also be assessed from galvanostatic charging–discharging (GCD) profiles. GCD curves offer better quantitative insights compared to CV curves of the materials, as galvanic charging–discharging process closely resembles the real-world applications. Fig. 8(a) displays the GCD curve of all samples at a specific current density of 0.3 A g−1 within a potential window of −0.2 to 0.7 V. The deviation of the GCD curve from the typical symmetrical triangular shape indicates the presence of a pseudocapacitive charge storage mechanism.84 The pseudocapacitive behavior arises from the intercalation of Na+ ions from the electrolyte onto the nanopetals of the nanoporous structured δ-MnO2 nanoflowers, as explained by eqn (10) and (11). As mentioned before, the SEM images in Fig. 5 indicate the presence of a nanoporous surface structure of δ-MnO2 nanoflowers and the δ-MnO2/Fe3O4 nanocomposites. Such morphology favors the intercalation of Na+ ions deep into the electrode material by enhancing the specific area for intercalation process to inititate.85Fig. 8(b) illustrates the GCD curve of the δ-MnO2/3% Fe3O4 nanocomposite at various current densities. It can be observed that the specific capacitance obtained from the GCD curves of the nanocomposite decreased with increasing current density (inset of Fig. 8(b)). Such a trend in specific capacitance is a common phenomenon, where at low current densities, electrolyte ions diffuse efficiently to all active sites of the electrode, facilitating complete insertion/extraction process and resulting in superior capacitance.85 On the other hand, at higher current densities, ionic diffusion is predominantly restricted to the near-surface regions of the electrode, leading to lower capacitance due to relatively reduced charge transportation time.86
Fig. 9 shows the variation in specific capacitance, and discharge time of δ-MnO2 and δ-MnO2/Fe3O4 composites at a current density of 0.30 A g−1. The specific capacitance (Csp) was estimated from the GCD curves using the formula:87
 | (12) |
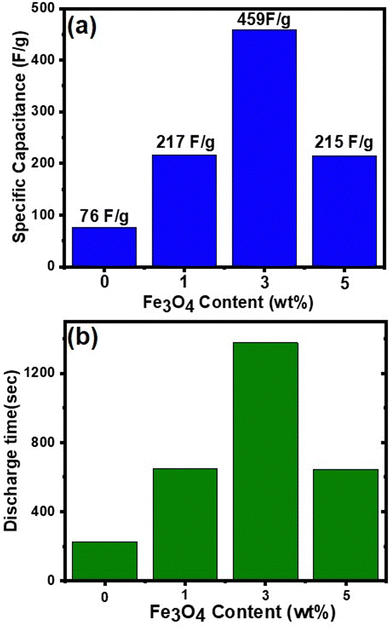 | ||
| Fig. 9 (a) Specific capacitance of the samples as a function of Fe3O4 content, the δ-MnO2/(3%) Fe3O4 nanocomposite shows the highest specific capacitance; (b) discharge time of the samples as a function of Fe3O4 content, obtained from the GCD curves in Fig. 8(a). | ||
Electrochemical impedance spectroscopy (EIS)
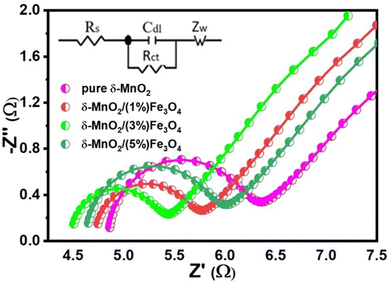
The effect of conductivity and internal resistance on the trend of specific capacitance of the nanocomposites can be further supported by means of electrochemical impedance spectroscopic (EIS) analysis. The EIS measurement was performed to evaluate the resistive behavior and to understand the underlying mechanism of charge transfer of the pure δ-MnO2 and the composite electrodes. Fig. 10 shows the fitted Nyquist plots of all prepared samples. The different regions provided by the Nyquist plot for the supercapacitor explain the charge-transfer-limited processes and the diffusion-limited processes. Conventionally, the so-called knee frequency can be used to separate the Nyquist plot into a high frequency semicircle and a low-frequency inclined line, as illustrated in Fig. 10. At the beginning of the half-circle, the non-zero intersection of the Nyquist plot with the real impedance axis gives the equivalent series resistance (Rs), which is a combination of interfacial resistance between the electrode and the current collector, the bulk resistance of the electrode, the internal resistance of the electroactive materials and the intrinsic ionic electrolyte resistance.92 The double layer capacitance (Cdl) at the electrode/electrolyte interface and the charge transfer resistance (Rct) are presented by the semicircle in the high-to-medium frequency range. And the inclined straight line (angled to the Z′-axis of the Nyquist plot) corresponds to the mass transfer resistance (Warburg impedance, Zw). An equivalent impedance circuit (inset of Fig. 10) was formed to simulate the corresponding EIS spectra via Z View software to evaluate the different electrical components responsible for the observed electrochemical properties of the samples. Based on the proposed fitting circuit exhibited in inset of Fig. 10, the pure δ-MnO2 electrode can be found to have the highest value of Rs (4.85 Ω) as shown in Table 1 and δ-MnO2/(3%) Fe3O4 exhibits the lowest Rs value, possibly suggesting that the composite has a low contact resistance at the interface between the active material and the current collector and this contributes to rapid ion diffusion.93 Additionally, the low Rs value also indicates a low internal resistance in δ-MnO2/(3%)Fe3O4, which is supported by a relatively smaller IR drop observed in its GCD curve as shown in Fig. 8(a).94 These EIS results also agree well with the CV results. The diameter of the semicircle is related to the charge transfer resistance, Rct at the electrode–electrolyte interface. δ-MnO2/(3%)Fe3O4 nanocomposite possesses the smallest diameter of the semicircle, indicating that δ-MnO2/(3%)Fe3O4 has the lowest Rct (0.87 Ω), as compared to δ-MnO2, δ-MnO2/(1%)Fe3O4 and δ-MnO2/(5%)Fe3O4 as shown in Table 1. The insertion of Fe3O4 nanodiamonds into δ-MnO2 nanoflowers could have a synergistic effect, increasing the effective surface area and defect states of the nanocomposites, facilitating a greater charge transfer rate at the electrode–electrolyte interface compared to pure δ-MnO2.95 The lowest Rct, δ-MnO2/(3%) Fe3O4 indicates that 3% Fe3O4 nanodiamond content optimizes the interface charge (electronic/ionic) transportation process. Nonetheless, further increase in the Fe3O4 content could essentially impedes the growth of nanopetals in those areas where Fe3O4 nanodiamonds protrude from the surface of δ-MnO2 nano flowers. This reduces the effective surface area and hence, the surface redox reaction sites hampering the Na+ intercalation process, partly overshadowing the benefits gained from the reduced charge transfer resistance.| Electrode | R s (Ω) | R ct (Ω) | Z w (Ω) |
|---|---|---|---|
| Pure δ-MnO2 | 4.85 | 1.35 | 12.3 |
| δ-MnO2/(1%) Fe3O4 | 4.72 | 0.95 | 9.7 |
| δ-MnO2/(3%) Fe3O4 | 4.48 | 0.87 | 6.9 |
| δ-MnO2/(5%) Fe3O4 | 4.63 | 1.25 | 8.4 |
All electrodes in the Nyquist plot exhibit a slope between 45° and 90° in the low-frequency range, indicating that the electrodes were operating with both capacitive and diffusion-controlled characteristics.45 As the δ-MnO2/(3%)Fe3O4 nanocomposite electrode exhibits a smaller slope and a lower Zw value (6.9 Ω) than the remaining electrodes, as evident from the Warburg impedance values in Table 1, it could be a deemed to have superior ion diffusion rate capability than the other samples. Therefore, all of these results point towards the δ-MnO2/(3%)Fe3O4 nanocomposite electrode having a faster charge transportation capability than others. Thus, the δ-MnO2/(3%)Fe3O4 nanocomposite electrode exhibited the highest specific capacitance. The results from EIS agree well with those from CV and GCD analysis, clearly suggesting that the electrodes of the nanostructured composite materials have lower resistance compared to pure δ-MnO2 nanoflower for charges to move between the electrolyte and electrode.
Cyclic stability
Long-term cyclic stability is as important as specific capacitance for any supercapacitor-based device. In this study, the δ-MnO2/(3%) Fe3O4 nanocomposite exhibited the highest specific capacitance among all samples. Therefore, it was subjected to repetitive GCD measurements to evaluate capacitance retention and coulombic efficiency over 4000 cycles, as shown in Fig. 11. The capacitance retention and coulombic efficiency were calculated by using the following equations:96,97 | (13) |
 | (14) |
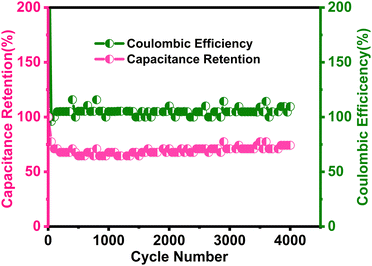 | ||
| Fig. 11 Long term cyclic stability performance as capacitive retention and Coulombic efficiency of the δ-MnO2/(3%) Fe3O4 nanocomposite sample at 6 A g−1 current density over 4000 cycles of operation. | ||
The results in Fig. 11 indicate a 75% retention of the initial capacitance after 4000 charge/discharge cycles. Initially, cyclic retention decreased to around 63% within the first few hundred cycles but began to increase after 750 cycles, eventually stabilizing at 75% retention after 4000 cycles. Generally, a rise in capacitance in the composite could stem from the activation of active sites within the material after certain number of cycles.98,99 Once activated, the electrochemically active materials become fully exposed to the electrolyte,100 facilitated by improved wettability of the electrode surface over time, which is expected to enhance electrolyte diffusion.101,102 These improvements are likely to contribute to the observed increase in capacitance throughout cycling. Additionally, the interaction with Na+ ions may generate numerous defective or disordered sites, increasing the electrode's charge storage capacity over time by enhancing the effective interaction surface area.103 Moreover, as seen in the SEM micrographs in Fig. 5, the flower-like morphology of δ-MnO2 and its mesoporous features are proposed to contribute to the electro-activation process.104
Besides, the introduction of oxygen vacancies confirmed by EDX analysis as shown in Fig. SF2 (ESI†) can lead to the formation of more nano-porous surface features. This provides more active sites for electrochemical reactions, thus enhancing the capacitance retention by improving the utilization of the electrode material. Oxygen vacancies in MnO2 also create localized states in the band gap, which could enhance electronic conductivity.105 These anionic vacancies could also facilitate the ionic transportation phenomenon which is essential for high-rate performance in supercapacitors. Additionally, the presence of oxygen vacancies can enhance redox reactions by providing additional sites for ion insertion and extraction. This improves overall electrochemical performance and contributes to better capacitance retention.105,106
During cycling, electrochemical reactions involving intercalations and surface redox processes can perforate the material's surface, thereby exposing new active sites to the electrolyte. Particularly, when electrolyte ions like Na+ and SO42-intercalate the surface of the δ-MnO2/(3%) Fe3O4 nanopetals and engage in surface redox reactions, they abrade this surface. This abrasion can expose additional material from the interior, thereby increasing the reaction site and thus the reaction rate. This can potentially reduce the internal resistance of the electrode, enhancing the electrical conductivity and enable greater charge conduction at the electrode–electrolyte interface.107 Apart from the electrochemical activation of new active materials, a reduction in agglomeration during cycling along with electrode–electrolyte interface modification could also contribute to the decrement in internal resistance.108,109 In Fig. 11, initially, the coulombic efficiency was around 96%, which increased to 113% after 4000 cycles, indicating the superior stability of the δ-MnO2/(3%) Fe3O4 composite. Therefore, the observed cycling stability and high efficiency together may have arisen from sustained structural integrity of the electrode, enhanced ionic diffusion within the pores, and improved material wettability over time.101,102 Overall, the nanocomposite demonstrates favorable morphological and structural characteristics, contributing to its electrochemical stability as observed from the analyses.
Fig. SF3 (ESI†) shows the Comparison between the previously reported MnO2/Fe3O4 based works and our work. Here, it clearly shows that most of the MnO2/Fe3O4 based composite electrode materials at high current densities of 5–6 A g−1 exhibit either similar or lower % capacity retention after 4000 cycles than ours. Therefore, in terms of cyclic stability, δ-MnO2/(3%) Fe3O4 exhibits a reasonably good value when compared with other recently published works.
Now Table 2 presents some statistical data for various δ-MnO2-based electrodes with different morphological and structural characteristics. Among these materials, the δ-MnO2/(3%) Fe3O4 nanocomposite prepared in this study, with 3% diamond-shaped Fe3O4 nanoparticles incorporated in δ-MnO2 nanoflowers, shows the highest specific capacitance. This indicates superior capacitive performance, suggesting that the δ-MnO2/(3%)Fe3O4 nanocomposite electrode can be used in high-performance supercapacitors.
| Electrode | Electrolyte | Specific capacitance (F g−1) | Ref. |
|---|---|---|---|
| Fe3O4/MnO2/RGOs | 1 M Na2SO4 | 77.5 F g−1 at 0.5 A g−1 | 110 |
| Core–Shell Fe3O4 @C@MnO2 | 1 M Na2SO4 | 158 F g−1 at 0.5 A g−1 | 111 |
| CoMCNFs@MnO2 | 1 M Na2SO4 | 265 F g−1 at 0.5 A g−1 | 112 |
| MnO2/MXene (nanosheets) | 1 M Na2SO4 | 340 F g−1 at 1 A g−1 | 113 |
| rGO/CNT/MnO2 | 1 M Na2SO4 | 319 F g−1 at 0.5 A g−1 | 114 |
| MnO2 nanospheres/carbon nanoparticles/graphene | 1 M Na2SO4 | 255 F g−1 at 0.5 A g−1 | 115 |
| MnO2/PPy/rGO | 1 M Na2SO4 | 404 F g−1 at 0.25 A g−1 | 116 |
| CNFs/MnO2 | 0.5 M Na2SO4 | 365 F g−1 at 1 A g−1 | 117 |
| δ-MnO2/(3%) Fe3O4 | 0.5 M Na2SO4 | 459 F g−1 at 0.3 A g−1 | This work |
Conclusion
This study investigated the effects of compositing δ-MnO2 nanoflowers with diamond shaped Fe3O4 nanoparticles on electrochemical performances and optimized the combination of the two nanomaterials that would exhibit the best performance. Here, all samples were synthesized via a facile hydrothermal route. The diffraction analysis indicated successful synthesis of the desired nanoparticles, with clear differences in lattice parameters of pristine δ-MnO2 and δ-MnO2/Fe3O4 nanocomposites. Introducing Fe3O4 nanodiamonds into pure δ-MnO2 nanoflowers resulted in reduced crystallinity of the nanocomposites. SEM micrographs also exhibited distinct morphological characteristics arising from incorporation of Fe3O4 nanodiamonds into pristine δ-MnO2 nanoflowers. The d-spacing as well as the effective surface area of the pure δ-MnO2 increased with incorporation of Fe3O4 nanodiamonds. However, all the morphological, compositional and structural characterization data exhibited the potential for MnO2/(3%)Fe3O4 nanocomposite to show superior electrochemical performance among all the prepared samples. In the three-electrode system, MnO2/(3%)Fe3O4 nanocomposite electrode exhibited the highest specific capacitance of 459 F g−1 at 0.3 A g−1 together with excellent cyclic stability with a capacitive retention of 75% after 4000 cycles of operation. Thus, the incorporation of Fe3O4 nanodiamonds enhanced the electrochemical performance of δ-MnO2 nanoflowers. The defect rich structure resulting from the introduction of Fe3O4 nanodiamonds into pure δ-MnO2 gave rise to additional active sites in the material, allowing more electrolyte ions to utilize the outer surface and deeper pores. Moreover, the increase in interlayer spacing also opened up regions within the material to be penetrated by the ions. Hence, the structural and morphological modifications enhanced the interaction between the electrode and the electrolyte possibly enhancing the underpotential deposition, intercalation and surface redox reactions that are responsible for the improved pseudocapacitive behavior of the δ-MnO2/Fe3O4 nanocomposite. Nonetheless, the performance enhancement peaked at 3 wt% Fe3O4 nanodiamond content, beyond which, the excess Fe3O4 nanodiamonds started protruding the surface of δ-MnO2 nanoflowers, prohibiting substantial growth of nano-petals in those regions adversely affecting surface area and interlayer spacing. As a result, the MnO2/(3%) Fe3O4 nanocomposite came out to be the optimized combination exhibiting superior performance than many other similar nanocomposites mentioned in the literature in terms of specific capacitance, which makes it a suitable candidate for high performance supercapacitor application.Author contributions
Md. Raihan Siddiki: conceptualization, methodology, investigation, formal analysis, writing – original draft. Shahid Abubakar Abtahee: conceptualization, methodology, investigation, formal analysis, writing – original draft. Mizanur Rahaman: investigation, formal analysis. Muhammad Rakibul Islam: investigation, formal analysis. Md. Abdullah Zubair: supervision, conceptualization, methodology, investigation. Writing – review & editing.Data availability
All necessary data are available within this article.Conflicts of interest
There are no conflicts to declare.Acknowledgements
The authors convey their gratitude to the Department of Nanomaterials and Ceramic Engineering and the Department of Physics, BUET, for their support in synthesis and characterization of the materials. We also acknowledge the Committee for Advanced Studies and Research (CASR), BUET, for financial support.References
- C. An, Y. Zhang, H. Guo and Y. Wang, Nanoscale Adv., 2019, 1, 4644–4658 RSC.
- G. Yu, L. Hu, N. Liu, H. Wang, M. Vosgueritchian, Y. Yang, Y. Cui and Z. Bao, Nano Lett., 2011, 11, 4438–4442 CrossRef CAS PubMed.
- Q. Lu, J. G. Chen and J. Q. Xiao, Angew. Chem., Int. Ed., 2013, 52, 1882–1889 CrossRef CAS PubMed.
- Z. Yu, L. Tetard, L. Zhai and J. Thomas, Energy Environ. Sci., 2015, 8, 702–730 RSC.
- X. Lu, C. Wang, F. Favier and N. Pinna, Adv. Energy Mater., 2017, 7, 1601301 CrossRef.
- Y. Xu, X. Wang, C. An, Y. Wang, L. Jiao and H. Yuan, J. Mater. Chem. A, 2014, 2, 16480–16488 RSC.
- H. Gao, Y. Li, H. Zhao, J. Xiang and Y. Cao, Electrochim. Acta, 2018, 262, 241–251 CrossRef CAS.
- S. Raj, P. Kar and P. Roy, Chem. Commun., 2018, 54, 12400–12403 RSC.
- C. An, Y. Wang, Y. Huang, Y. Xu, L. Jiao and H. Yuan, Nano Energy, 2014, 10, 125–134 CrossRef CAS.
- G. Wang, L. Zhang and J. Zhang, Chem. Soc. Rev., 2012, 41, 797–828 RSC.
- S. Chen, M. Xue, Y. Li, Y. Pan, L. Zhu and S. Qiu, J. Mater. Chem. A, 2015, 3, 20145–20152 RSC.
- F. Wang, X. Wu, X. Yuan, Z. Liu, Y. Zhang, L. Fu, Y. Zhu, Q. Zhou, Y. Wu and W. Huang, Chem. Soc. Rev., 2017, 46, 6816–6854 RSC.
- R. R. Salunkhe, Y. V. Kaneti and Y. Yamauchi, ACS Nano, 2017, 11, 5293–5308 CrossRef CAS PubMed.
- L. Zhang, D. Shi, T. Liu, M. Jaroniec and J. Yu, Mater. Today, 2019, 25, 35–65 CrossRef CAS.
- Y. Dong, Y. Wang, Y. Xu, C. Chen, Y. Wang, L. Jiao and H. Yuan, Electrochim. Acta, 2017, 225, 39–46 CrossRef CAS.
- X. Xiao, G. Zhang, Y. Xu, H. Zhang, X. Guo, Y. Liu and H. Pang, J. Mater. Chem. A, 2019, 7, 17266–17271 RSC.
- X. Guo, Y.-Z. Zhang, F. Zhang, Q. Li, D. H. Anjum, H. Liang, Y. Liu, C. Liu, H. N. Alshareef and H. Pang, J. Mater. Chem. A, 2019, 7, 15969–15974 RSC.
- J. Ma, X. Guo, Y. Yan, H. Xue and H. Pang, Adv. Sci., 2018, 5, 1700986 CrossRef PubMed.
- X. Li, J. Wei, Q. Li, S. Zheng, Y. Xu, P. Du, C. Chen, J. Zhao, H. Xue, Q. Xu and H. Pang, Adv. Funct. Mater., 2018, 28, 1800886 CrossRef.
- H.-S. Kim, J. B. Cook, H. Lin, J. S. Ko, S. H. Tolbert, V. Ozolins and B. Dunn, Nat. Mater., 2017, 16, 454–460 CrossRef CAS PubMed.
- I. Rabani, A. Younus, S. Patil and Y.-S. Seo, Dalton Trans., 2022, 51, 14190–14200 RSC.
- A. Allagui, A. S. Elwakil, M. E. Fouda and A. G. Radwan, J. Power Sources, 2018, 390, 142–147 CrossRef CAS.
- F. Hekmat, S. Shahrokhian and N. Taghavinia, J. Phys. Chem. C, 2018, 122, 27156–27168 CrossRef CAS.
- Z. Ma, F. Jing, Y. Fan, L. Hou, L. Su, L. Fan and G. Shao, Small, 2019, 15, 1900862 CrossRef PubMed.
- J. Shin, D. Shin, H. Hwang, T. Yeo, S. Park and W. Choi, J. Mater. Chem. A, 2017, 5, 13488–13498 RSC.
- A. Zhang, R. Zhao, L. Hu, R. Yang, S. Yao, S. Wang, Z. Yang and Y. Yan, Adv. Energy Mater., 2021, 11, 2101412 CrossRef CAS.
- Y.-P. Zhu, C. Xia, Y. Lei, N. Singh, U. Schwingenschlögl and H. N. Alshareef, Nano Energy, 2019, 56, 357–364 CrossRef CAS.
- W. Li, J. Shao, Q. Liu, X. Liu, X. Zhou and J. Hu, Electrochim. Acta, 2015, 157, 108–114 CrossRef CAS.
- W. Lu, Y. Li, M. Yang, X. Jiang, Y. Zhang and Y. Xing, ACS Appl. Energy Mater., 2020, 3, 8190–8197 CrossRef CAS.
- K. T. Kubra, R. Sharif, B. Patil, A. Javaid, S. Shahzadi, A. Salman, S. Siddique and G. Ali, J. Alloys Compd., 2020, 815, 152104 CrossRef CAS.
- Z. Luan, Y. Tian, L. Gai, H. Jiang, X. Guo and Y. Yang, J. Alloys Compd., 2017, 729, 9–18 CrossRef CAS.
- B. L. Vijayan, S. G. Krishnan, N. K. M. Zain, M. Harilal, A. Yar, I. I. Misnon, J. O. Dennis, M. M. Yusoff and R. Jose, Chem. Eng. J., 2017, 327, 962–972 CrossRef CAS.
- R. B. Pujari, S. J. Patil, J. Park, A. Shanmugasundaram and D.-W. Lee, J. Power Sources, 2019, 436, 226826 CrossRef CAS.
- A. J. C. Mary, S. S. Shalini, R. Balamurugan, M. P. Harikrishnan and A. C. Bose, New J. Chem., 2020, 44, 11316–11323 RSC.
- C. Zhang, Z. Peng, Y. Chen, H. Chen, B. Zhang, H. Cheng, J. Wang and M. Deng, Electrochim. Acta, 2020, 347, 136246 CrossRef CAS.
- J. Tang, M. Myers, K. A. Bosnick and L. E. Brus, J. Phys. Chem. B, 2003, 107, 7501–7506 CrossRef CAS.
- X. Xue, P. Deng, B. He, Y. Nie, L. Xing, Y. Zhang and Z. L. Wang, Adv. Energy Mater., 2014, 4, 1301329 CrossRef.
- C. Tu, X. Li, C. Lu, Q. Luo, T. Li and M. Zhu, Mater. Chem. Front., 2022, 6, 1938–1947 RSC.
- Y. Liu, P. Li, Y. Wang, J. Liu, Y. Wang, J. Zhang, M. Wu and J. Qiu, J. Alloys Compd., 2017, 695, 2612–2618 CrossRef CAS.
- X. Wang, D. Jiang, C. Jing, X. Liu, K. Li, M. Yu, S. Qi and Y. Zhang, J. Energy Storage, 2020, 30, 101554 CrossRef.
- E. Payami and R. Teimuri-Mofrad, Electrochim. Acta, 2021, 383, 138296 CrossRef CAS.
- N. Wang, G. Ding, X. Yang, L. Zhao and D. He, Mater. Lett., 2019, 255, 126589 CrossRef CAS.
- Y. Wang, S. Rao, P. Mao, F. Zhang, P. Xiao, L. Peng and Q. Zhu, Electrochim. Acta, 2020, 337, 135739 CrossRef CAS.
- C. Zeng, W. Weng, T. Lv and W. Xiao, ACS Appl. Mater. Interfaces, 2018, 10, 30470–30478 CrossRef CAS PubMed.
- J. Zhu, S. Tang, H. Xie, Y. Dai and X. Meng, ACS Appl. Mater. Interfaces, 2014, 6, 17637–17646 CrossRef CAS PubMed.
- D. Sarkar, G. G. Khan, A. K. Singh and K. Mandal, J. Phys. Chem. C, 2013, 117, 15523–15531 CrossRef CAS.
- Q. Chen, W. Wei, J. Tang, J. Lin, S. Li and M. Zhu, Electrochim. Acta, 2019, 317, 628–637 CrossRef CAS.
- N. Torres-Gómez, O. Nava, L. Argueta-Figueroa, R. García-Contreras, A. Baeza-Barrera and A. R. Vilchis-Nestor, J. Nanomater., 2019, 2019, 1–15 CrossRef.
- B.-H. Park and J.-H. Choi, Electrochim. Acta, 2010, 55, 2888–2893 CrossRef CAS.
- H.-K. Park, B.-S. Kong and E.-S. Oh, Electrochem. Commun., 2011, 13, 1051–1053 CrossRef CAS.
- J. M. D. O. Cremonezzi, D. Y. Tiba and S. H. Domingues, SN Appl. Sci., 2020, 2, 1689 CrossRef CAS.
- O. Ghodbane, J.-L. Pascal and F. Favier, ACS Appl. Mater. Interfaces, 2009, 1, 1130–1139 CrossRef CAS PubMed.
- X.-L. Li and Y.-D. Li, J. Phys. Chem. B, 2004, 108, 13893–13900 CrossRef CAS.
- G. Du, Z. Guo, S. Wang, R. Zeng, Z. Chen and H. Liu, Chem. Commun., 2010, 46, 1106–1108 RSC.
- H. Li, K. Yu, X. Lei, B. Guo, H. Fu and Z. Zhu, J. Phys. Chem. C, 2015, 119, 22681–22689 CrossRef CAS.
- M. A. Zubair, T. K. Mouri and M. T. Chowdhury, Phys. Chem. Chem. Phys., 2023, 25, 27628–27653 RSC.
- L. Yan, C. Shen, L. Niu, M. Liu, J. Lin, T. Chen, Y. Gong, C. Li, X. Liu and S. Xu, ChemSusChem, 2019, 12, 3571–3581 CrossRef CAS PubMed.
- V. Radmilovic, H. A. Gasteiger and P. N. Ross, J. Catal., 1995, 154, 98–106 CrossRef CAS.
- K. K. Paul, N. Sreekanth, R. K. Biroju, T. N. Narayanan and P. K. Giri, Sol. Energy Mater. Sol. Cells, 2018, 185, 364–374 CrossRef CAS.
- L. Ma, L. Xu, X. Xu, X. Zhou, J. Luo and L. Zhang, Mater. Sci. Eng., B, 2016, 212, 30–38 CrossRef CAS.
- G. Tang, Y. Wang, W. Chen, H. Tang and C. Li, Mater. Lett., 2013, 100, 15–18 CrossRef CAS.
- R. Zhou, C. Han and X. Wang, J. Power Sources, 2017, 352, 99–110 CrossRef CAS.
- X. Li, L. Zhang, X. Zang, X. Li and H. Zhu, ACS Appl. Mater. Interfaces, 2016, 8, 10866–10873 CrossRef CAS PubMed.
- A. Gigot, M. Fontana, M. Serrapede, M. Castellino, S. Bianco, M. Armandi, B. Bonelli, C. F. Pirri, E. Tresso and P. Rivolo, ACS Appl. Mater. Interfaces, 2016, 8, 32842–32852 CrossRef CAS PubMed.
- A. M. Alsaad, A. A. Ahmad, Q. M. Al-Bataineh, A. A. Bani-Salameh, H. S. Abdullah, I. A. Qattan, Z. M. Albataineh and A. D. Telfah, Materials, 2020, 13, 1737 CrossRef CAS PubMed.
- M. Fang, G. Dong, R. Wei and J. C. Ho, Adv. Energy Mater., 2017, 7, 1700559 CrossRef.
- X. Liang, J. E. Post, B. Lanson, X. Wang, M. Zhu, F. Liu, W. Tan, X. Feng, G. Zhu and X. Zhang, Environ. Sci.: Nano, 2020, 7, 238–249 RSC.
- S. Agarwala, Z. H. Lim, E. Nicholson and G. W. Ho, Nanoscale, 2012, 4, 194–205 RSC.
- B. B. Li, S. Z. Qiao, X. R. Zheng, X. J. Yang, Z. D. Cui, S. L. Zhu, Z. Y. Li and Y. Q. Liang, J. Power Sources, 2015, 284, 68–76 CrossRef CAS.
- D. Wang, Z. Pan, Z. Wu, Z. Wang and Z. Liu, J. Power Sources, 2014, 264, 229–234 CrossRef CAS.
- L. Wang, X. Tan, Q. Zhu, Z. Dong, X. Wu, K. Huang and J. Xu, J. Power Sources, 2022, 518, 230747 CrossRef CAS.
- X. Mao, Y. Zou, F. Xu, L. Sun, H. Chu, H. Zhang, J. Zhang and C. Xiang, ACS Appl. Mater. Interfaces, 2021, 13, 22664–22675 CrossRef CAS PubMed.
- R. Zhou, S. Wei, Y. Liu, N. Gao, G. Wang, J. Lian and Q. Jiang, Sci. Rep., 2019, 9, 3980 CrossRef PubMed.
- G. K. Sharma, B. Ranjan and D. Kaur, Appl. Phys. Lett., 2021, 118, 203901 CrossRef CAS.
- M. R. Siddiki, S. A. Abtahee and M. A. Zubair, in Comprehensive Materials Processing, ed. S. Hashmi, Elsevier, Oxford, 2nd edn, 2024, pp. 340–379 Search PubMed.
- T. Xiong, W. S. V. Lee and J. Xue, ACS Appl. Energy Mater., 2018, acsaem.8b01160 CrossRef.
- B. A. Ali, O. I. Metwalli, A. S. G. Khalil and N. K. Allam, ACS Omega, 2018, 3, 16301–16308 CrossRef CAS PubMed.
- S.-L. Kuo, J.-F. Lee and N.-L. Wu, J. Electrochem. Soc., 2006, 154, A34 CrossRef.
- S. K. Ghosh, ACS Omega, 2020, 5, 25493–25504 CrossRef CAS PubMed.
- Y. Liu, S. P. Jiang and Z. Shao, Mater. Today Adv., 2020, 7, 100072 CrossRef.
- Y. Wang, Z. Shi, Y. Huang, Y. Ma, C. Wang, M. Chen and Y. Chen, J. Phys. Chem. C, 2009, 113, 13103–13107 CrossRef CAS.
- M. Toupin, T. Brousse and D. Bélanger, Chem. Mater., 2002, 14, 3946–3952 CrossRef CAS.
- X.-L. Bai, Y.-L. Gao, Z.-Y. Gao, J.-Y. Ma, X.-L. Tong, H.-B. Sun and J. A. Wang, Appl. Phys. Lett., 2020, 117, 183901 CrossRef CAS.
- M. H. Ahmad, R. B. Alam, A. Ul-Hamid, S. F. U. Farhad and M. R. Islam, J. Energy Storage, 2022, 47, 103551 CrossRef.
- Y. Chen, W. Ma, K. Cai, X. Yang and C. Huang, Electrochim. Acta, 2017, 246, 615–624 CrossRef CAS.
- A. K. Thakur, A. B. Deshmukh, R. B. Choudhary, I. Karbhal, M. Majumder and M. V. Shelke, Mater. Sci. Eng., B, 2017, 223, 24–34 CrossRef CAS.
- S. Zhu, L. Li, J. Liu, H. Wang, T. Wang, Y. Zhang, L. Zhang, R. S. Ruoff and F. Dong, ACS Nano, 2018, 12, 1033–1042 CrossRef CAS PubMed.
- S. Guo, W. Chen, M. Li, J. Wang, F. Liu and J. P. Cheng, Electrochim. Acta, 2018, 271, 498–506 CrossRef CAS.
- J.-H. Lin, Materials, 2018, 11, 263 CrossRef PubMed.
- S. S. Nardekar, K. Krishnamoorthy, P. Pazhamalai, S. Sahoo, V. K. Mariappan and S.-J. Kim, J. Mater. Chem. A, 2020, 8, 13121–13131 RSC.
- M. A. A. Mohd Abdah, N. A. Zubair, N. H. N. Azman and Y. Sulaiman, Mater. Chem. Phys., 2017, 192, 161–169 CrossRef CAS.
- M. Gaire, K. Liang, S. Luo, B. Subedi, S. Adireddy, K. Schroder, S. Farnsworth and D. B. Chrisey, RSC Adv., 2020, 10, 16817–16825 RSC.
- W. Cai, T. Lai, W. Dai and J. Ye, J. Power Sources, 2014, 255, 170–178 CrossRef CAS.
- Y. Liu, D. He, H. Wu, J. Duan and Y. Zhang, Electrochim. Acta, 2015, 164, 154–162 CrossRef CAS.
- P. Si, S. Ding, X.-W. (David) Lou and D.-H. Kim, RSC Adv., 2011, 1, 1271 RSC.
- Y. A. Tarek, R. Shakil, A. H. Reaz, C. K. Roy, H. R. Barai and S. H. Firoz, ACS Omega, 2022, 7, 20145–20154 CrossRef CAS PubMed.
- K. O. Oyedotun, A. A. Mirghni, O. Fasakin, D. J. Tarimo, B. A. Mahmoud and N. Manyala, J. Energy Storage, 2021, 36, 102419 CrossRef.
- C. Zhao, X. Shao, Y. Zhang and X. Qian, ACS Appl. Mater. Interfaces, 2016, 8, 30133–30142 CrossRef CAS PubMed.
- R. Ren, M. S. Faber, R. Dziedzic, Z. Wen, S. Jin, S. Mao and J. Chen, Nanotechnology, 2015, 26, 494001 CrossRef PubMed.
- Z. Gao, J. Wang, Z. Li, W. Yang, B. Wang, M. Hou, Y. He, Q. Liu, T. Mann, P. Yang, M. Zhang and L. Liu, Chem. Mater., 2011, 23, 3509–3516 CrossRef CAS.
- Z. Ling, Z. Wang, M. Zhang, C. Yu, G. Wang, Y. Dong, S. Liu, Y. Wang and J. Qiu, Adv. Funct. Mater., 2016, 26, 111–119 CrossRef CAS.
- K. Xu, S. Li, J. Yang, H. Xu and J. Hu, J. Alloys Compd., 2016, 678, 120–125 CrossRef CAS.
- W. Chen, R. B. Rakhi, Q. Wang, M. N. Hedhili and H. N. Alshareef, Adv. Funct. Mater., 2014, 24, 3130–3143 CrossRef CAS.
- J. Shao, X. Zhou, Q. Liu, R. Zou, W. Li, J. Yang and J. Hu, J. Mater. Chem. A, 2015, 3, 6168–6176 RSC.
- T. Zhai, S. Xie, M. Yu, P. Fang, C. Liang, X. Lu and Y. Tong, Nano Energy, 2014, 8, 255–263 CrossRef CAS.
- L. Zhao, W. Wang, H. Zhao, M. Wang, B. Ge, X. Shao and W. Li, Appl. Surf. Sci., 2019, 491, 24–31 CrossRef CAS.
- M. R. Islam, S. N. S. Pias, R. B. Alam and S. I. Khondaker, Nano Express, 2020, 1, 030013 CrossRef.
- M. R. Islam and S. I. Mollik, Heliyon.
- D. Li, W. Zhou, Q. Zhou, G. Ye, T. Wang, J. Wu, Y. Chang and J. Xu, Nanotechnology, 2017, 28, 395401 CrossRef PubMed.
- J. Li, Y. Chen, Q. Wu and H. Xu, J. Alloys Compd., 2017, 693, 373–380 CrossRef CAS.
- Z. Li, Y. Yao, Y. Zheng, T. Gao, Z. Liu and G. Zhou, J. Electrochem. Soc., 2018, 165, E58 CrossRef CAS.
- X. Sun, T. Xu, J. Bai and C. Li, ACS Appl. Energy Mater., 2019, 2, 8675–8684 CrossRef CAS.
- S. Chen, Y. Xiang, W. Xu and C. Peng, Inorg. Chem. Front., 2019, 6, 199–208 RSC.
- H. Jiang, Y. Dai, Y. Hu, W. Chen and C. Li, ACS Sustainable Chem. Eng., 2014, 2, 70–74 CrossRef CAS.
- Y. Xiong, M. Zhou, H. Chen, L. Feng, Z. Wang, X. Yan and S. Guan, Appl. Surf. Sci., 2015, 357, 1024–1030 CrossRef CAS.
- G. Han, Y. Liu, E. Kan, J. Tang, L. Zhang, H. Wang and W. Tang, RSC Adv., 2014, 4, 9898–9904 RSC.
- J.-G. Wang, Y. Yang, Z.-H. Huang and F. Kang, J. Power Sources, 2013, 224, 86–92 CrossRef CAS.
Footnote |
| † Electronic supplementary information (ESI) available. See DOI: https://doi.org/10.1039/d4ma00880d |
| This journal is © The Royal Society of Chemistry 2024 |

