 Open Access Article
Creative Commons Attribution 3.0 Unported Licence
Arylselanyl motifs in hierarchically structured mesoporous phenolic polymers: efficient adsorption sites for Hg2+ ions†
Vishnu
Selladurai
and
Selvakumar
Karuthapandi
 *
*
Department of Chemistry, School of Advanced Sciences, VIT-AP University, Amaravati 522237, Andhra Pradesh, India. E-mail: selvakumar.k@vitap.ac.in
First published on 13th November 2024
Abstract
Strategic installation of heteroatoms and modulation of porous hierarchy of polymers are significant approaches to obtain high-performance materials for practical applications. This study focuses on the syntheses of selenium-containing porous phenolic resin (Se-PR) using cheap raw materials, phenol and selenium dioxide. Two morphologically distinct polymers, Se-PR 1 and Se-PR 2, were obtained via one-step synthesis using DMF and DMSO, respectively, as solvents. Various material characterization techniques such as thermogravimetry, powder X-ray diffraction, BET analysis, X-ray photoelectron spectroscopy, FT-IR spectroscopy and FE-SEM were used to establish the structure and morphology of the polymers. These studies confirmed that the morphology of the polymers is significantly altered by the solvents. Their in-built porous structure with appropriately placed selenium centers in the form of arylselanyl motifs, allows the polymers to display high binding affinity and fast adsorption kinetics towards Hg2+ ions. The maximum Hg2+ ion uptake capacities for Se-PR 1 and 2 were 625 mg L−1 and 1057 mg L−1, respectively, which highlight the potential of organoselenium polymers as efficient adsorbents for Hg2+ removal from water via soft–soft Lewis acid–base interaction (Hg2+⋯Se) and underscore their promising role in environmental remediation.
1. Introduction
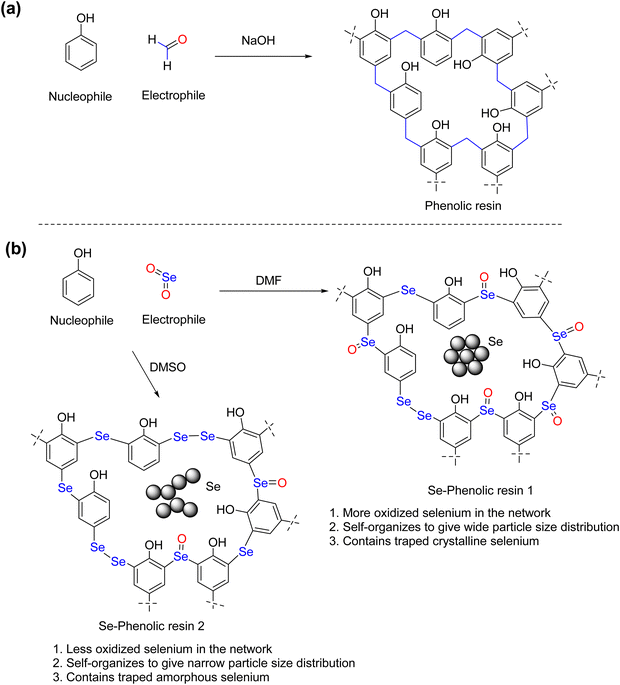
Organoselenium compounds have attracted much interest owing to their intriguing redox and heavy metal complexation properties.1–3 The early developments on molecular organoselenium compounds played a key role in understanding the structure–property relationships of organoselenium compounds. Profound studies and enduring efforts of researchers have opened the door to the design, synthesis and application of organoselenium polymers.4,5 Organoselenium polymers have emerged as high refractive index materials,6,7 stimulus responsive polymers,8 semiconducting polymers,9,10 controlled drug delivery cargoes11 and heavy metal adsorbents.12–14 Owing to their fascinating applications, there is a growing interest towards the development of efficient and cost-effective synthetic methods and scale-up protocols for organoselenium polymers. Routinely adopted polymerization techniques for the synthesis of organoselenium polymers include radical polymerization, condensation polymerization and ring-opening polymerization reactions.15,16 Such processes involve the use of a limited number of reactive starting materials, such as diphenyl diselenide, diphenyl selenide, sodium selenide and related compounds.4 Often one has to rely on the synthesis of organoselenium monomers, which is time-consuming and tedious. In particular, low molecular weight organoselenium monomers are volatile and malodorous,17 necessitating the constant search for a new selenium source, new mechanistic route, and convenient and cost-effective synthetic methods. In this mission, we developed an interest to devise new routes for the synthesis of organoselenium polymers and investigate their applications. Recently, we have succeeded in developing novel oxidative β-hydrogen elimination and subsequent dismutation pathways for n-otylselanyl-substituted copper phthalocyanine, leading to the formation of hierarchically organized metallophthalocyanine–organoselenium polymers that showed efficient electrolytic hydrogen evolution.18 Further, our very recent investigation on the selenation of arylamines revealed that the reaction of selenium dioxide with arylamines led to the competing electrophilic selenation and radical mediated polymerization of arylamines.19 This prompted us to propose an electrophilic selenation process for phenol. Phenol is a cheap and readily available raw material for the synthesis of novolacs and bakelites. A base-catalyzed condensation polymerization reaction involved in the original phenolic resin synthesis is shown in Scheme 1. Phenol acts as a source of nucleophile and formaldehyde acts as a source of an electrophile. It is intuitive to envision that the use of selenium dioxide as an electrophile in place of formaldehyde would lead to the selenium containing phenolic resin, referred to as Se-phenolic resin (Se-PR), in which selenium functions are installed in the place of methyl (–CH2–) cross-links of phenolic resins. However, the reaction between SeO2 and phenol is not as straightforward as one might anticipate. It is expected to follow complex reaction pathways, leading to the incorporation of multiple type of selanyl-motifs, selenoether/selenide (–C–Se–C–), selenoxide (–C–Se(O)–C–) and diselenide (–C–Se–Se–C–) in the Se-phenolic resin. The advantage of the approach is that the incorporation of such arylselenium functions would lead to the expansion of the scope of phenol-derived polymers. These groups are redox active in nature, which can show stimulus-responsive behavior and also selenoether function can be a good coordination site for the heavy metal ions. While polymers containing sulfur as heteroatom donors, alkyl20/aryl thiols,21 thioethers,22 thiophenes,23 thiazoles,24 and dithiocarbamates,25 have been extensively studied for the adsorptive removal of heavy metal ions (i.e., Hg2+), the use of selenium-containing polymers for such applications are rare. Notable examples of selenium-containing polymers that show high affinity of selenium toward Hg2+ ions include nano-selenium-embedded polyurethane sponge,26 polyselenoureas,27 imidazoline-2-selone-tethered polystyrene28 and oligomeric selenium-containing silsesquioxanes.29 Qian et al. recently reported the synthesis of selenium-doped phenolic resin spheres through the reaction of 4,4′-selenodiphenol and resorcinol with formaldehyde,30 and these resin spheres showed ultra-high adsorption capacity towards noble metals such as Pd2+ and Au3+.This work presents a direct synthesis of two Se-phenolic resins (Se-PR 1 and 2) via a one-step reaction of SeO2 and phenol in DMF or DMSO without using any organoselenium precursors. The structural and morphological characterization reveals the role of solvent in the modulation of the porous hierarchy of polymers. The in-built pore structure with appropriately placed selenium centers equips polymers to display a high binding affinity and a fast adsorption kinetics towards Hg2+ ions.
2. Experimental section
2.1. Materials and methods
Phenol, SeO2, mercury nitrate monohydrate and 2-pyridine carboxaldehyde were purchased from SRL Chemicals Ltd. Rhodamine-B was obtained from Sigma-Aldrich. Hydrazine hydrate and dry DMF were purchased from Spectrochem Chemicals Ltd. Dry DMSO and nitric acid 65% reagent grade were bought from Avra Chemicals Ltd. Sodium acetate laboratory grade were bought from SDFCL Chemicals Ltd, India. All reagents and solvents were used in their original state without any further purification. Fourier transform infrared (FT-IR) spectroscopy data were collected using an Agilent Cary 630 KBr module. The 1H NMR spectrum of Rh-B imine was recorded with a Bruker AVANCE II using 500 MHz. The HRMS (ESI)+ spectrum of Rh-B imine was recorded on a Waters-Xevo G2-XS-Q-TOF spectrometer. A Shimadzu-1900 UV-visible spectroscopy instrument was used for adsorption studies. Thermogravimetric analysis (TGA) was carried out using a PerkinElmer STA 8000 under nitrogen flow with a constant heating rate of 10 °C min−1. The powder XRD pattern was obtained on a Rigaku MiniFlex600 with a standard Cu target in a high voltage generator at 40 kV and a beam current of 15 mA. X-ray photoelectron spectroscopy was performed using a PHI-VERSA PROBE III. The morphological studies, elemental mapping, and energy dispersive X-ray spectra (EDAX) of the polymer solid were analyzed using an FEI QUANTA 250 FEG field emission scanning electron microscope (FE-SEM). To conduct surface area analysis (BET), an Autosorb iQ Quantachrome, USA was used at 77 K. Before analysis, all solid polymers were degassed at 120 °C for 3.5 hours and the BJH (Barret-Joyner-Halenda) precision was used to measure the pore size distribution through adsorption isotherm.2.2. Synthesis of Se-PR 1
The synthesis of Se-PR 1 is shown in Scheme 1. In a 100 mL double-necked round bottom flask, 10 mL of DMF, SeO2 (1.66 g, 15 mmol) and phenol (0.94 g, 10 mmol) were added. The reaction mixture was stirred using a magnetic stirrer under nitrogen atmosphere at 130 °C. The consumption of phenol was monitored using thin-layer chromatography (TLC). After 3 hours, the reaction was stopped, and the resulting greenish-yellow solid (1.38 g) was vacuum-filtered using a Buckner funnel. The solid was sequentially treated with ethanol, methanol, and distilled water until the filtrate turned colorless. The solid was filtered and dried in open air. The resulting greenish-yellow solid was designated as Se-PR 1.2.3. Synthesis of Se-PR 2
In a 100 mL double-necked round-bottom flask equipped with a condenser and magnetic stirrer, SeO2 (1.66 g, 15 mmol), phenol (0.94 g, 10 mmol) and DMSO (10 mL) were added. The reaction was carried out under a nitrogen atmosphere at 130 °C, and the progress of the reaction was monitored using TLC until the reactants were nearly consumed. After 6 hours, a brown color solid (3.03 g) was obtained and filtered under vacuum. The resulting solid was then thoroughly, sequentially, washed with ethanol, methanol and distilled water until the filtrate became colorless. The brown solid was separated using a vacuum-assisted Buckner funnel, air dried, and named as Se-PR 2.2.4. Hg2+adsorption studies
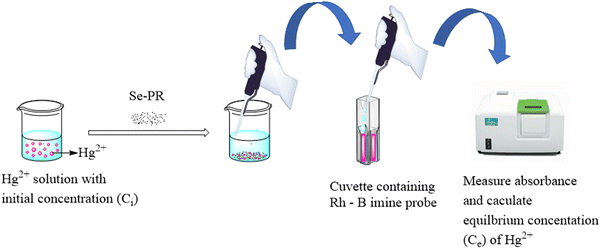
A 10 mM stock solution of mercury(II) nitrate was prepared in 100 mL of distilled water. The pH of solution was maintained at 6.0 using 1 M sodium acetate and 1 M nitric acid. From the stock solution, varying mercury concentrations (ranging from 1 mM to 4.5 mM) were prepared in 10 mL of acetate buffer (pH 6) and added to 10 mg of sorbent material in a 25 mL beaker. The mixture underwent 5 minutes of sonication using an ultrasonicator, followed by centrifugation and filtration, gave the Hg2+ effluents. The colorimetric assay, employing rhodamine-B imine (Rh-B imine) probe synthesized in the laboratory (ESI,† Fig. S1), was used to determine the concentration of Hg2+ ions. To determine the residual mercury content in the effluent, the sample UV-cuvettes was filled with 0.150 mL of Rh-B imine (drawn from a stock solution of 1 mM), 0.025 mL of the effluent, and 2.825 mL of 30% aqueous methanol. The solution was colorless in the absence of Hg2+ ions and after the addition of mercury(II) ions, the Rh-B imine spirolactum ring should be opened, as shown in Scheme 2, and this will make the Hg2+–Rh-B-imine complex, which appears pink. This coordination-induced structural change of the probe allows the quantitative detection of residual Hg2+ ion concentration using Beer–Lambert Law.31,32The equilibrium adsorption percentage and adsorption capacity of Hg2+ ions were calculated using the formula (1) and (2).
 | (1) |
 | (2) |
The Langmuir adsorption isotherm model was applied to get comprehensive insights into the adsorption mechanisms between the polymer and the pollutant. The Langmuir isotherm, expressed in eqn (3), assumes monolayer coverage on a homogeneous surface without adsorbate–adsorbate interactions.
 | (3) |
Furthermore, the adsorption kinetics of Hg2+ was investigated using the pseudo-second-order kinetic model, represented by eqn (4). Here, Qe and Qt denote the maximum adsorption capacities (mg g−1) at equilibrium and time t, respectively.
 | (4) |
3. Results and discussion
3.1. Synthesis
The polymers, Se-PR 1 and Se-PR 2, were synthesized using a one-step conversion of readily available phenol and SeO2, an electrophilic equivalent of formaldehyde used in phenolic resin synthesis. Following the completion of the reaction, the resultant polymers Se-PR 1 and Se-PR 2 were isolated as greenish-yellow and brown solids, respectively. The polymers were insoluble in ethanol, ethyl acetate and THF and sparingly soluble in DMF and DMSO solvents. From the fundamental aspect of mechanistic perspective, the electrophilic selenation at ortho-/para-position of the phenol leads to the formation of hyper cross-linked phenolic resin-type polymer in which arylselanyl-motifs, selenide (–C–Se–C–), diselenide (–C–Se–Se–C–), and selenoxide (–C–Se(O)–C–) bridges act as a chemical equivalent of methylene links (–C–CH2–C–) present in phenolic resins. The formation of selenium-containing monomers from the reaction of SeO2 and phenol quite resembles the Kolbe–Schmitt reaction that involves the reaction of carbon dioxide with alkali salts of phenoxide ions.33 In the present case, the proton (H+) in the phenol plays the role of alkali ion. Due to the large size of the selenium atom, the para substitution must compete with the ortho-substitution.33 The polymerization process begins with the electrophilic addition of SeO2 to phenol, followed by an intramolecular proton migration from phenolic OH to the oxygen atom of Se![[double bond, length as m-dash]](https://www.rsc.org/images/entities/char_e001.gif) O, leading to the formation of an arylseleninic acid intermediate (ESI,† Fig. S2). This intermediate reacts with another phenol molecule to give diaryl dihydroxy selenurane intermediates (ESI,† Fig. S3). The diaryl dihydroxy selenurane decomposes to give diarylselenoxide34 or diarylselenide monomers with –C–Se–C– or –C–Se(O)–C– links, respectively (ESI,† Fig. S4).19 In yet another process, arylseleninic acid reacts with a water molecule, followed by a complex dismutation pathway, leading to form a diaryl diselenide monomer that contains –C–Se–Se–C– links (ESI,† Fig. S5). The above monomers undergo step-growth polymerization with SeO2 to give the selenium-containing phenolic polymer (ESI,† Fig. S6). The solvents used in the polymerization reaction appear to play a crucial role in selenation and subsequent self-organization of the polymer molecules to form hierarchically-structured particulate aggregates.35 DMSO and DMF are aprotic polar solvents with dipole moments (μ) of 3.96 and 3.86 D, respectively.36 The relative permittivity (εr) of DMSO and DMF were 36.7 and 46.7, respectively. The above features, higher dipole moment and relative permittivity of DMSO relative to DMF, enables DMSO not only to efficiently stabilize the dipolar transition states formed during the selenation reaction but also facilitates the greater solvation of the growing oligomeric units and emergent self-organization of the polymer units to yield narrow particle size distribution (vide infra). The major interaction between the solvents and reactants are hydrogen bonding, dipole–dipole and dispersion interaction (ESI,† Fig. S6). These interactions allow polymerization to occur around the solvent core. Both solvents can engage in such interactions and assist the evolution of porous architecture during polymerization.
O, leading to the formation of an arylseleninic acid intermediate (ESI,† Fig. S2). This intermediate reacts with another phenol molecule to give diaryl dihydroxy selenurane intermediates (ESI,† Fig. S3). The diaryl dihydroxy selenurane decomposes to give diarylselenoxide34 or diarylselenide monomers with –C–Se–C– or –C–Se(O)–C– links, respectively (ESI,† Fig. S4).19 In yet another process, arylseleninic acid reacts with a water molecule, followed by a complex dismutation pathway, leading to form a diaryl diselenide monomer that contains –C–Se–Se–C– links (ESI,† Fig. S5). The above monomers undergo step-growth polymerization with SeO2 to give the selenium-containing phenolic polymer (ESI,† Fig. S6). The solvents used in the polymerization reaction appear to play a crucial role in selenation and subsequent self-organization of the polymer molecules to form hierarchically-structured particulate aggregates.35 DMSO and DMF are aprotic polar solvents with dipole moments (μ) of 3.96 and 3.86 D, respectively.36 The relative permittivity (εr) of DMSO and DMF were 36.7 and 46.7, respectively. The above features, higher dipole moment and relative permittivity of DMSO relative to DMF, enables DMSO not only to efficiently stabilize the dipolar transition states formed during the selenation reaction but also facilitates the greater solvation of the growing oligomeric units and emergent self-organization of the polymer units to yield narrow particle size distribution (vide infra). The major interaction between the solvents and reactants are hydrogen bonding, dipole–dipole and dispersion interaction (ESI,† Fig. S6). These interactions allow polymerization to occur around the solvent core. Both solvents can engage in such interactions and assist the evolution of porous architecture during polymerization.
3.2. FT-IR spectroscopy
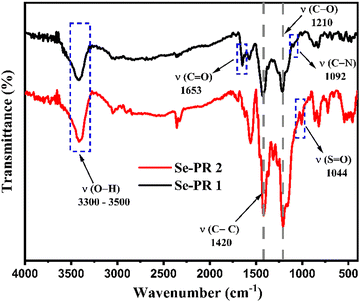
Fig. 1 displays the FT-IR spectra of Se-PR 1 and Se-PR 2. The spectra of both polymers are very similar. The wavenumber range of 3300–3500 cm−1 corresponds to the broad O–H stretching vibration in both polymers, indicative of extensive hydrogen bonding present in the polymers.37 The stretching in the range of 3000–3100 cm−1 is associated with the C–H vibrations of the aromatic rings. The absorption bands at 1420 cm−1 and 1210 cm−1 correspond to the aromatic C![[double bond, length as m-dash]](https://www.rsc.org/images/entities/char_e001.gif) C and C–O stretching vibrations, respectively. The peak at 1092 cm−1 corresponds to the C–N (amide) stretching corresponding to the trapped solvent (i.e., DMF) in Se-PR 1. Similarly, a strong peak at 1044 cm−1 of the FT-IR spectra of Se-PR 2 represents S
C and C–O stretching vibrations, respectively. The peak at 1092 cm−1 corresponds to the C–N (amide) stretching corresponding to the trapped solvent (i.e., DMF) in Se-PR 1. Similarly, a strong peak at 1044 cm−1 of the FT-IR spectra of Se-PR 2 represents S![[double bond, length as m-dash]](https://www.rsc.org/images/entities/char_e001.gif) O stretching vibration of DMSO trapped in the porous network of the polymer.
O stretching vibration of DMSO trapped in the porous network of the polymer.
3.3. X-ray photoelectron spectroscopy studies
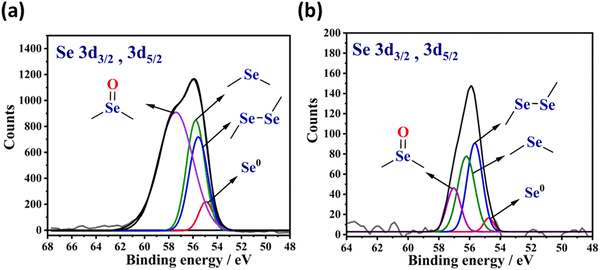
X-ray photoelectron spectroscopy (XPS) is an ideal tool to characterize the types of organoselenium motifs present in the solid-state materials. The Se 3d electron ejection typically corresponds to two components, namely, 3d3/2 and 3d5/2. According to the literature, the binding energy peak for the elemental selenium Se0 is expected at 55.1 eV.38 On the other hand, the binding energy peaks for the low-valent selenium in diaryl diselenide (–C–Se–Se–C–)39 and diaryl monoselenide (–C–Se–C–)30,40 motif are expected to be about 55.8 eV and 56.0 eV, respectively. Similarly, the binding energy peak for the high-valent selenium in the selenoxide (–C–Se(O)–C–) motif is expected at the large binding energy side, usually ∼57.6 eV.18
Fig. 2(a) displays the XPS spectra of Se-PR 1. The peak centered at the binding energy of 55.8 eV, due to the electron ejection from the Se (3d3/2, 3d5/2) states, corresponds to various types of selenium-based linkages. The XPS spectra of Se-PR 2, as shown Fig. 2(b), also has similar peak position, centered at the binding energy of 55.8 eV. The XPS spectrum of the polymers were de-convoluted for the binding energies, 55.1, 55.8, 56.0 and 57.6 eV associated with their corresponding selenium motifs Se0, –C–Se–Se–C–, –C–Se–C and –C–Se(O)–C–, respectively. The area under the peaks of each de-convoluted spectrum reveals the information about the relative content of each selenium type in Se-PR 1 and 2. For Se-PR 1, the relative content of Se0, –C–Se–Se–C–, –C–Se–C– and –C–Se(O)–C–motifs were approximately 3, 13, 14 and 70%, respectively. For Se-PR 2, the relative content of Se0, –C–Se–Se–C–, –C–Se–C– and –C–Se(O)–C– motifs were approximately 4, 40, 38 and 18%, respectively. The formation of nearly equivalent amount of –C–Se–Se–C– and –C–Se–C-motifs is indeed corroborated with the commonly reported yields of diaryl diselenides and monoselenides in the selenation reaction that employs SeO2 as an electrophile. For instance, it has been reported that the selenation reaction of 3,5-dimethyl-1-phenyl-1H-pyrazole using SeO2 as an electrophilic source (in 1![[thin space (1/6-em)]](https://www.rsc.org/images/entities/char_2009.gif) :
:![[thin space (1/6-em)]](https://www.rsc.org/images/entities/char_2009.gif) 1.5 ratio) in DMSO as a solvent provided 1
1.5 ratio) in DMSO as a solvent provided 1![[thin space (1/6-em)]](https://www.rsc.org/images/entities/char_2009.gif) :
:![[thin space (1/6-em)]](https://www.rsc.org/images/entities/char_2009.gif) 1 ratio of di-selenylated bis-pyrazole and mono-selenylated bis-pyrazole derivative.41 Further, XPS data suggests that Se-PR 2 has relatively high content of the low-valent soft selenium motif than in Se-PR 1. Such low-valent soft selenium motif is desirable for the adsorptive removal of soft metal ions.
1 ratio of di-selenylated bis-pyrazole and mono-selenylated bis-pyrazole derivative.41 Further, XPS data suggests that Se-PR 2 has relatively high content of the low-valent soft selenium motif than in Se-PR 1. Such low-valent soft selenium motif is desirable for the adsorptive removal of soft metal ions.
3.4. Powder X-ray diffraction studies
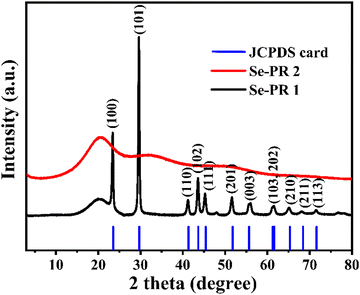
Powder XRD patterns of Se-PR 1 and Se-PR 2 were recorded over a 2θ range of 5–80°, as depicted in Fig. 3. The low-intensity and broad diffraction peak observed at 2θ = 20° for Se-PR 1 suggests the amorphous nature of the polymer. Additionally, crystalline diffraction peaks matching those of pure elemental selenium (JCPDS reference code: 00-042-1425) were identified, indicating the presence of nano-granules of elemental selenium embedded within the polymer structure. The powder XRD pattern of Se-PR 2 exhibited a low-intensity broad diffraction peak at 2θ = 20°, confirming its amorphous state.37 The broad humps at about 2θ = 30 and 40–50° could be due to the presence of amorphous selenium in the polymer matrix.423.5. Thermogravimetric analysis (TGA)
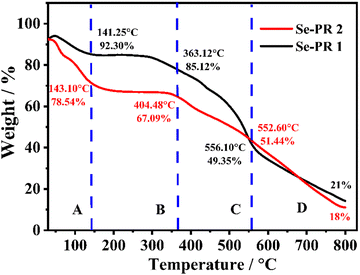
Thermogravimetric (TGA) analysis is a useful tool for understanding the thermal stability of selenium-containing polymers. The weight loss profile of polymers in the range of ambient temperature to 800 °C are shown in Fig. 4. The weight loss pattern of the polymers can be essentially divided into four distinct regions: A, B, C, and D. The region A, with ambient temperature to ∼145 °C, represents the loss of non-covalently bound solvent molecules, essentially the loss of trapped DMF from Se-PR 1 and the loss of DMSO from Se-PR 2. The regime B denotes very interesting feature that Se-PR 1 remains stable up to 300 °C, and the covalent-linkages of both polymers remain intact. Se-PR 2 is substantially stable up to 350 °C without showing any significant weight loss. In the regime C, from ∼360 °C to ∼550 °C, the weak covalent bonds between selenium and carbon (i.e., Se–C bonds) are being broken, which leads to significant mass loss. The regime D, beyond 550 °C, represents essentially the carbonization of the polymers where the strong bonds such as C–H and C–O are broken down. The residual amount of the material, for Se-PR 1 (21%) and Se-PR 2 (18%), obtained at the end of TGA analysis is essentially carbon.433.6. Field emission-scanning electron microscopy studies (FE-SEM)
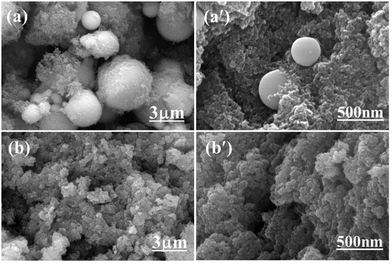
The morphology and elemental composition of Se-PR 1 and 2 were characterized using field emission-scanning electron microscopy (FE-SEM) and energy-dispersive X-ray analysis (EDAX). Fig. 5(a) and (a′) show the FE-SEM micrographs of Se-PR 1 with two different magnifications at 30![[thin space (1/6-em)]](https://www.rsc.org/images/entities/char_2009.gif) 000× and 100
000× and 100![[thin space (1/6-em)]](https://www.rsc.org/images/entities/char_2009.gif) 000×, respectively. At both magnifications, Se-PR 1 showed predominant resin spheres having a high level of heterogeneous particle size ranging from ∼0.1 to 4.0 μM. It shows that the large resin spheres are embedded in a spongy interconnected network with significant porous feature in it. Fig. 5(b) and (b′) represent the FE-SEM micrographs of Se-PR 2 at two different magnifications of 30
000×, respectively. At both magnifications, Se-PR 1 showed predominant resin spheres having a high level of heterogeneous particle size ranging from ∼0.1 to 4.0 μM. It shows that the large resin spheres are embedded in a spongy interconnected network with significant porous feature in it. Fig. 5(b) and (b′) represent the FE-SEM micrographs of Se-PR 2 at two different magnifications of 30![[thin space (1/6-em)]](https://www.rsc.org/images/entities/char_2009.gif) 000× and 100
000× and 100![[thin space (1/6-em)]](https://www.rsc.org/images/entities/char_2009.gif) 000×, respectively. Both images are consistent and reveal that the globular particles of Se-PR 2 are tiny, in the narrow size range of ∼0.1 to 0.3 μM, with relatively lower heterogeneity as compared to Se-PR 1. This is presumably due to the solvents employed in the synthesis. Irrespective of this, in both cases, the globular particles hierarchically assemble to leave apparent porous character in the material. The incorporation of selenium in the polymers was revealed from EDAX and elemental mapping (Fig. S10 and S11, ESI†). The ratio of atomic percent (%) of selenium to carbon for Se-PR 1 was 0.250, whereas this ratio for Se-PR 2 was 0.146. The higher selenium content in Se-PR 1 could be due to the trapping of elemental selenium in the material apart from the –C–Se–C–/–C–Se–Se–C– bonds, which is consistent with the powder XRD data.
000×, respectively. Both images are consistent and reveal that the globular particles of Se-PR 2 are tiny, in the narrow size range of ∼0.1 to 0.3 μM, with relatively lower heterogeneity as compared to Se-PR 1. This is presumably due to the solvents employed in the synthesis. Irrespective of this, in both cases, the globular particles hierarchically assemble to leave apparent porous character in the material. The incorporation of selenium in the polymers was revealed from EDAX and elemental mapping (Fig. S10 and S11, ESI†). The ratio of atomic percent (%) of selenium to carbon for Se-PR 1 was 0.250, whereas this ratio for Se-PR 2 was 0.146. The higher selenium content in Se-PR 1 could be due to the trapping of elemental selenium in the material apart from the –C–Se–C–/–C–Se–Se–C– bonds, which is consistent with the powder XRD data.
3.7. BET surface area analysis
The porous features present in the pristine polymers were further supported from the BET isotherm studies. The BET surface area and nitrogen sorption of both polymers were evaluated at 77 K. Fig. 6 illustrates nitrogen sorption studies and pore size distribution curves. According to the IUPAC classification, the N2 sorption isotherms of both polymers corresponded to type II and type IV.44 The sharp uptake of N2 and the presence of a small H1-type hysteresis loop in both polymers confirm the capillary condensation phenomenon, affirming their mesoporous nature. This characteristic porosity, along with the presence of hysteresis loops in both the polymers, strongly supports their hierarchically-structured nature. The specific surface area of the polymers was calculated using the BET method with the relative pressure (P/P0) range from 0.05–0.3, and the pore volume was determined at a relative pressure of 0.999. The surface area, average pore diameters and pore volumes are listed in Table 1. Se-PR 1 and Se-PR 2 exhibited surface areas of 49.78 m2 g−1 and 16.57 m2 g−1, respectively. This structural attribute promises their ability to chelate and bind Hg2+ ions within the pore walls.45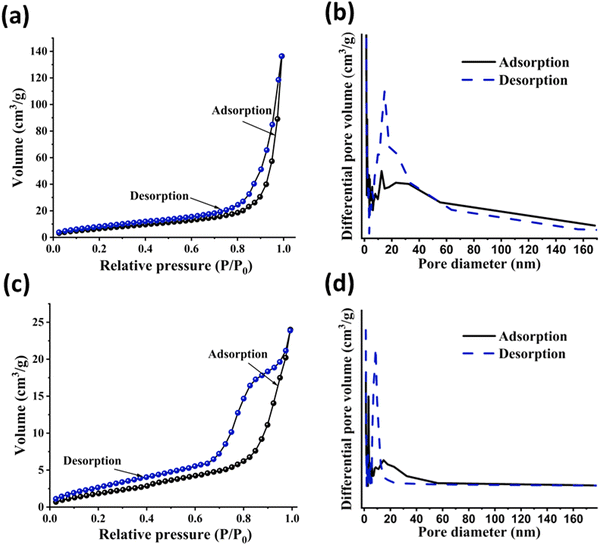 | ||
| Fig. 6 (a) and (b) N2 sorption isotherm and BJH pore size distribution curve of Se-PR 1; (c) and (d) N2 sorption isotherm and BJH pore size distribution curve of Se-PR 2. | ||
| Polymer | BET surface area (m2 g−1) | Total pore volume (cc g−1) | Average ore size (nm) |
|---|---|---|---|
| Se-PR 1 | 49.776 | 0.220 | 1.220 |
| Se-PR 2 | 16.568 | 0.041 | 1.226 |
3.8. Hg2+ adsorption studies
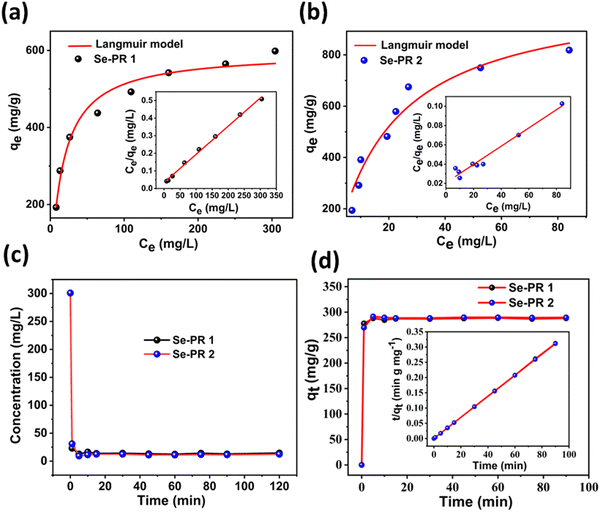
After confirming the porous architectures and selenium incorporation in the polymers, we studied their adsorption capacity towards Hg2+ ions using colorimetry. Among the various spectroscopic methods developed for Hg2+ ion sensing, the colorimetric sensing techniques are the simplest, readily available and convenient. However, for the sensitive detection of Hg2+ ions, one has to depend on the design and synthesis of an organic probe molecule with a receptor and a reporter. The colorimetric probe used in this study for the sensitive detection of Hg2+ ions was Rh-B imine. It was synthesized readily from rhodamine B using very simple components and synthetic steps (ESI,† Fig. S1). The protocol for mercury adsorption and measuring the equilibrium concentration (Ce) of Hg2+ is shown in Fig. 7. The initial concentration of Hg2+ in the solution is referred to as Ci. Adding the adsorbent to the solution and allowing the system to reach equilibrium leads to a reduction in the concentration of Hg2+ ions in the solution. The equilibrium concentration Ce was estimated using UV-visible spectroscopy with the help of a calibration graph.The Langmuir isotherm model, using eqn (2) and (3), was applied to evaluate the binding behaviour of Hg2+ ions to the polymers. Fig. 8(a) and (b) illustrate the isotherms, the plot between qe and Ce, for Se-PR 1 and 2, respectively. Apparently, from the isotherm, the adsorption exhibits a saturation behaviour at a higher concentration of Hg2+ ions. A linear plot drawn between qe/Ce and Ce showed regression coefficients (R2) of 0.9966 and 0.9606 for adsorption studies conducted for Se-PR 1 and 2, respectively. Noteworthily, the regression coefficient calculated from the respective linear plot obtained for Se-PR 1 and 2 using the Freundlich model are 0.9199 and 0.8318, respectively (ESI,† Fig. S12 and Table S1). These findings indicate that the adsorption of Hg2+ on the polymer is highly specific, which follows Langmuir monolayer adsorption isotherm through soft–soft coordination interaction between Hg2+ and the Se centers of the polymers. As shown in Table 2, the maximum uptake capacities determined from the linear plots were 625 mg L−1 and 1057 mg L−1, respectively, for Se-PR 1 and 2.
| Langmuir model | Pseudo second order model | ||||||
|---|---|---|---|---|---|---|---|
| Q max (mg g−1) | K L (L mg−1) | R L | R 2 | q e (mg g−1) | K 2 (g mg−1 min−1) | R 2 | |
| Se-PR 1 | 625 | 0.0471 | 0.0956 | 0.9966 | 288.1844 | 8.41 × 10⁻² | 0.9999 |
| Se-PR 2 | 1057 | 0.0456 | 0.0985 | 0.9606 | 289.0173 | 1.62 × 10⁻¹ | 1.0000 |
Not only adsorption capacities but also fast adsorption kinetics are essential for any practical application. For the kinetic study, a constant dosage of 10 mg of both polymers and aliquots of a 300 mg L−1 Hg2+ solution were used. The aliquots of the effluent were analysed using UV-visible spectroscopy at various time intervals. Fig. 8(c) shows that both polymers have shown fast adsorption kinetic, leading to the point of equilibrium in less than 5 minutes. The equilibrium remains unchanged even after 120 minutes. The adsorption kinetic rate constants of both polymers were evaluated using the pseudo-second-order kinetic model using eqn (4) (Fig. 8(d)), and the kinetic parameters are presented in Table 2. The comparison of pseudo-second order rate constants for the adsorption of Hg2+ on the polymers shows that Se-PR 2 displayed ∼2 times faster adsorption rate than Se-PR 1.
Though Se-PR 2 exhibited high uptake of Hg2+ with fast adsorption kinetics, the effect of pH on the adsorption capacity was studied only for Se-PR 2. Fig. 9(a) illustrates the removal efficiency of Hg2+ ions across various pH solutions. In this study, the initial concentration of Hg2+ was maintained at 1.5 mM (300 mg L−1), with 10 mg of Se-PR 2 and pH of the solution altered from 1 to 7. After mercury adsorption, aliquots were extracted, and the pH was adjusted to 6 for UV-Vis studies, as recommended in the literature due to the Rh-B imine probe's selective operation within the pH range from 5 to 7.46 From Fig. 9(a), one can infer that at lower pH levels (<3), higher concentrations of hydrogen ions decrease the adsorption capacity of Hg2+ ions, resulting in a lower adsorption capacity. The maximum adsorption equilibrium of Hg2+ was achieved at about pH 6. At higher pH levels (>7), the precipitation of mercury ions occurs, potentially forming complexes such as Hg(OH)2.45,47 The polymer exhibits consistent adsorption capability for Hg2+ up to pH 7, making it an effective sorbent material for removing heavy Hg2+ from neutral and slightly acidic solutions.
To show the practical application of the polymer, as shown in Fig. 9(b), Hg2+-contaminated water was passed through Se-PR 2 through a centrifugation filtration column, and the effluent was analysed for the residual Hg2+ ions. Typically, 0.6 mg of the polymer was loaded in a centrifugation column and 0.6 mL (300 mg L−1) of the Hg2+-contaminated solution was poured into the column and sonicated for 5 minutes. The content was subjected to centrifugation for 1 min at 4500 rpm. The effluent was collected and analysed for Hg2+ ion concentration. Nearly 97% of the Hg2+ ions were removed from the contaminated water. The same centrifugation column was used to test the recyclability of the polymer. For recycling, the centrifugation column was washed with 0.6 mL of 1 M HCl and then subsequently washed 5 times with distilled water. Then, the adsorption cycle was continued. The recycling tests, shown in Fig. 9(c), indicate that no significant decline in sorbent material performance occurred, achieving a Hg2+ removal efficiency of 77.9% at the 5th cycle. According to the previous literature, the setup of the spin column reduces the processing time compared to the gravity filtration methods often needed for vacuum suction.25
At this juncture, it is essential to compare the performance of Se-PR 1 and 2 with the related materials reported in the literature.25,48 As detailed in Table 3, both organoselenium polymers show high performance in terms of the adsorption capacity towards Hg2+ adsorption, surpassing other polymers containing different heteroatom functions, thiols, amides and lignin-based sorbents. In particular, Se-PR 2 showed exceptional adsorption capacity, and it showed significantly higher adsorption capacity than the selenium-containing polymer, selenone-functionalized polyhedral oligomeric silsesquioxane (POSS-Se).29
| S. no. | Types of materials | Functional groups | Adsorption capacity (mg g−1) | pH | Ref. |
|---|---|---|---|---|---|
| 1. | Thiol/thioether-functionalized porous organic polymers | Thiol | 180 | 3.5 | 22 |
| 2. | Nano-selenium sponge | Selenium | 324 | 5 | 26 |
| 3. | Polymer particles bearing imidazoline-2-selenones | Selenones | 110 | — | 28 |
| 4. | POSS-Se | Selenone | 952 | — | 29 |
| 5. | MoSe2 nanosheet by heteroatom doping | Selenides and thiols | 208 | 7 | 47 |
| 6. | Chitosan–cellulose–PVA | Amine | 494.6 | 5.5 | 49 |
| 7. | Polyamide magnetic palygorskite | Amide | 211.93 | 5 | 50 |
| 8. | Chitosan poly(vinyl alcohol) hydrogel | Vinyl alcohol | 585 | 5.5 | 51 |
| 9. | Propylthiol-functionalized mesoporous silica | Thiol | 560 | 4.5 | 52 |
| 10. | Cellulose and thiol-based adsorbent | Thiol | 404.95 | 5.6 | 53 |
| 11. | MA-SAPQA@NFs | Thiol | 218 | 5 | 54 |
| 12. | Bifunctional organosilica with sulfide bridges | Thiol | 437 | 5 | 55 |
| 13. | Poly(γ-glutamic acid) | Hydroxyl and amine | 96.79 | 6 | 56 |
| 14. | Chitosan-coated diatomite | Hydroxyl and amines | 116.2 | 5 | 57 |
| 15. | Se-PR 1 | Arylselenides | 625 | 6 | This work |
| 16. | Se-PR 2 | Arylselenides | 1057 | 6 | This work |
3.9. Mechanism of Hg2+ adsorption and structural aspects of the recycled polymer
To gain a molecular level understanding of the binding between Hg2+ and adsorption sites present in the polymers, the FT-IR spectrum of the pristine polymers were compared with the FT-IR spectrum of the respective Hg2+-bound polymers. While the peak shifts of absorption bands are not obvious in both the spectra, the shape of the C–O absorption band (1210 cm−1) of the pristine polymer is significantly different from that of the Hg2+-bound polymer. The C–O absorption band becomes sharp upon coordination of the Hg2+ ions to the polymer (ESI,† Fig. S13 and S14). This could be due to the coordination of the selenium center to the Hg2+ ions that influence the oxygen atom of the phenolic OH to coordinate with Hg2+ ions (Scheme 3(a)). Earlier reports have shown that mercury prefer to form four-coordinate distorted tetrahedral geometry.58–60 The notable examples are the bis(2-(4,4-dimethy-2-oxazoline)phenyl)selenide complex of HgCl2 and the adduct of bis(pentafluorophenyl) mercury(II) with diphenyl diselenide (Scheme 3(b)). Both complexes showed distorted tetrahedral geometry in the solid state. The former, however, in solution, showed the dynamic movement of HgCl2 between the two nitrogens via a five-coordinate intermediate. The latter showed a ladder-type aggregation in the solid state where the diselenide motif acts as the ligand. The similar structural features are possible upon the complexation of Hg2+ with –C–Se–C– and –C–Se–Se–Se–C motif and elemental selenium. The counter ions (NO3−) and water molecules can expand the coordination number around the mercury ion beyond two and three and those are not shown explicitly in Scheme 3(a).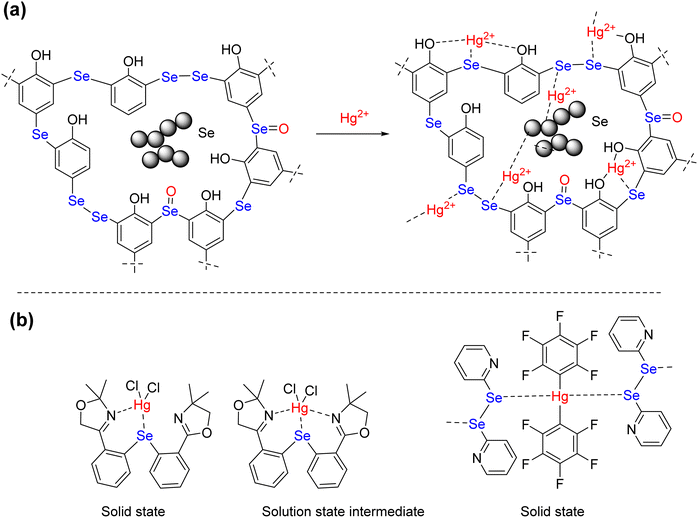 | ||
| Scheme 3 (a) Plausible complexation mode between Hg2+ and Se in Se-PR 2, (b) coordination geometry around Hg2+ reported in the literature. | ||
Fig. S15 (see ESI†) shows the FE-SEM images of the respective pristine and Hg2+-adsorbed polymers. The pristine Se-PR 1 and Se-PR 2 exhibited appeared spherical particles with porous features. After Hg2+ adsorption, the microscopy image of Se-PR 1 showed a spongy appearance, whereas the microscopy image of Se-PR 2 showed a brick-like structure with roughened surfaces. These changes indicated the adsorption of Hg2+ ion on to the polymers.61 EDAX and elemental mapping analysis (ESI,† Fig. S16 and S17) further confirms the enhanced presence of selenium-based coordination sites for Hg2+ ions along the pore walls of Se-PR 1 and 2. The ratio of atomic percentage of Hg2+ ions to selenium centers was 0.177 and 0.396, respectively, for Se-PR 1 and 2, which is in conformity with the Hg2+ adsorption isotherm studies, where the latter had high maximum adsorption capacity than the former. Further, as revealed from the XPS studies, Se-PR 2 contains relatively more soft selenium centers than Se-PR 1. The significantly higher adsorption capacity obtained for Se-PR 2 is attributed to the relatively higher content of low-valent (soft) selenium motifs in the polymer. These mechanistic details point to the fact that the primary mechanism for capturing Hg2+ involves the strong coordination of electron-rich selenium sites with soft Hg2+ ions via coordination interactions.
To understand the structural aspects of the recycled material, 350 mg of high-performance material Se-PR 2 was treated with 350 mL of 1.5 mM Hg2+ solution, and the resultant material was recycled using acid treatment (1 M HCl). The comparison of the powder XRD pattern of the recycled and pristine polymer did not show any significant change in the peak positions that supports the fact that the structure of the recycled polymer remains intact (ESI,† Fig. S18). Further, the crystallite size for the recycled and pristine polymer were calculated using the Debye–Scherrer equation62 , [where D represents the crystallite size, K is the Scherrer constant and the value is approximately 0.9, λ is the wavelength of the X-ray source (1.5406 Å), β indicates the full width at half maximum (FWHM) in radians, and θ denotes the peak position]. Analysis was carried out only for the 2θ = 20° peak as it corresponds to the polymer. The crystallite size of the recycled polymer and pristine polymer was 0.335 and 0.485 nm, respectively. It indicates that both polymers, recycled and pristine, do not have well-developed crystallites. Fig. S19 (see ESI†) shows the comparison of the FE-SEM images of the recycled and pristine polymers. The morphological feature in both the FE-SEM images are very similar, indicating that no significant morphological change occurs after recycling. The nitrogen-adsorption curve, from the BET measurement, of the recycled material resembles the nitrogen adsorption of the curve of the pristine polymer. However, the desorption curve of the recycled polymer is slightly different from the pristine polymer, which could be due to the accumulation of some residual mercury ions in the deep narrow micropores. It is in agreement with the pore size distribution data (ESI,† Fig. S20). The differential volume distribution, in other words, specific volume (cm3 g−1), due to the micropores drastically decreased in the BJH distribution cure. The pore size distribution in the mesoporous regime remains unaffected. This is essentially due to the accumulation of the Hg2+ ions in the inner microporous branches that could not be leached out during the recycling process. EDAX analysis of the recycled polymer revealed that about 14% of the Hg2+ ions were retained in the material after acid treatment (ESI,† Fig. S21).
4. Conclusion
In summary, this study represents the single-step synthesis of two porous organoselenium polymers Se-PR 1 and 2. The solvent seems to control the cross-links between the monomers and evolving particle aggregation, leading to the formation of hierarchically-structured porous polymers. The in-built porous hierarchy and incorporation of electron-rich selenium atoms in the phenolic polymer significantly enhanced the adsorption capacity of such polymers towards Hg2+ ions. Both polymers exhibited high thermal stability, high binding affinity and fast adsorption kinetics, which are desirable for practical applications. Se-PR 2 has shown good adsorption capacity in acidic to neutral pH medium and shows modest recyclability. The polymers can be readily made using commercially available starting materials and the synthesis can be easily scaled up for large-scale applications. The solvent-controlled hierarchical structure evolution expands the scope of the synthesis to develop novel materials as polymeric sorbents and solid-state catalysts.Data availability
ESI† are available for the synthesis of the Rh-B-imine probe, spectral data, and Freundlich isotherm model parameters.Conflicts of interest
The authors have no conflict of interest to declare.Acknowledgements
VS and SK are thankful to express our sincere gratitude to VIT Vellore for their generous support in providing access to the FE-SEM, EDAX, elemental mapping, and BET surface area analysis facilities. We also acknowledge VIT-AP University for their assistance with TGA and powder-XRD analysis. Additionally, we are grateful to Alagappa University, Karaikudi, for the X-ray photoelectron spectroscopic analysis.References
- V. Lippolis, C. Santi, E. J. Lenardao and A. L. Braga, Chalcogen Chemistry: Fundamentals and Applications, The Royal Society of Chemistry, London, UK, 2023 Search PubMed.
- M. A. Khan, A. M. Asaduzzaman, G. Schreckenbach and F. Wang, Dalton Trans., 2009, 5766–5772 RSC.
- M. Bernabeu de Maria, D. Tesauro, F. Prencipe, M. Saviano, L. Messori, C. Enjalbal, R. Lobinski and L. Ronga, Inorg. Chem., 2023, 62, 14980–14990 CrossRef CAS PubMed.
- J. Xia, T. Li, C. Lu and H. Xu, Macromolecules, 2018, 51, 7435–7455 CrossRef CAS.
- Y. Wang, L. Yu, B. Zhu and L. Yu, J. Mater. Chem. A, 2016, 4, 10828–10833 RSC.
- Q. Li, K. L. Ng, X. Pan and J. Zhu, Polym. Chem., 2019, 10, 4279–4286 RSC.
- A. V. Marsh and M. Heeney, Polym. J., 2023, 55, 375–385 CrossRef CAS.
- H. Xu, W. Cao and X. Zhang, Acc. Chem. Res., 2013, 46, 1647–1658 CrossRef CAS PubMed.
- G. B. V. S. Lakshmi, M. Alam, A. M. Siddiqui, M. Zulfequar and M. Husain, Curr. Appl. Phys., 2011, 11, 217–222 CrossRef.
- X. Ding, D. K. Tran, D. Kuzuhara, T. Koganezawa and S. A. Jenekhe, ACS Appl. Polym. Mater., 2020, 3, 49–59 CrossRef.
- W. Zhou, L. Wang, F. Li, W. Zhang, W. Huang, F. Huo and H. Xu, Adv. Funct. Mater., 2017, 27, 1605465 CrossRef.
- F. Yuan, C. Song, X. Sun, L. Tan, Y. Wang and S. Wang, RSC Adv., 2016, 6, 15201–15209 RSC.
- H. Li, F. Meng, P. Zhu, H. Zu, Z. Yang, W. Qu and J. Yang, Nat. Commun., 2024, 15, 1292 CrossRef CAS PubMed.
- J. Kończyk, S. Żarska and W. Ciesielski, Colloids Surf., A, 2019, 575, 271–282 CrossRef.
- Q. Li, Y. Zhang, Z. Chen, X. Pan, Z. Zhang, J. Zhu and X. Zhu, Org. Chem. Front., 2020, 7, 2815–2841 RSC.
- W. Cao, L. Wang and H. Xu, Nano Today, 2015, 10, 717–736 CrossRef CAS.
- E. J. Lenardão, C. Santi and L. Sancineto, New frontiers in organoselenium compounds, Springer, Cham, Switzerland, 2018, vol. 6330 Search PubMed.
- I. Sakthinathan, M. Mahendran, K. Krishnan and S. Karuthapandi, Sustainable Energy Fuels, 2021, 5, 3617–3631 RSC.
- V. Selladurai and S. Karuthapandi, Beilstein J. Org. Chem., 2024, 20, 1221–1235 CrossRef CAS PubMed.
- A. Tanimu and K. Alhooshani, J. Environ. Chem. Eng., 2021, 9, 105833 CrossRef CAS.
- L. Huang and Q. Shuai, ACS Sustainable Chem. Eng., 2019, 7, 9957–9965 CrossRef CAS.
- J. Cheng, Y. Li, L. Li, P. Lu, Q. Wang and C. He, New J. Chem., 2019, 43, 7683–7693 RSC.
- L. Wang, J. Liu, J. Wang, D. Zhang and J. Huang, J. Colloid Interface Sci., 2024, 653, 405–412 CrossRef CAS PubMed.
- P. S. Umabharathi and S. Karpagam, ACS Omega, 2022, 7, 24638–24645 CrossRef CAS PubMed.
- L. Thurakkal and M. Porel, Environ. Sci.: Water Res. Technol., 2023, 9, 285–293 RSC.
- S. Ahmed, J. Brockgreitens, K. Xu and A. Abbas, Adv. Funct. Mater., 2017, 27, 1606572 CrossRef.
- X. Wu, H. Lin, F. Dai, R. Hu and B. Z. Tang, CCS Chem., 2020, 2, 191–202 CrossRef CAS.
- J. Choi, S. Y. Park, H. Y. Yang, H. J. Kim, K. Ihm, J. H. Nam, J. R. Ahn and S. U. Son, Polym. Chem., 2011, 2, 2512–2517 RSC.
- H. Liu, Z. Chen, S. Feng, D. Wang and H. Liu, Polymers, 2019, 11, 2084 CrossRef CAS PubMed.
- Z. Qian, Y. Zhang, X. Pan, N. Li, J. Zhu and X. Zhu, React. Funct. Polym., 2019, 142, 223–230 CrossRef CAS.
- P. Mahato, S. Saha, P. Das, H. Agarwalla and A. Das, RSC Adv., 2014, 4, 36140–36174 RSC.
- Y. Liu, Y. Sun, J. Du, X. Lv, Y. Zhao, M. Chen, P. Wang and W. Guo, Org. Biomol. Chem., 2011, 9, 432–437 RSC.
- Z. Markovic, S. Marković and N. Begovic, J. Chem. Inf. Model., 2016, 46, 1957–1964 CrossRef PubMed.
- T. W. Campbell, H. G. Walker and G. M. Coppinger, Chem. Rev., 1952, 50, 279–349 CrossRef CAS.
- R. L. Hamblin, N. Q. Nguyen and K. H. DuBay, Soft Matter, 2022, 18, 943–955 RSC.
- C. D. Mino, A. J. Clancy, A. Sella, C. A. Howard, T. F. Headen, A. G. Seel and N. T. Skipper, J. Phys. Chem. B, 2023, 127(6), 1357–1366 CrossRef PubMed.
- L. J. You, S. Xu, W. F. Ma, D. Li, Y. T. Zhang, J. Guo, J. J. Hu and C. C. Wang, Langmuir, 2012, 28, 10565–10572 CrossRef CAS PubMed.
- M. A. Ruiz-Fresneda, A. S. Eswayah, M. Romero-González, P. H. Gardiner, P. L. Solari and M. L. Merroun, Environ. Sci.: Nano, 2020, 7, 2140–2155 RSC.
- C. Sun, S. Ji, F. Li and H. Xu, ACS Appl. Mater. Interfaces, 2017, 9, 12924–12929 CrossRef CAS PubMed.
- N. Ma, Y. Li, H. Ren, H. Xu, Z. Li and X. Zhang, Polym. Chem., 2010, 1, 1609–1614 RSC.
- J. Kour, P. Khajuria, P. K. Verma, N. Kapoor, A. Kumar and S. D. Sawant, ACS Omega, 2022, 7, 3000–13009 CrossRef PubMed.
- E. Skuodaite and V. Krylova, Coatings, 2023, 13, 1661 CrossRef CAS.
- Y. Deng, L. Gong, Y. Pan, X. Cheng and H. Zhang, Nanoscale, 2019, 11, 11671–11678 RSC.
- B. Abebe, H. A. Murthy and E. Amare, J. Encapsulation Adsorpt. Sci., 2018, 8, 225–255 CrossRef CAS.
- A. Modak, S. Das, D. K. Chanda, A. Samanta and S. Jana, New J. Chem., 2019, 43, 3341–3349 RSC.
- M. Rajasekar, P. Baskaran, J. Mary, S. Meenambigai and M. Selvam, Inorg. Chem. Commun., 2024, 112143 CrossRef CAS.
- C. Long, X. Li, Z. Jiang, P. Zhang, Z. Qing, T. Qing and B. Feng, J. Hazard. Mater., 2021, 413, 125470 CrossRef CAS PubMed.
- S. Hernandez, M. S. Islam, S. Thompson, M. Kearschner, E. Hatakeyama, N. Malekzadeh, T. Hoelen and D. Bhattacharyya, Ind. Eng. Chem. Res., 2019, 59, 5287–5295 CrossRef PubMed.
- D. Zhang, L. Wang, H. Zeng, P. Yan, J. Nie, V. K. Sharma and C. Wang, Chem. Eng. J., 2019, 363, 192–202 CrossRef CAS.
- T. A. Saleh, M. Tuzen and A. Sarı, J. Environ. Manage., 2018, 211, 323–333 CrossRef CAS PubMed.
- X. Wang, W. Deng, Y. Xie and C. Wang, Chem. Eng. J., 2013, 228, 232–242 CrossRef CAS.
- J. Aguado, J. M. Arsuaga and A. Arencibia, Ind. Eng. Chem. Res., 2005, 44, 3665–3671 CrossRef CAS.
- B. Ram and G. S. Chauhan, Chem. Eng. J., 2018, 331, 587–596 CrossRef CAS.
- Y. Liu, Q. Gao, C. Li, S. Liu, K. Xia, B. Han and C. Zhou, ACS Appl. Polym. Mater., 2019, 1, 2680–2691 CrossRef CAS.
- M. Imamoglu, D. Perez-Quintanilla and I. Sierra, Microporous Mesoporous Mater., 2016, 229, 90–97 CrossRef CAS.
- B. S. Inbaraj, J. S. Wang, J. F. Lu, F. Y. Siao and B. H. Chen, Bioresour. Technol., 2009, 100, 200–207 CrossRef CAS PubMed.
- N. Caner, A. Sarı and M. Tuzen, Ind. Eng. Chem. Res., 2015, 54, 7524–7533 CrossRef CAS.
- C. O. Kienitz, C. Thöne and P. G. Jones, Inorg. Chem., 1996, 35, 3990–3997 CrossRef CAS PubMed.
- G. Mugesh, H. B. Singh, R. P. Patel and R. J. Butcher, Inorg. Chem., 1998, 37, 2663–2669 CrossRef CAS PubMed.
- J. D. Singh, M. Maheshwari, S. Khan and R. J. Butcher, Tetrahedron Lett., 2008, 49, 117–121 CrossRef CAS.
- M. A. Albakri, T. A. Saleh, Y. Mankour, T. F. Garrison and O. C. S. Al Hamouz, J. Colloid Interface Sci., 2021, 582, 428–438 CrossRef CAS PubMed.
- M. A. R. Fresneda, J. D. Martín, J. G. Bolívar, M. V. F. Cantos, G. Bosch-Estévez, M. F. M. Moreno and M. L. Merroun, Environ. Sci.: Nano, 2018, 5, 2103–2116 RSC.
Footnote |
| † Electronic supplementary information (ESI) available. See DOI: https://doi.org/10.1039/d4ma00899e |
| This journal is © The Royal Society of Chemistry 2024 |

