 Open Access Article
A novel synthesis of inorganic–organic nanohybrid based on SiW11Co@Cu–BTC/MWCNTs-COOH for electrocatalytic oxidation of dopamine†
Zahra
Sadeghi
and
Somayeh
Dianat
 *
*
Department of Chemistry, Faculty of Sciences, University of Hormozgan, Bandar Abbas 79161-93145, Iran. E-mail: s.dianat@hormozgan.ac.ir
First published on 15th November 2024
Abstract
Polyoxometalate (POM)-based inorganic–organic hybrid compounds exhibit a remarkable range of properties. These compounds are distinguished by their strong acidity, oxygen-rich surfaces, and excellent redox capabilities. Importantly, they do not share the typical limitations of POMs, such as low specific surface area and instability in aqueous solutions. In this paper, we present the design of a novel modified glassy carbon electrode (GCE) using a tri-component nanocomposite consisting of SiW11O39Co(H2O) (SiW11Co), Cu–BTC (BTC is benzene-1,3,5-tricarboxylate), and carboxyl functionalized multi-walled carbon nanotubes (MWCNTs-COOH) fabricated through a drop-casting method followed by electrodeposition reduction. The resulting hybrid nanocomposite (SiW11Co@Cu–BTC/MWCNTs-COOH) was characterized using Fourier transform infrared spectroscopy (FT-IR), X-ray diffraction (XRD), and transmission electron microscopy (TEM). Additionally, elemental composition was analyzed via inductively coupled plasma-optical emission spectrometry (ICP-OES), while surface area and pore volume distribution were measured using Brunauer–Emmett–Teller (BET) analysis. The morphology, electrochemical properties, and electrocatalytic activity of the SiW11Co@Cu–BTC/MWCNTs-COOH/GCE were evaluated through field emission scanning electron microscopy/energy-dispersive X-ray analysis (FE-SEM/EDX), voltammetry, and amperometry techniques. Under optimized conditions, the sensor exhibited outstanding electrocatalytic activity toward dopamine (DA), achieving two linear detection ranges of 5–80 μM and 80–600 μM, with a limit of detection (LOD) of 2.35 μM (S/N = 3) using square wave voltammetry (SWV). Furthermore, the sensor exhibited high repeatability and reproducibility, ensuring consistent performance across multiple measurements. It also showed robust stability and outstanding selectivity. The sensor's analytical performance was further validated by its successful application to real samples.
1. Introduction
Polyoxometalates (POMs) are a big family of polynuclear metal–oxygen clusters formed by d0 transition-metals (e.g., V5+, Nb5+, Ta5+, Mo6+, and W6+).1,2 POMs, especially Keggin POMs, because of their structural diversity, electronic features, and excellent redox character have applications in the different fields of catalysis,3 optics,4 electromagnetism,5 biological science,6,7 energy storage,8,9 separation,10,11 and electrochemistry.12–15 One of the intriguing characteristics of POMs is their ability for anionic clusters to execute rapid, reversible, and sequential multi-electron transfer processes while preserving their structural integrity.16,17 This property makes them desirable in electrocatalysis studies and electrochemical sensing. Despite these advantages, POMs remain encumbered by inherent challenges such as low specific surface area (SSA below 10 m2 g−1) and elevated solubility in aqueous solutions, which limit their suitability as electrocatalysts within chemically modified electrodes (CMEs).18 Encapsulating or loading POMs onto porous materials or non-porous supports with a significant SSA can significantly mitigate issues such as leaching and aggregation. This approach enhances the electrochemical properties and electrocatalytic activities of POMs, thereby improving their overall performance.18Over the past several decades, an increasing number of micro and nano-porous materials have emerged as viable supports for POMs, particularly in the form of carbon-based substances,18,19 silica,20 conducting polymers,21 and metal–organic frameworks (MOFs).2,15,22 Recently, MOFs have been the spotlight of porous materials in wide research areas, particularly in materials science and the chemical industry, due to their fantastic nature and unique properties. MOFs are highly crystalline subsets of nanoporous materials consisting of metal nodes and multidentate organic ligands (as linkers) linked together through covalent bonds to fabricate infinite hollow structures.23 The ability to choose a wide variety of metals and linkers in the preparation of MOFs can create adjustable structures with controllable nanopores that make unique properties such as ultra-high SSA, accessible metal sites, open framework structures, and designable functionalities in the obtained structures. Such unique properties can make these compounds promising candidates for application in different areas, like gas storage and separation,24 drug delivery,25,26 proton conduction,27,28 solar cells,29,30 supercapacitors,31,32 biomedicine,33,34 and especially catalysis,35–37 and electrocatalysis.38,39 Moreover, MOFs are recognized for their exceptional hosting properties due to their high internal SSA, long-range ordered structure, and the ability to fine-tune pore size and channel geometry, which contributes to their versatility in various applications.18 Up to now, a variety of functional materials as guest molecules such as metal nanoparticles, quantum dots, metal oxides, enzymes, POMs, silica, and polymers have been effectively integrated with MOFs to produce MOF hybrid materials.40 In MOF hybrid materials, the properties of both MOFs (porous structure, chemical versatility, and structural design capability) and guest molecules (catalytic, optical, electrical, magnetic activities, and mechanical strength) can be efficiently combined.40 Additionally, the synergistic interaction between the d–π orbitals of POM clusters and the delocalized p–π electrons of a MOF can lead to the emergence of new physical and chemical properties.41 MOF-199 (Cu–BTC) with the chemical formula of [Cu3(BTC)2(H2O)3]n (BTC is benzene-1,3,5-tricarboxylate) is one rigid MOF, that can be simply produced.42 It has a 3D framework with open metal sites and suitable SSA (1660 m2 g−1) and significant pore volume (0.69 cm3 g−1) that allows the chemical functionalization of the channel inside layer.41 Cu–BTC was synthesized for the first time in 1999 by Chui et al.43 As stated by them, Cu–BTC has a 3D channel structure with a developed porous network (about 1 nm pore size). In fact, Cu2+ is the central cation and BTC constitutes the linker. The Cu–BTC with excellent electrochemical and electrocatalytic properties have been applied in electrochemical sensors to determine glucose,44 nitrite,45 ascorbic acid,46 hydrazine,47 H2O2,48 ethanol,49 NADH,50etc. The porous Cu–BTC can allow electrolyte or analytes to enter the channels while its porous structure is quite well retained.44 However, there are limited studies that reported its performance in the electrochemical sensors. Ji et al.51 developed a Cu–BTC modified carbon paste electrode (CPE) as a novel sensing platform for sunset yellow and tartrazine at the linearity range of 0.3 to 50 nM and 1.0 to 100 nM with a limit of detection (LOD) of 0.05, and 0.14 nM, respectively. Song et al.44 developed a GOD/AuNPs/Cu–BTC MOFs/3D-KSCs electrode (GOD: glucose oxidase; AuNPs: gold nanoparticles; KSCs: macroporous carbon) for glucose detection with an excellent linearity range of 44.9 μM to 4.0 mM and 4.0 to 19 mM, and the LOD of 14.77 μM. Cao et al.52 fabricated an electrochemical sensor based on a hierarchical Cu–BTC MOF material (Cu–BTC/ITO) for glyphosate detection. This Cu–BTC-based sensor displays a wide linearity range of 1.0 × 10⁻³ to 1.0 nM and 1.0 to 1.0 × 10⁴ nM and LOD of 1.4 × 10⁻⁴ nM.
POM@M–BTC materials demonstrate exceptional electrochemical performance in sensing applications. Despite their promising attributes, there remains a need for further exploration into the electrochemical potential of these materials beyond their conventional applications.
Li et al.53 have identified a POM-based NENU-5 composited with ketjenblack (KB) as a high performance electrochemical sensor for hydrogen peroxide (H2O2) detection. The composite catalyst has an excellent electrochemical detection efficiency, including a low LOD (1.03 μM), a broad linearity range (10 μM to 50 mM), and a high sensitivity (33.77 μA mM−1), and also excellent stability and selectivity.
Zhang et al.54 applied a one-step solvothermal approach to synthesize immobilized POM/Cu–BTC on carbon cloth (NENU-3/CC and NENU-5/CC). The homogeneous distribution of the POM/Cu–BTC across the conductive substrate enhances the stability and efficiency of electrocatalytic activity. The NENU-3/CC and NENU-5/CC demonstrated high electro-reduction of bromate under acidic conditions. Notably, NENU-3/CC achieved a sensitivity of 45.11 μA cm−2 mM−1 with a detection limit of 0.55 μM, whereas NENU-5/CC reached a sensitivity of 18.83 μA cm−2 mM−1 and a detection limit of 1.18 μM. Moreover, the results indicate that the two film electrodes exhibit superior electrochemical stability and selectivity, positioning them as effective sensor materials for bromate detection.
Yu et al.55 synthesized a Ag5BW12O40@Ag–BTC multifunctional compound and then demonstrated its excellent sensing performance for H2O2 detection. The reported sensors herein exhibited a wide detection range, extending from 0.4 μM to 0.27 mM and a low detection limit of 0.19 μM. These sensors also demonstrated excellent selectivity and stability.
Xu et al.56 prepared a Co3Mo7O24@Ag–BTC hybrid compound and used it as a H2O2 sensor. Co3Mo7O24@Ag–BTC exhibited a comprehensive set of analytical capabilities, featuring a broad detection range (1 μM to 0.43 mM), a low detection limit (0.33 μM), and an excellent selectivity. Its recovery ability was validated through its use in detecting H2O2 in blood serum. The recovery value of 98.41% represents its practical utility.
Additionally, the immobilization of POMs on carbon nanomaterials has been extensively documented, which has been shown to enhance the catalytic and electrocatalytic properties of these materials.
Over the past decade, carbon nanotubes (CNTs) have been leveraged to augment the electrochemical efficiency of CMEs because of their distinctive chemical and physical features.12 These nanostructures serve as ideal support matrices for POM-based catalysts, offering benefits such as superior structural integrity, enhanced mechanical properties, and excellent electronic conduction.12 CNTs are members of the fullerene structural family, which are involved in single-walled carbon nanotubes (SWCNTs) and multi-walled carbon nanotubes (MWCNTs).57 MWCNTs are particularly appealing for use as electrocatalysts because of their significant internal SSA, high chemical and physical stability, extensive electrochemical window, and superior electrical conductivity.12,58,59 Until now, no reports are available of POM@M–BTC/MWCNT nanocomposites.
In this study, an innovative approach to electrode modification was employed by constructing a novel glassy carbon electrode (GCE) that is composed of a tri-component inorganic–organic nanocomposite SiW11O39Co(H2O)@Cu–BTC/MWCNTs-COOH (SiW11Co@Cu–BTC/MWCNTs-COOH/GCE) by the drop-casting method followed by an electrodeposition procedure. The Cu–BTC is selected for increasing the SSA, active site, stability, and selectivity, and using MWCNTs-COOH as a conductive substrate to assist electron-transfer between SiW11Co@Cu–BTC and the GCE surface. The modified GCE was then utilized as an electrochemical sensor for the quantitative determination of dopamine (DA) via electrochemical methods. This approach allowed for the evaluation of electrochemical behavior, selectivity, reproducibility, repeatability, and recovery in real biological samples, providing a comprehensive assessment of the sensor's performance.
2. Experiment
2.1. Materials
The K6[SiW11O39Co(H2O)]·nH2O (SiW11Co) and Cu–BTC were synthesized following previously established procedures.60,61 Tungstosilicic acid (H4SiW12O40·nH2O, HSiW), acetic acid (HAc), potassium carbonate (K2CO3), potassium acetate (KOAc), cobalt(II) acetate tetrahydrate (Co(OAc)2·4H2O), sodium perchlorate (NaClO4), phosphoric acid (H3PO4), sulfuric acid (H2SO4), boric acid (H3BO3), potassium hexacyanoferrate (K3[Fe(CN)6]), and DA were of analytical grade. All reagents and materials were procured from reputable commercial suppliers, specifically Merck and Sigma, and employed without more purification. MWCNTs-COOH (SSA 200 m2 g−1) were bought from Tecnan company, Spain. All solutions were made in deionized water (DI, 18 MΩ cm (25 °C), Milli Q, Millipore Inc.). Phosphate buffer saline (PBS) solution was prepared by dilution of a stock solution of 0.01 M H3PO4 and subsequent pH adjustment using a solution of 0.5 M NaOH. Britton–Robinson buffer (BRB) solution was made by mixing the H3PO4 (0.04 M), H3BO3 (0.04 M), and HAc (0.04 M) that is titrated by NaOH (0.2 M) to obtain the desired pH (pH 3–9). A dopadic ampoule (Caspian Tamin Pharmaceutical Co., Rasht, Iran) containing 200 mg/5 mL of DA was used as the DA source of the pharmaceutical sample. Human blood serum samples were collected from a volunteer in Hakiman medical diagnostic lab (Bandar Abbas, Iran).2.2. Apparatus
FT-IR spectra were recorded in the range 4000–400 cm−1 by a Spectrum Two Spectrometer–PerkinElmer. The crystalline structures of SiW11Co, SiW11Co@Cu–BTC, Cu–BTC, MWCNTs-COOH, and SiW11Co@Cu–BTC/MWCNTs were studied using X-ray diffraction (XRD) on a Panalytical X′PertPro X-ray diffractometer with a Cu Kα radiation source (λ = 1.5418 Å). A transmission electron microscope (TEM, Philips EM208S-100 kV, Netherlands) was used to examine the morphology of the SiW11Co, Cu–BTC, SiW11Co@Cu–BTC, and SiW11Co@Cu–BTC/MWCNTs-COOH compounds. To estimate the percent of immobilized SiW11Co@Cu–BTC on the surface of MWCNTs-COOH, the tungsten contents of the SiW11Co@Cu–BTC/MWCNTs-COOH were detected using inductively coupled plasma-optical emission spectrometry (ICP-OES) on a PerkinElmer Optima 7300 DV, Waltham, MA, USA. Nitrogen adsorption–desorption analysis was carried out at 77 K on a BElSORP-Mini, Microtrac Bel Corp instrument. SSA and pore size distribution curves of the Cu–BTC, SiW11Co@Cu–BTC, and SiW11Co@Cu–BTC/MWCNTs-COOH were characterized by the Brunauer–Emmett–Teller (BET) method, and the Barrett–Joyner–Halenda (BJH) algorithm. The morphology and elemental analyses of the bare, and modified GCEs (Cu–BTC/GCE, and SiW11Co@Cu–BTC/MWCNTs-COOH/GCE) were characterized with field emission scanning electron microscopy (FE-SEM, Zeiss-SIGMA VP model, Germany), coupled with energy dispersive X-ray spectrometry (EDX) and EDX-mapping, which provided detailed insights into the material's structural features and elemental composition.The electrochemical experiments were done by an Autolab PGSTAT 302N instrument (Eco-Chemie, Netherlands). A GCE (GR-2S/N, Detect Company, Tehran, Iran, diameter 2.0 mm), a commercial Ag/AgCl/3 M KCl electrode (Metrohm, Switzerland) and a Pt rod (IV-EL/EB-2200, Ivium, Eindhoven, Netherlands) were applied as the working electrode, reference electrode, and counter electrodes, respectively. All measurements were recorded with the Autolab NOVA 2.1.5 software. Before the electrochemical analysis, the electrolyte was saturated with argon gas (99.999% purity) for 15 minutes and covered by the argon atmosphere throughout the analysis. Electrochemical impedance tests were performed on a potentiostat/galvanostat instrument (EIS, Ivium v11108 Eindhoven, Netherlands) in [Fe(CN)6]3−/4− (0.5 mM) solution in 0.01 M PBS (pH 3) containing KCl (0.1 M) at a frequency range of 0.01–105 Hz. The electrochemical experiments were executed under controlled ambient temperature conditions.
2.3. Synthesis of SiW11Co@Cu–BTC
Cu(OAc)2·H2O (0.2 g, 1 mmol) and SiW11Co (0.27 g, 0.092 mmol) in DI water (10 mL) were stirred for 20 minutes (solution A). The pH of solution A was carefully adjusted to 3.5 by 1 M HCl aqueous solution. H3BTC (0.14 g, 0.67 mmol) was dissolved in 10 mL C2H5OH (solution B). Solution B was gradually added to solution A with continuous stirring at 25 °C. A blue precipitate appeared immediately. The obtained precipitate was filtered and washed with ethanol and DI water (1![[thin space (1/6-em)]](https://www.rsc.org/images/entities/char_2009.gif) :
:![[thin space (1/6-em)]](https://www.rsc.org/images/entities/char_2009.gif) 1). After drying at 25 °C for 24 h, the crystalline material was obtained.
1). After drying at 25 °C for 24 h, the crystalline material was obtained.
2.4. Synthesis of SiW11Co@Cu–BTC/MWCNTs-COOH
A suspension of SiW11Co@Cu–BTC (5 mg) and MWCNTs-COOH (5 mg) in DI water (5 ml) was ready. The prepared suspension was stirred at 45 °C for 1 h and subsequently sonicated for 5 minutes to achieve a homogenous dispersion of SiW11Co@Cu–BTC/MWCNTs-COOH.2.5. Preparation of SiW11Co@Cu–BTC/MWCNTs-COOH/GCE
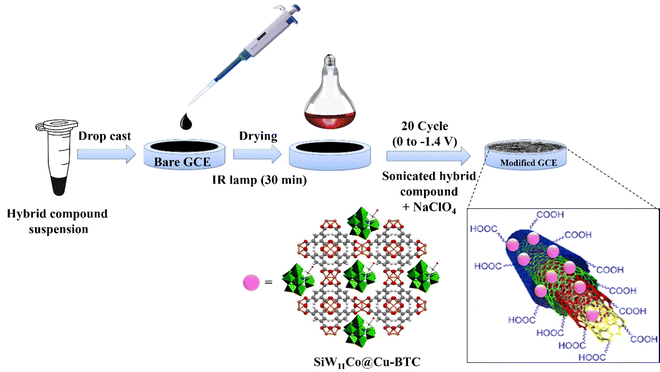
The procedure of electrode modification is shown in Scheme 1. Initially, 10 μL of a suspension of SiW11Co@Cu–BTC/MWCNTs-COOH in DI water (1.0 mg mL−1) was dropped on the bare GCE surface. Next, the GCE was dried by an IR lamp (250 W) for 30 minutes, and rinsed with DI water. Then, the GCE was subjected to twenty cycles within a defined potential range of 0 to −1.4 V with scan rate 25 mV s−1 in a sonicated suspension of SiW11Co@Cu–BTC/MWCNTs-COOH (1.0 mg mL−1) and NaClO4 (0.2 M). The modified GCE was denoted as SiW11Co@Cu–BTC/MWCNTs-COOH/GCE throughout the text.3. Results and discussion
3.1. Characterizations of the nanohybrid compound
The loading percent of SiW11Co over the MWCNTs-COOH surface was estimated to be 0.27% using ICP-OES spectroscopy. The FT-IR spectra of the SiW11Co, SiW11Co@Cu–BTC, Cu–BTC, MWCNTs-COOH, and SiW11Co@Cu–BTC/MWCNTs-COOH are presented in the ESI† (Fig. S1). The detailed stretching frequencies (![[small upsilon, Greek, macron]](https://www.rsc.org/images/entities/char_e0d5.gif) cm−1) assignments in the FT-IR spectra are given in Table S1 (ESI†). The obtained results of FT-IR confirmed that the SiW11Co by maintaining the Keggin structure was incorporated into the Cu–BTC cage, and also the SiW11Co@Cu–BTC supported on the surface of MWCNTs-COOH.
cm−1) assignments in the FT-IR spectra are given in Table S1 (ESI†). The obtained results of FT-IR confirmed that the SiW11Co by maintaining the Keggin structure was incorporated into the Cu–BTC cage, and also the SiW11Co@Cu–BTC supported on the surface of MWCNTs-COOH.
The XRD patterns of SiW11Co, SiW11Co@Cu–BTC, Cu–BTC, MWCNTs-COOH, and SiW11Co@Cu–BTC/MWCNTs-COOH are presented in Fig. 1. As displayed in Fig. 1b, SiW11Co@Cu–BTC shows peaks at about 6.7°, and 19.1°, 24.2°, 25.2°, and 29.3°, which correspond to SiW11Co (Fig. 1a). However, peaks at about 9.4°, 11.6° 13.5°, 21.3°, 22.9°, and 25.9°, can be credited to the Cu–BTC (Fig. 1c). Fig. 1d shows two characteristic peaks at 25.9° and 42.3°, which correspond to (002) and (100) reflections of graphite from the MWCNTs-COOH, respectively. These results are consistent with the previous literature.12 In Fig. 1e, the characteristic XRD peaks of SiW11Co@Cu–BTC/MWCNTs-COOH appeared at nearly similar locations without a significant shift in its peak position compared to those of SiW11Co, and Cu–BTC. This indicates that SiW11Co species in the SiW11Co@Cu–BTC/MWCNTs-COOH hybrid nanocomposite still keep the Keggin structure. Furthermore, the presence of the characteristic peaks at 25.9° (002), and 42.3° (100) confirmed that SiW11Co@Cu–BTC was immobilized on the MWCNTs-COOH surface.
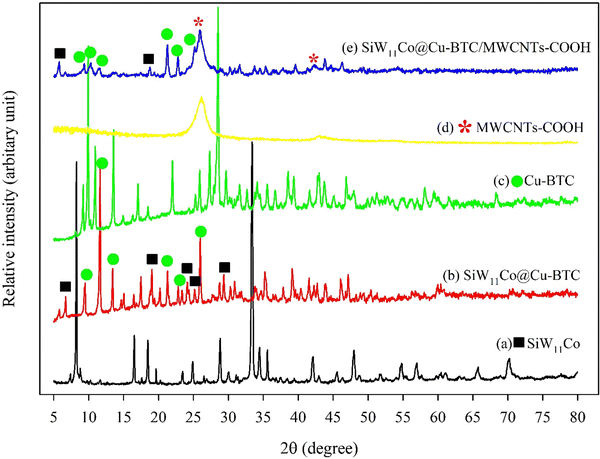 | ||
| Fig. 1 XRD patterns of SiW11Co (a), SiW11Co@Cu–BTC (b), Cu–BTC (c), MWCNTs-COOH (d), and SiW11Co@Cu–BTC/MWCNTs-COOH (e). | ||
The morphology of SiW11Co@Cu–BTC/MWCNTs-COOH was compared to SiW11Co, Cu–BTC, and SiW11Co@Cu–BTC at two magnification levels using TEM, as shown in Fig. 2. Fig. 2A displays SiW11Co which exhibits a spherical structure. Images a and b show that SiW11Co particles are dispersed, with some aggregation visible in image b, indicating that the particles are relatively small, scattered, and likely uniform in size distribution. Fig. 2B presents TEM images of Cu–BTC at two magnifications (images a and b), revealing elongated, rod-like crystals with a uniform shape, typical of MOF morphology. The rods are clearly resolved in image b, confirming the crystalline nature of the Cu–BTC. Fig. 2C shows the SiW11Co@Cu–BTC composite (images a and b). The morphology changes from rod-like to hexagonal, suggesting that SiW11Co is well incorporated into the pores of Cu–BTC. At higher magnification (image b), distinct layers are visible, indicating strong interaction and integration between SiW11Co and Cu–BTC. Fig. 2D depicts the hybrid composite of SiW11Co@Cu–BTC/MWCNTs-COOH. In image a, an entangled network of MWCNTs is evident, with SiW11Co@Cu–BTC particles interspersed on the nanotube surface. Image b provides a closer view, showing a strong interaction between the nanotubes and nanocomposite particles, which could enhance the composite's stability and electrocatalytic activity.
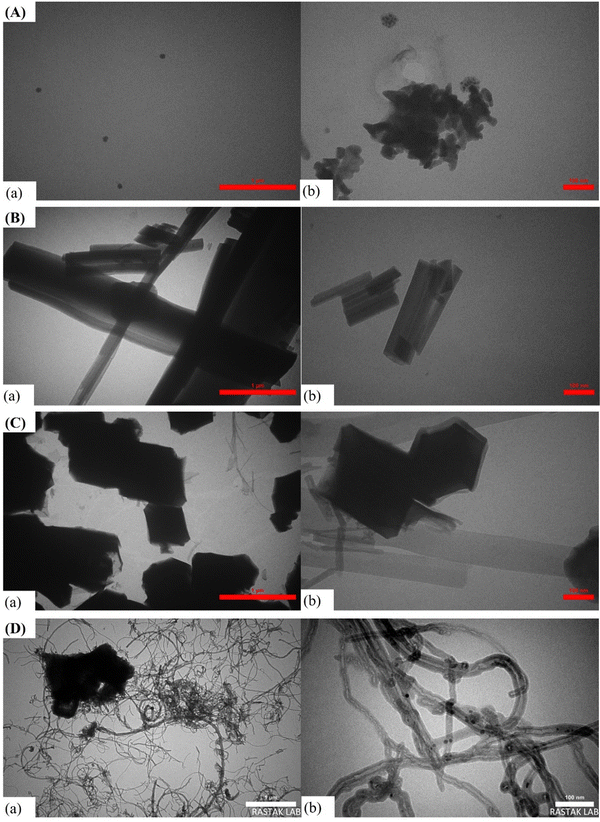 | ||
| Fig. 2 TEM images of (A) SiW11Co (a) and (b), (B) Cu–BTC (a) and (b), (C) SiW11Co@Cu–BTC (a) and (b), and (D) SiW11Co@Cu–BTC/MWCNTs-COOH (a) and (b) at different magnifications. | ||
Fig. 3A–C shows the nitrogen adsorption–desorption isotherms of Cu–BTC, SiW11Co@Cu–BTC, and SiW11Co@Cu–BTC/MWCNTs-COOH. As shown in Fig. 3A and C, Cu–BTC and SiW11Co@Cu–BTC/MWCNTs-COOH had type-III and type-I isotherms, respectively, which are characteristic of microporous materials. But the isotherm of the SiW11Co@Cu–BTC material exhibits a type-IV isotherm, which is due to the ordered mesoporous structure in SiW11Co@Cu–BTC. The isotherm of SiW11Co@Cu–BTC displays a H4 hysteresis loop that is frequently linked with narrow slit-like pores (Fig. 3B). The pore size distribution diagrams (inset of Fig. 3A–C) show that most of the pore diameters of Cu–BTC, and SiW11Co@Cu–BTC/MWCNTs-COOH are smaller than those of SiW11Co@Cu–BTC, which confirms the microporous structure in Cu–BTC, and SiW11Co@Cu–BTC/MWCNTs-COOH and mesoporous structure in SiW11Co@Cu–BTC. Some textural properties of the synthesis samples are given in Table 1. As seen, the BET SSA, total pore volume, and mean pore diameter of SiW11Co@Cu–BTC are sharply reduced compared to Cu–BTC, which should be credited to the occupation of pores of Cu–BTC by SiW11Co as guests. This phenomenon also indicates that SiW11Co is inserted into the pores of Cu–BTC rather than attached to the surface. However, the SiW11Co@Cu–BTC/MWCNTs-COOH shows a considerable increase in BET SSA due to the immobilization of SiW11Co@Cu–BTC on the surface of MWCNTs-COOH. It is believed that the more extensive BET SSA provides many active sites and more pathways for the diffusion of electrolyte ions, enhancing the electro-catalytic reaction.
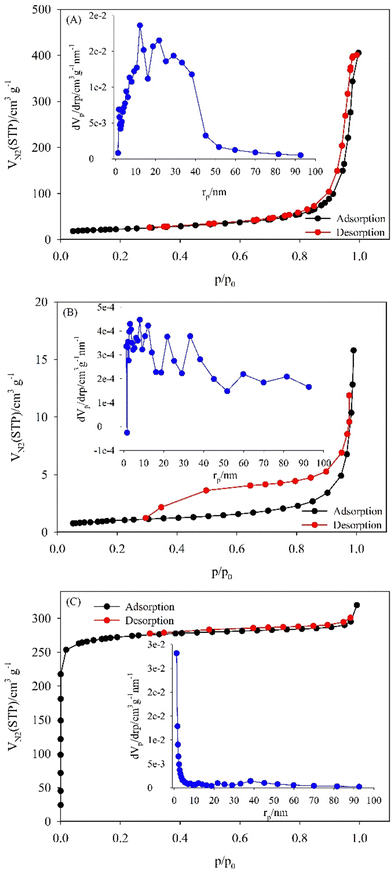 | ||
| Fig. 3 Nitrogen adsorption–desorption BET isotherms of (A) Cu–BTC, (B) SiW11Co@Cu–BTC, and (C) SiW11Co@Cu–BTC/MWCNTs-COOH. The insets show the BJH-adsorption pore size distributions. | ||
| Sample | BET SSA (m2 g−1) | Total pore volume (cm3 g−1) | Mean pore diameter (nm) |
|---|---|---|---|
| Cu–BTC | 81.1 | 0.6 | 28.9 |
| SiW11Co@Cu–BTC | 3.7 | 0.02 | 25.4 |
| SiW11Co@Cu–BTC/MWCNTs-COOH | 660.3 | 0.5 | 2.9 |
The morphology and chemical composition of the bare GCE, Cu–BTC/GCE, and SiW11Co@Cu–BTC/MWCNTs-COOH/GCE were analyzed using FE-SEM/EDX. As shown in Fig. 4A, image a, the bare GCE has a mirror-like surface, which was reformed to a rough surface with modification by Cu–BTC, and SiW11Co@Cu–BTC/MWCNTs-COOH (Fig. 4B and C, image a). Furthermore, the EDX spectra of both bare and modified GCEs are depicted in Fig. 4A–C image b. The EDX patterns and elemental mappings confirm the presence of carbon (C) and oxygen (O) within the bare GCE (Fig. 4A, images b–d), Cu, O, and C in the Cu–BTC/GCE (Fig. 4B, images b–e) and Cu, O, C, W, Si, and Co elements on the SiW11Co@Cu–BTC/MWCNTs-COOH/GCE (Fig. 4C, images b–h).
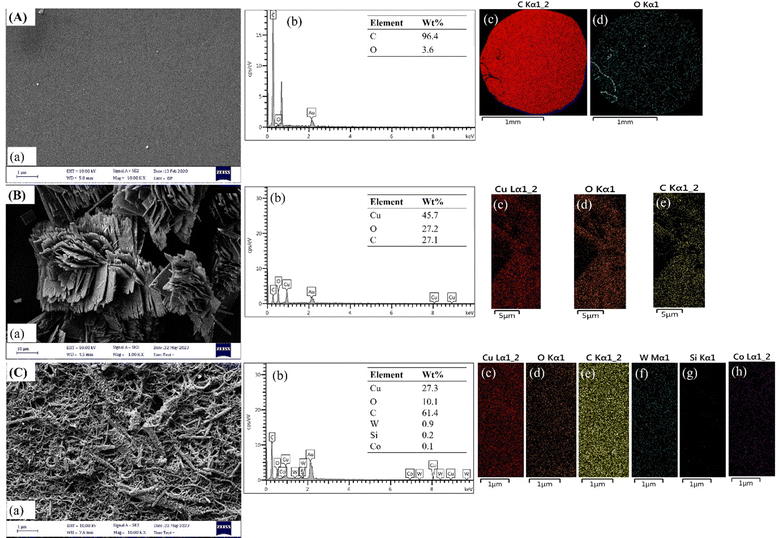 | ||
| Fig. 4 FE-SEM images, EDX pattern, and EDX element mapping of the (A) bare GCE, (B) Cu–BTC/GCE, and (C) SiW11Co@Cu–BTC/MWCNTs-COOH/GCE. | ||
3.2. Electrochemical behavior of SiW11Co@Cu–BTC/MWCNTs-COOH/GCE
The electrochemical behavior of the SiW11Co@Cu–BTC/MWCNTs-COOH-modified GCE was investigated in 0.04 M BRB (pH 7) using CV, and the results were compared with those obtained from the bare GCE, SiW11Co/GCE, Cu–BTC/GCE, and SiW11Co@Cu–BTC/GCE. The results are shown in Fig. 5, which has been divided into three parts for better analysis.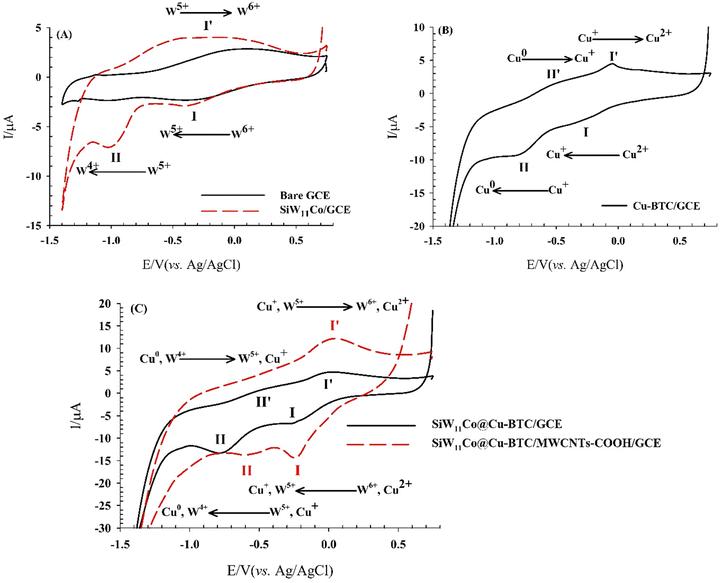 | ||
| Fig. 5 CVs obtained on (A) bare GCE, and SiW11Co/GCE, (B) Cu–BTC/GCE, and (C) SiW11Co@Cu–BTC/GCE, and SiW11Co@Cu–BTC/MWCNTs-COOH/GCE in 0.04 M BRB (pH 7) and scan rate of 50 mV s−1. | ||
Fig. 5A shows that the bare GCE exhibits no significant peaks. In contrast, the SiW11Co/GCE displays two distinct cathodic peaks (I and II) at −0.35 V and −0.97 V, corresponding to the sequential electron transfer processes of W6+ → W5+ → W4+. An anodic peak (I′) at −0.15 V, related to the W5+ → W6+ electron transfer, is also observed, with a ΔEp of 0.20 V for the I/I′ redox couple.
Fig. 5B illustrates the electrochemical behavior of Cu–BTC/GCE, which shows two well-defined redox couples (I/I′ and II/II′) with ΔEp values of 0.23 V and 0.25 V, respectively. These correspond to the sequential electron transfer processes of Cu2+/Cu+ and Cu+/Cu0.
As shown in Fig. 5C, the SiW11Co@Cu–BTC/GCE exhibits two cathodic peaks at −0.21 V (peak I) and −0.75 V (peak II), along with two anodic peaks at −0.04 V (peak I′) and −0.53 V (peak II′). These redox couples have lower ΔEp values (0.17 V and 0.22 V for I/I′ and II/II′, respectively) compared to the Cu–BTC/GCE, indicating that the synergistic effect between SiW11Co and Cu–BTC facilitates electron transfer more efficiently.
For the SiW11Co@Cu–BTC/MWCNTs-COOH/GCE (Fig. 5C), similar to SiW11Co/GCE, two cathodic peaks (I, II) and an anodic peak (I′) are observed at more positive potentials: −0.21 V, −0.56 V, and 0.0 V for peaks I, II, and I′, respectively. ip is lower than that of SiW11Co/GCE but higher than that of Cu–BTC/GCE and SiW11Co@Cu–BTC/GCE, which can be attributed to the presence of MWCNTs-COOH in the modified structure. The higher ip suggests that MWCNTs-COOH acts as an efficient catalyst, enhancing electron transfer between the electrode surface and the SiW11Co@Cu–BTC compound.
Given the proximity of the observed peak potentials for SiW11Co@Cu–BTC/GCE and SiW11Co@Cu–BTC/MWCNTs-COOH/GCE to the corresponding peaks in SiW11Co/GCE and Cu–BTC/GCE, these peaks are likely associated with the sequential electron transfer processes of W6+ → W5+ → W4+ and Cu2+ → Cu+ → Cu0. The absence of the W4+ → W5+ and Cu0 → Cu+ electron transfer process in the SiW11Co@Cu–BTC/MWCNTs-COOH/GCE is likely due to the high background current from the MWCNTs-COOH.
[Fe(CN)6]3−/4− serves as a standard redox couple to assess the electron-transfer characteristics at the interface of the bare and different modified GCEs. Fig. S2-A (ESI†) illustrates that the bare GCE, SiW11Co/GCE, and MWCNTs-COOH/GCE demonstrated a single redox couple (I/I′) corresponding to the Fe3+/Fe2+ electron transfer. In contrast Cu–BTC/GCE, SiW11Co@Cu–BTC/GCE, and SiW11Co@Cu–BTC/MWCNTs-COOH/GCE exhibited two redox couples (I/I′ and II/II′). The I/I′ redox couple is likely associated with Fe3+/Fe2+ and Cu2+/Cu+ electron transfers, while the II/II′ couple is attributed to Cu+/Cu0 electron transfers.62 However, the peak current (ip) and peak-to-peak potential separation (ΔEp) for the I/I′ redox couple of the bare GCE were altered after modification. The electron-transfer kinetics of the Fe(CN)63−/4− redox couple at the surface of the modified GCEs is influenced by the electronic structure and thickness of the modifier layer.
As shown in Fig. S2-A (ESI†), the bare GCE exhibits a well-defined redox couple with a ΔEp 70.81 mV, and ipc 1.40 μA in 0.5 mM Fe(CN)63−/4− solution (pH 3) (curve a). However, a greater ΔEp (126.95 mV) originates accompanied by decreasing ipc (0.96 μA) at the SiW11Co/GCE (Fig. S2-A, curve b, ESI†). The SiW11Co modifier acting as a protective barrier on the GCE effectively obstructs the electron-transfer process between the surface of the electrode and [Fe(CN)6]3−/4− redox probe. The SiW11Co@Cu–BTC/GCE (Fig. S2-A, curve c, ESI†) shows a smaller ΔEp (87.89 mV) and more extensive ipc (3.35 μA) than the SiW11Co/GCE and Cu–BTC/GCE (Fig. S2-A, curves b and d, ESI†). The better electrochemical behavior of the SiW11Co@Cu–BTC/GCE versus SiW11Co, and Cu–BTC films can be credited to the synergistic interaction between the POM, and MOF blocks. As illustrated in Fig. S2-A, curve e (ESI†), the MWCNTs-COOH/GCE exhibits a substantial background current with more ΔEp (102.54 mV) than the bare GCE. But with immobilizing the SiW11Co@Cu–BTC on the MWCNTs-COOH substrate, ΔEp decreases and ip increases (Fig. S2-A, curve f, ESI†). Therefore, the SiW11Co@Cu–BTC/MWCNTs-COOH/GCE demonstrates superior electrochemical performance due to the synergistic influence of the POM, MOF, and MWCNTs-COOH substrate. The extracted electrochemical parameters from these voltammograms for the I/I′ redox couple are tabulated in Table 2.
| Electrode | ΔEp/mV ± SDa | |ipc|/μA ± SDa | i pa/μA ± SDa |
|---|---|---|---|
| a SD: Standard deviation (from 3 data point). | |||
| Bare GCE | 70.81 ± 1.2 | 1.40 ± 0.18 | 1.44 ± 0.13 |
| SiW11Co/GCE | 126.95 ± 1.1 | 0.96 ± 0.06 | 0.83 ± 0.08 |
| SiW11Co@Cu–BTC/GCE | 87.89 ± 2.1 | 3.35 ± 0.17 | 3.86 ± 0.14 |
| Cu–BTC/GCE | 90.33 ± 0.9 | 2.73 ± 0.15 | 4.19 ± 0.12 |
| MWCNTs-COOH/GCE | 102.54 ± 1.1 | 4.38 ± 0.19 | 4.56 ± 0.17 |
| SiW11Co@Cu–BTC/MWCNTs-COOH/GCE | 80.57 ± 1.4 | 23.82 ± 0.16 | 22.78 ± 0.18 |
Moreover, EIS serves as a robust analytical tool for examining the interfacial properties of electrochemical sensors.63 Fig. S2-B (ESI†) displays the Nyquist plots for the bare GCE, SiW11Co/GCE, and SiW11Co@Cu–BTC/MWCNTs-COOH/GCE. The bare GCE and SiW11Co@Cu–BTC/MWCNTs-COOH/GCE did not exhibit any semi-circle in the Nyquist plot, likely due to the high electrical conductivity of these surfaces and the specific solution conditions. However, the charge-transfer resistance (Rct) values for the bare and modified GCEs were calculated by fitting an equivalent electrical circuit. Upon modification with SiW11Co, a semi-circle appeared in the Nyquist plot of SiW11Co/GCE, and the Rct value increased significantly from 780 Ω to 121 kΩ. This substantial increase is attributed to the low electrical conductivity of SiW11Co and the electrostatic repulsion between the negatively charged SiW11Co and the [Fe(CN)6]3−/4− redox probe. Notably, after modification with SiW11Co@Cu–BTC/MWCNTs-COOH, the Rct decreased to 430 Ω. This decrease indicates the formation of a conductive adsorbed layer, which enhances electron transfer between the redox couple and the electrode surface. The reduced Rct for SiW11Co@Cu–BTC/MWCNTs-COOH/GCE compared to SiW11Co/GCE can be attributed to the superior conductivity and electronic properties of the Cu–BTC and MWCNTs-COOH components.
3.3. Electro-active surface area of SiW11Co@Cu–BTC/MWCNTs-COOH/GCE
The electro-active surface area of the SiW11Co@Cu–BTC/MWCNTs-COOH/GCE was calculated and then compared with bare GCE, SiW11Co/GCE, Cu–BTC/GCE, SiW11Co@Cu–BTC/GCE, MWCNTs-COOH/GCE, and using the Randles–Sevcik equation (Eqn (1)) by the CV method in 0.5 mM [Fe(CN)6]3−/4− solution in 0.01 M PBS (pH 3) containing 0.1 M KCl at various scan rates.64,65 CVs were presented in the ESI,† Fig. S3 (ESI†).| ip = 2.69 × 10⁵n3/2AeffD01/2ν1/2Cp | (1) |
3.4. Electrocatalytic properties of SiW11Co@Cu–BTC/MWCNTs-COOH/GCE
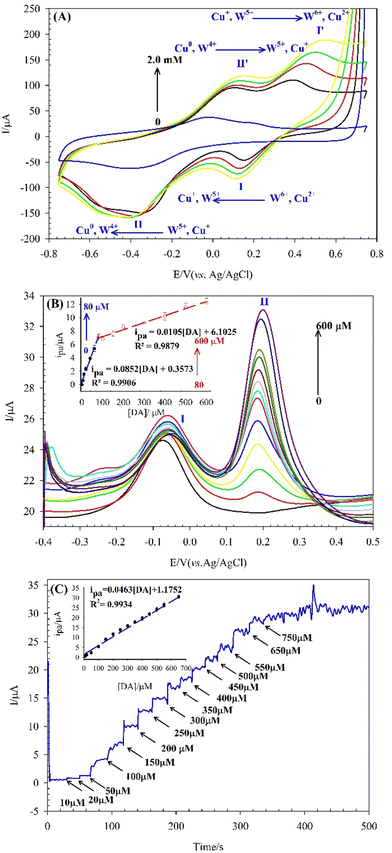
Fig. 6A shows the CVs of the SiW11Co@Cu–BTC/MWCNTs-COOH/GCE in 0.04 M BRB (pH 7) containing DA at different concentrations (0 to 2.0 mM) in the 0.75 to −0.75 V potential range. The findings reveal that the SiW11Co@Cu–BTC/MWCNTs-COOH/GCE exhibits significant potential for DA detection, as evidenced by the progressive increase in two anodic peak currents (peaks I′ and II′) with rising DA concentrations. Peaks I′ and II′ correspond to two consecutive one-electron transfer processes of W4+ → W5+ → W6+ along with Cu0 → Cu+ → Cu2+ electron transfer processes. These electron transfers facilitate the oxidation of DA, confirming a reciprocal electrocatalytic interaction between the modifier and DA. Moreover, with the addition of DA, a new redox pair (I, I′ peak) appears, which demonstrates a reciprocal electrocatalytic interaction between the modifier and DA.However, the CV method, despite being a widely used technique for electrochemical analysis, is unable to satisfy the required conditions for quantitative analysis due to inherent limitations such as low sensitivity and high LOD. Utilizing square wave voltammetry (SWV) and chronoamperometry methods, which offer advantages such as low LOD and high sensitivity, ensured precise measurements for the DA sensing at the SiW11Co@Cu–BTC/MWCNTs-COOH/GCE.
In Table 3, a comparison is made between the LOD, linearity range values, pH and potential of the present sensor and other literature studies for the determination of DA. The tabulated results display that although the LOD of SiW11Co@Cu–BTC/MWCNTs-COOH/GCE is slightly higher than some studies, it responds to DA in a wider linear range.
| Modified electrode | Sweep mode | pH | E (V vs. Ag/AgCl) | linearity range (μM) | LOD (μM) | Ref. |
|---|---|---|---|---|---|---|
| a Graphene. b Differential pulse voltammetry. c Poly(amido-amine). d Au nanoparticle. e Palladium nanocube. f Nafion. g β-cyclodextrin. h Cu3(BTC)2. | ||||||
| Pt-CNT-GRa/GCE | DPVb | 7.0 | 0.12 | 0.1–30 | 0.01 | 66 |
| rGO/PAMAMc/MWCNT/AuNPd/GCE | DPV | 4.0 | 0.36 | 10–320 | 3.33 | 67 |
| Pd-NCe/rGO/GCE | I–t | 7.4 | 0.25 | 20–220 | 7.02 | 68 |
| LiMnPO4/f-MWCNT/GCE | DPV | 7.0 | 0.16 | 0.1–49 | 0.019 | 69 |
| NAf/MWCNTs-β-CDg/GCE | DPV | 7.0 | 0.14 | 0.01–1 | 0.005 | 70 |
| 1–10 | ||||||
| GCE-ERGO/polyCoTAPc | DPV | 7.4 | 0.012 | 2–100 | 0.095 | 71 |
| [P2W17V/CS]6/ITO-GCE | I–t | 7.0 | 0.57 | 0.01–300 | 0.18 | 72 |
| HKUST-1h/GCE | DPV | 6.0 | 0.39 | 0.5–100 | 0.15 | 73 |
| MOFs/ERGO-GCE | DPV | 6.0 | 0.2 | 0.2–300 | 0.013 | 74 |
| Fe-MOF/GCE | DPV | 7.0 | 0.22 | 10–90 | 3.34 | 75 |
| SiWCo/Cu–BTC/MWCNTs-COOH-GCE | SWV | 7.0 | 0.20 | 5–80 | 2.35 | Present study |
| 80–600 | ||||||
| I–t | 0.25 | 10–650 | 2.68 | |||
3.5. Electro-oxidation mechanism of DA
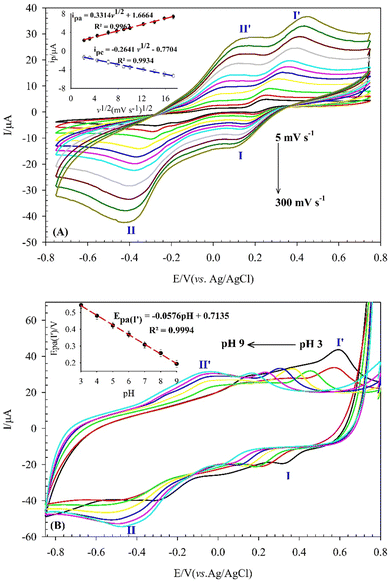
The mechanism of DA electro-oxidation at the SiW11Co@Cu–BTC/MWCNTs-COOH/GCE was proposed by examining the effects of scan rate and pH on the ip and Ep, respectively. Fig. 7A shows the CVs of 0.5 mM DA in 0.04 M BRB (pH 7) at the SiW11Co@Cu–BTC/MWCNTs-COOH/GCE, recorded at various scan rates (5–300 mV s−1). The anodic and cathodic peak currents (peaks I, I′) of DA exhibited a linear relationship with the square root of the scan rate (ν1/2) (inset of Fig. 7A). The linear regression equations for the anodic and cathodic peak currents were ipa(μA) = 0.3314ν1/2 (mV1/2s−1/2) + 1.6664 (R2 = 0.9962) and ipc(μA) = −0.2641ν1/2 (mV1/2 s−1/2) − 0.7704 (R2 = 0.9934), respectively. These results support the conclusion that the electro-oxidation of DA at the SiW11Co@Cu–BTC/MWCNTs-COOH/GCE is a diffusion-controlled redox process, where the oxidation reaction is governed by the diffusion rate of DA from the electrolyte to the electrode surface.The influence of pH on the Epa of 200 μM DA was studied by the CV method over a pH range from 3 to 9 in a BRB solution, as depicted in Fig. 7B. The results show a progressive shift of the Epa towards more negative values as the pH increased from 3 to 9. This finding confirms that DA oxidation at the SiW11Co@Cu–BTC/MWCNTs-COOH/GCE involves a proton-mediated catalytic process.76 A pronounced relationship was discerned between the Epa and pH with the linear equation of Epa (V) = −0.0576 pH + 0.7135 (R2 = 0.9994) (inset of Fig. 7B). The obtained slope value of 57.6 mV pH−1 is near the theoretical value of 59.2 mV pH−1. This confirms that the electro-oxidation of DA at the SiW11Co@Cu–BTC/MWCNTs-COOH/GCE is balanced, with equal contributions from protons and electrons. Additionally, as shown in Fig. S4 (ESI†), both the POM and MOF components contribute to the electro-oxidation of DA. The proposed mechanism of DA electro-oxidation is shown in Scheme 2. For simplicity and clarity, only the relevant part of the modifier involved in the electron transfer is represented in the mechanism. Moreover, the oxidation states of W and Cu atoms are specified to provide a clearer illustration of the electron transfer process within the modifier. However, DA electrocatalytic oxidation at the nanohybrid-modified GCE can be explained as follows: the [SiW4VW7VICo@CuxICuyII–BTC] portion of the modifier undergoes electro-oxidation to [SiW3VW8VICo@Cux−1ICuy+1II–BTC], which subsequently facilitates the oxidation of DA to dopamine-quinone (DQ).
3.6. Repeatability, reproducibility, and stability studies
The repeatability, reproducibility, and stability of the modified GCE were investigated under the optimal conditions. Repeatability and reproducibility are vital indicators of the quality of experiments and analyses. To evaluate the repeatability of the sensor, six different CVs with one modified GCE were performed in 0.04 M BRB (pH 7) containing 0.5 mM DA. The reproducibility has been studied by six modified GCEs under similar conditions. The obtained results are given in the ESI† (Fig. S5-A and B, ESI†). The relative standard deviation (RSD) of the obtained voltammetry peak current for the repeatability and reproducibility were 3.61% and 4.39%, respectively, indicating that the prepared sensor has excellent precision.Developing stable sensors and biosensors is one of the most essential objectives of analytical chemists. The modified electrodes based on POMs are generally known for their instability in aqueous media, which can lead to detachment from the electrode surface and subsequent dissolution in the electrolyte. Consequently, the stability of the SiW11Co@Cu–BTC/MWCNTs-COOH/GCE is a critical factor for the assessment to ensure reliable electrochemical performance.
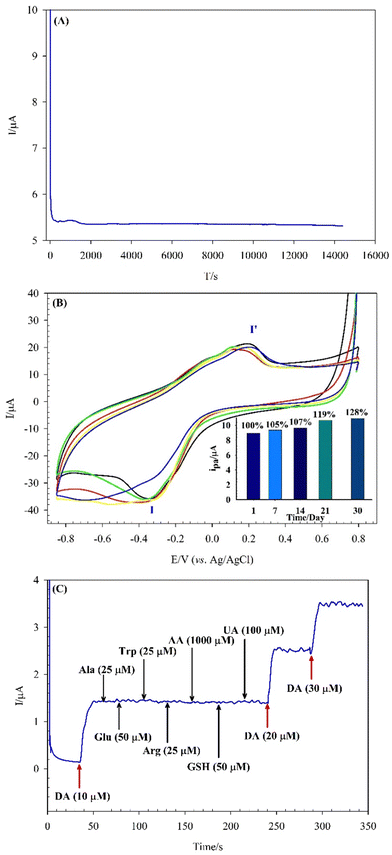
Fig. 8A shows the stability of the sensor by the amperometry method in 0.04 M BRB (pH 7) containing 100 μM DA. Moreover, in Fig. 8B the long-term stability of the sensor was displayed in air at ambient temperature (25 ± 2 °C) over a period of 30 days. The peak I′ current of the SiW11Co@Cu–BTC/MWCNTs-COOH/GCE shows a progressive increase, a 5% increase after 7 days, followed by a 7% increase after 14 days, a 19% increase after 21 days, and a final 28% increase after one month. These results confirmed that the SiW11Co@Cu–BTC/MWCNTs-COOH/GCE has excellent stability that can be credited to the encapsulation of the SiW11Co on Cu–BTC framework and also immobilization of the SiW11Co@Cu–BTC compound on the MWCNTs-COOH surface, which contributes to stabilizing POMs in aqueous media and improves the electrochemical performance of the modified GCE.
3.7. Interference study
Selectivity is a crucial attribute for sensors, as it denotes the sensor's ability to distinguish the target analyte from other species in a complex mixture. The chronoamperometry method was employed to investigate the potential effects of interfering species on the detection of 10 μM DA by injecting these substances into a 0.04 M BRB (pH 7) at an optimum potential of +0.25 V. As displayed in Fig. 8C, no significant changes in current are observed for each addition of ascorbic acid (AA) at 100-fold, uric acid (UA) at 10-fold, glucose (Glu) and glutathione (GSH) at 5-fold, and alanine (Ala), arginine (Arg) and tryptophan (Trp) at 2.5-fold concentrations of DA. However, a noteworthy increase in the current was recorded with more injection of DA (20 and 30 μM), which shows the excellent selectivity of the proposed sensor. The SiW11Co@Cu–BTC/MWCNTs-COOH/GCE exhibits superior selectivity in the oxidation of DA due to the unique structural features of the modifier and the optimization of the operating conditions, such as pH level and oxidation potential.3.8. Analytical application
The analytical applicability of the SiW11Co@Cu–BTC/MWCNTs-COOH/GCE was evaluated through the detection of different concentrations of DA in a dopadic ampoule, and human blood serum samples. The preparation of the dopadic sample involved the injection of 2 μL of this sample into 10 mL of a 0.04 M BRB solution (pH 7.0). In the following, the prepared solution was transferred directly into the electrochemical cell without any pretreatment procedures. For the preparation of the blood serum sample, first for deproteinization of serum, 0.5 mL HClO4 (2 M) was added to 1.0 mL of the sample and stirred for 1 minute.77 In the next step, the prepared sample was centrifuged at 1500 rpm for 10 minutes, and then diluted 20-times with 0.04 M BRB (pH 7.0) and transferred into the electrochemical cell.Then the prepared samples (dopadic and human blood serum) were used for analysis of dopamine by SWV at the applied potential of −0.4 to +0.8 V using the standard addition method. The obtained data from the experiments are listed in Table 4. The recovery values approach near 100% with RSD less than 5% showing that this sensor is suitable for DA detection in biological fluids and the precise control of DA concentration in drugs.
| Sample | Originally (μM) | Added (μM) | Found (μM) | Recovery (%) | RSD (%) |
|---|---|---|---|---|---|
| a Human blood serum (female, 32 years old). b Not detected. | |||||
| Dopadic | 55 | 0 | 55.23 | 100.42 | 2.51 |
| 50 | 106.26 | 101.20 | 3.24 | ||
| 100 | 156.13 | 100.73 | 4.22 | ||
| 200 | 254.21 | 99.69 | 3.65 | ||
| Human blood seruma | — | 0 | NDb | — | — |
| 10 | 10.13 | 101.30 | 2.67 | ||
| 20 | 20.57 | 102.85 | 2.49 | ||
| 40 | 40.85 | 102.12 | 3.61 | ||
4. Conclusions
A novel sensor based on a tri-component nanocomposite (SiW11Co@Cu–BTC/MWCNTs-COOH/GCE) was designed, characterized, and employed as an efficient catalyst for the electro-oxidation of DA. The sensor offers several key advantages, including rapid and simple fabrication, low LOD, a wide linear range, outstanding stability, and excellent repeatability, reproducibility, and selectivity. These superior properties are attributed to the enhanced electroactive surface area of the SiW11Co@Cu–BTC/MWCNTs-COOH/GCE (92.65 cm2), resulting from the synergistic effect of SiW11Co, Cu–BTC, and MWCNTs-COOH, combined with its porous structure. Furthermore, this sensor can be effectively used for precise DA measurement in biological fluids and pharmaceutical samples, making it highly suitable for high-performance DA detection.Data availability
All relevant data presented in this article is present in the form of figures and tables in the manuscript.Conflicts of interest
There are no conflicts to declare.Acknowledgements
The authors gratefully acknowledge the financial support of the Research Council of the University of Hormozgan.References
- L. Wang, T. Meng, J. Sun, S. Wu, M. Zhang, H. Wang and Y. Zhang, Anal. Chim. Acta, 2019, 1047, 28–35 CrossRef CAS PubMed.
- J. Sun, S. Abednatanzi, P. Van Der Voort, Y.-Y. Liu and K. Leus, Catalysts, 2020, 10, 578 CrossRef CAS.
- M. Samaniyan, M. Mirzaei, R. Khajavian, H. Eshtiagh-Hosseini and C. Streb, ACS Catal., 2019, 9, 10174–10191 CrossRef CAS.
- E. Rtibi, M. Abderrabba, S. Ayadi and B. Champagne, Inorg. Chem., 2019, 58, 11210–11219 CrossRef CAS PubMed.
- J. M. Clemente-Juan, E. Coronado and A. Gaita-Ariño, Chem. Soc. Rev., 2012, 41, 7464–7478 RSC.
- S. Dianat, A.-K. Bordbar, S. Tangestaninejad, B. Yadollahi, R. Amiri, S.-H. Zarkesh-Esfahani and P. Habibi, J. Inorg. Biochem., 2015, 152, 74–81 CrossRef CAS PubMed.
- S. Dianat, A. Bordbar, S. Tangestaninejad, S. Zarkesh-Esfahani, P. Habibi and A. A. Kajani, J. Iran. Chem. Soc., 2016, 13, 1895–1904 CrossRef CAS.
- Y. Zhang, J. Liu, S.-L. Li, Z.-M. Su and Y.-Q. Lan, EnergyChem, 2019, 1, 100021 CrossRef.
- B. Lu, S. Li, J. Pan, L. Zhang, J. Xin, Y. Chen and X. Tan, Inorg. Chem., 2020, 59, 1702–1714 CrossRef CAS PubMed.
- F. Duan, X. Liu, D. Qu, B. Li and L. Wu, CCS Chem., 2021, 3, 2676–2687 CrossRef CAS.
- X. Yang, C. Zhu, L. Zeng, W. Xue, L. Zhang, L. Zhang, K. Zhao, M. Lyu, L. Wang and Y.-Z. Zhang, Chem. Sci., 2022, 13, 5920–5928 RSC.
- A. Karimi-Takallo, S. Dianat and A. Hatefi-Mehrjardi, J. Electroanal. Chem., 2021, 886, 115139 CrossRef CAS.
- M. Sharifi, S. Dianat and A. Hosseinian, RSC Adv., 2021, 11, 8993–9007 RSC.
- S.-H. Ge, L.-P. Cui, K. Yu, M.-L. Wang, C.-M. Wang, L.-X. Guo and B.-B. Zhou, Tungsten, 2023, 5, 270–276 CrossRef.
- H. Ravanbakhsh and S. Dianat, Sens. Bio-Sens. Res., 2023, 40, 100556 CrossRef.
- F. Boussema, R. Haddad, Y. Ghandour, M. S. Belkhiria, M. Holzinger, A. Maaref and S. Cosnier, Electrochim. Acta, 2016, 222, 402–408 CrossRef CAS.
- Q. Wang, J. Khungwa, L. Li, Y. Liu, X. Wang and S. Wang, J. Electroanal. Chem., 2018, 824, 91–98 CrossRef CAS.
- H. Ravanbakhsh, S. Dianat and A. Hosseinian, RSC Adv., 2022, 12, 9210–9222 RSC.
- R. Hashemniaye-Torshizi, N. Ashraf, M. H. Arbab-Zavar and S. Dianat, Catal. Sci. Technol., 2021, 11, 1098–1109 RSC.
- P. Shestakova, M. Popova, A. Szegedi, H. Lazarova, T. K. N. Luong, I. Trendafilova, J. Mihaly and T. N. Parac-Vogt, Microporous Mesoporous Mater., 2021, 323, 111203 CrossRef CAS.
- J. Selvam, B. Samannan, P. Peter and J. Thavasikani, Polym. Polym. Compos., 2021, 29, 373–382 CAS.
- S. Li, X. Tan, M. Yue, L. Zhang, D. Chai, W. Wang, H. Pan, L. Fan and C. Zhao, Chem. Commun., 2020, 56, 15177–15180 RSC.
- J. Annamalai, P. Murugan, D. Ganapathy, D. Nallaswamy, R. Atchudan, S. Arya, A. Khosla, S. Barathi and A. K. Sundramoorthy, Chemosphere, 2022, 298, 134184 CrossRef CAS PubMed.
- M. Bonneau, C. Lavenn, P. Ginet, K.-i Otake and S. Kitagawa, Green Chem., 2020, 22, 718–724 RSC.
- M. X. Wu and Y. W. Yang, Adv. Mater., 2017, 29, 1606134 CrossRef PubMed.
- J. Cao, X. Li and H. Tian, Curr. Med. Chem., 2020, 27, 5949–5969 CrossRef CAS PubMed.
- Y. Y. Cai, Q. Yang, Z. Y. Zhu, Q. H. Sun, A. M. Zhu, Q. G. Zhang and Q. L. Liu, J. Membr. Sci., 2019, 590, 117277 CrossRef CAS.
- Z.-Q. Shi, N.-N. Ji, M.-H. Wang and G. Li, Inorg. Chem., 2020, 59, 4781–4789 CrossRef CAS PubMed.
- E. D. Spoerke, L. J. Small, M. E. Foster, J. Wheeler, A. M. Ullman, V. Stavila, M. Rodriguez and M. D. Allendorf, J. Phys. Chem. C, 2017, 121, 4816–4824 CrossRef CAS.
- J. Dou, C. Zhu, H. Wang, Y. Han, S. Ma, X. Niu, N. Li, C. Shi, Z. Qiu and H. Zhou, Adv. Mater., 2021, 2102947 CrossRef CAS PubMed.
- S. Gao, Y. Sui, F. Wei, J. Qi, Q. Meng and Y. He, J. Mater. Sci., 2018, 53, 6807–6818 CrossRef CAS.
- Y. Wang, Y. Liu, H. Wang, W. Liu, Y. Li, J. Zhang, H. Hou and J. Yang, ACS Appl. Energy Mater., 2019, 2, 2063–2071 CrossRef CAS.
- D. Wang, D. Jana and Y. Zhao, Acc. Chem. Res., 2020, 53, 1389–1400 CrossRef CAS PubMed.
- A. Bieniek, A. P. Terzyk, M. Wiśniewski, K. Roszek, P. Kowalczyk, L. Sarkisov, S. Keskin and K. Kaneko, Prog. Mater. Sci., 2021, 117, 100743 CrossRef CAS.
- K. Shen, X. Chen, J. Chen and Y. Li, ACS Catal., 2016, 6, 5887–5903 CrossRef CAS.
- H. T. Nguyen, D. N. Doan and T. Truong, J. Mol. Catal. A: Chem., 2017, 426, 141–149 CrossRef CAS.
- Q. Wang and D. Astruc, Chem. Rev., 2019, 120, 1438–1511 CrossRef PubMed.
- K. N. Chappanda, O. Shekhah, O. Yassine, S. P. Patole, M. Eddaoudi and K. N. Salama, Sens. Actuators, B, 2018, 257, 609–619 CrossRef CAS.
- L. Wang, Z. Hu, S. Wu, J. Pan, X. Xu and X. Niu, Anal. Chim. Acta, 2020, 1121, 26–34 CrossRef CAS PubMed.
- L. Chen and Q. Xu, Matter, 2019, 1, 57–89 CrossRef.
- L.-J. Xu, C.-M. Wang, K. Yu, C.-X. Wang and B.-B. Zhou, Coord. Chem. Rev., 2023, 481, 215044 CrossRef CAS.
- S. N. Nobar, Mater. Chem. Phys., 2018, 213, 343–351 CrossRef.
- S. S.-Y. Chui, S. M.-F. Lo, J. P. Charmant, A. G. Orpen and I. D. Williams, Science, 1999, 283, 1148–1150 CrossRef CAS PubMed.
- Y. Song, M. Xu, C. Gong, Y. Shen, L. Wang, Y. Xie and L. Wang, Sens. Actuators, B, 2018, 257, 792–799 CrossRef CAS.
- M. Saraf, R. Rajak and S. M. Mobin, J. Mater. Chem. A, 2016, 4, 16432–16445 RSC.
- T. Shen, T. Liu, H. Mo, Z. Yuan, F. Cui, Y. Jin and X. Chen, RSC Adv., 2020, 10, 22881–22890 RSC.
- Z. Meng, M. Li, X. Liu and Z. Lei, J. Mater. Sci.: Mater. Electron., 2019, 30, 18617–18625 CrossRef CAS.
- W. Meng, S. Xu, L. Dai, Y. Li, J. Zhu and L. Wang, Electrochim. Acta, 2017, 230, 324–332 CrossRef CAS.
- M. Hosseini, S. Zeinali and M. Sheikhi, Sens. Actuators, B, 2016, 230, 9–16 CrossRef CAS.
- L. Ji, J. Hao, K. Wu and N. Yang, J. Phys. Chem. C, 2019, 123, 2248–2255 CrossRef.
- L. Ji, Q. Cheng, K. Wu and X. Yang, Sens. Actuators, B, 2016, 231, 12–17 CrossRef CAS.
- Y. Cao, L. Wang, C. Shen, C. Wang, X. Hu and G. Wang, Sens. Actuators, B, 2019, 283, 487–494 CrossRef CAS.
- C. Wang, M. Zhou, Y. Ma, H. Tan, Y. Wang and Y. Li, Chem. – Asian J., 2018, 13, 2054–2059 CrossRef CAS PubMed.
- Y. Zhang, Y. Zhang, L. Li, J. Chen, P. Li and W. Huang, J. Electroanal. Chem., 2020, 861, 113939 CrossRef CAS.
- L. Yu, K. Ning, W. Chunmei, Y. Kai, L. Jinghua, W. Chunxiao and Z. Baibin, Dalton Trans., 2022, 51, 7613–7621 RSC.
- L. Xu, X. Zhao, K. Yu, C. Wang, J. Lv, C. Wang and B. Zhou, CrystEngComm, 2022, 24, 5614–5621 RSC.
- D. Rudakiya, Y. Patel, U. Chhaya and A. Gupte, Nanotechnology for Agriculture: Advances for Sustainable Agriculture, 2019, pp. 121–130 Search PubMed.
- X. Kong, Y. Wang, Q. Zhang, T. Zhang, Q. Teng, L. Wang, H. Wang and Y. Zhang, J. Colloid Interface Sci., 2017, 505, 615–621 CrossRef CAS PubMed.
- J. Jiao, J. Zuo, H. Pang, L. Tan, T. Chen and H. Ma, J. Electroanal. Chem., 2018, 827, 103–111 CrossRef CAS.
- T. J. Weakley and S. Malik, J. Inorg. Nucl. Chem., 1967, 29, 2935–2944 CrossRef CAS.
- T. Wei, M. Zhang, P. Wu, Y.-J. Tang, S.-L. Li, F.-C. Shen, X.-L. Wang, X.-P. Zhou and Y.-Q. Lan, Nano Energy, 2017, 34, 205–214 CrossRef CAS.
- M. Vepsäläinen, M. Chen, Y. Yang, R. Brokenshire and T. Muster, J. Appl. Electrochem., 2014, 44, 1135–1143 CrossRef.
- H. S. Magar, R. Y. Hassan and A. Mulchandani, Sensors, 2021, 21, 6578 CrossRef CAS PubMed.
- Z. Liu, M. Jin, J. Cao, J. Wang, X. Wang, G. Zhou, A. van den Berg and L. Shui, Sens. Actuators, B, 2018, 257, 1065–1075 CrossRef CAS.
- D. Zhu, H. Ma, Q. Zhen, J. Xin, L. Tan, C. Zhang, X. Wang and B. Xiao, Appl. Surf. Sci., 2020, 526, 146721 CrossRef CAS.
- S. Ramakrishnan, K. Pradeep, A. Raghul, R. Senthilkumar, M. Rangarajan and N. K. Kothurkar, Anal. Methods, 2015, 7, 779–786 RSC.
- S. Wang, W. Zhang, X. Zhong, Y. Chai and R. Yuan, Anal. Methods, 2015, 7, 1471–1477 RSC.
- Y.-S. Hsieh, B.-D. Hong and C.-L. Lee, Microchim. Acta, 2016, 183, 905–910 CrossRef CAS.
- R. Nehru and S. M. Chen, RSC Adv., 2018, 8, 27775–27785 RSC.
- S. Rong, P. Zhang, L. Zou, Y. Tian, M. Miao, D. Jia, R. Qiu, F. Qi, H. Ma and H. Pan, IEEE Sens. J., 2022, 22, 5540–5547 CAS.
- C. Luhana and P. Mashazi, Electrocatalysis, 2022, 14, 406–417 CrossRef.
- X. Wang, Y. Zhao, D. Zhang, S. Rong and H. Ma, Int. J. Electrochem. Sci., 2019, 14, 3595–3609 CrossRef CAS PubMed.
- J. Li, J. Xia, F. Zhang, Z. Wang and Q. Liu, J. Chin. Chem. Soc., 2018, 65, 743–749 CrossRef CAS.
- B. Ma, H. Guo, M. Wang, L. Li, X. Jia, H. Chen, R. Xue and W. Yang, Electroanalysis, 2019, 31, 1002–1008 CrossRef CAS.
- K. Liu, Y. Chen, X. Dong and H. Huang, Inorg. Chem. Commun., 2022, 142, 109584 CrossRef CAS.
- S. Ahmadi Direstani and S. Dianat, Mater. Adv., 2023, 4, 5761–5774 RSC.
- R. Karimi Shervedani, S. Bahrani, M. Samiei Foroushani and F. Momenbeik, Electroanalysis, 2017, 29, 272–279 CrossRef CAS.
Footnote |
| † Electronic supplementary information (ESI) available. See DOI: https://doi.org/10.1039/d4ma00940a |
| This journal is © The Royal Society of Chemistry 2024 |

