 Open Access Article
Mechanochemical synthesis of zinc-doped hydroxyapatite for tunable micronutrient release†
Mohamed
Ammar
a,
Ricardo
Bortoletto-Santos
b,
Caue
Ribeiro
 c,
Lihua
Zhang
d and
Jonas
Baltrusaitis
 *a
*a
aDepartment of Chemical and Biomolecular Engineering, Lehigh University, 111 Research Dr, Bethlehem, PA 18015, USA. E-mail: job314@lehigh.edu; Tel: +1-610-658-6836
bPostgraduate Program in Environmental Technology, University of Ribeirão Preto (UNAERP), Avenida Costábile Romano, 2201, Ribeirão Preto, SP, 14096-900, Brazil
cEmbrapa Instrumentation, Rua XV de Novembro 1452, São Carlos, SP, 13560–970, Brazil
dBrookhaven National Laboratory, Center for Functional Nanomaterials, Upton, NY 11973, USA
First published on 23rd April 2024
Abstract
Mechanochemical synthesis of Zn-laden calcium hydroxyapatite (HAP) nanocrystals was performed from a chemically precipitated monetite/brushite precursor. ZnCO3 served as the Zn2+ source. Powder XRD results showed that up to 15% ZnCO3 can be incorporated into the HAP lattice during the mechanochemical transformation of the precursors. The resulting spectral properties, as investigated using Raman and infrared spectroscopy, showed stark differences between the mechanochemically prepared sample and the control HAP and ZnCO3 mixed sample. In particular, a peak at 874 cm−1 was observed in infrared and assigned to the HAP-incorporated carbonate ion C–O (ν2) vibration as opposed to ZnCO3 at 834 cm−1 indicating that not only Zn2+ but also CO32− is incorporated into the HAP lattice. Distinct thermal properties were also observed in the thermal analysis of mechanochemically reacted Zn-HAP with the endothermic peak at 235 °C completely absent as opposed to the mixed control of HAP and ZnCO3. Electron microscopy analysis showed ∼10 × 40 nm HAP nanocrystals formed with a uniform Zn2+ ion distribution within them, especially at low 5% ZnCO3 loading. Zn2+ dissolution experiments in soil-relevant 2% citric acid solution showed a distinct delayed dissolution pattern of mechanochemically obtained Zn-HAP with six-fold slower dissolution than that of mixed HAP and ZnCO3, a commonly used zinc supplement. This study presents room-temperature synthesis methods of plant nutrient-laden HAP with tunable dissolution kinetics needed for efficient nutrient uptake.
1 Introduction
Mineral fertilizers contain major and minor nutrients necessary for plant development.1 Therefore, tuning fertilizer formulations to achieve specific nutrient release patterns is critical for agricultural productivity.2 Developing new fertilizer formulations to facilitate agricultural sustainability on a large scale, via engineered nanomaterials, is essential to achieve global food security.3 Phosphorus (P) is a critical but limiting nutrient that plays a major role in DNA formation, cellular energy, and cell membranes.4,5 Low phosphate ion solubility in soil increases P retention and saturation. In recent years, hydroxyapatite (HAP) emerged as a tunable P-release fertilizer material.6–10 The use of HAP as a tunable P-fertilizer, particularly in nanoparticulate form, offers advantages such as environmental stability and reduced soil acidification risk.11,12 Importantly, P release from HAP particles can be tuned by altering their particle size and surface charge properties, thus providing opportunities for designing multifunctional fertilizers, not only for major (N, P, and K) but also for minor (Cu, Zn, Mo, and others) nutrient delivery, according to the needs of specific soil and crop types. Such controlled release of nutrients is crucial to reducing chemical pollution and maximizing fertilizer use.13,14 In addition, using HAP nano-fertilizers can enhance nutrient use efficiency as the small particle size increases the surface area available for nutrient interactions and uptake by plant roots or leaves.15 Finally, HAP nano-fertilizers have the advantage of being versatile in their application. They can be applied through various methods such as soil incorporation, foliar spraying, or seed coating, allowing for targeted and efficient nutrient delivery based on the specific requirements of different crops and growth stages.8 Excellent synthetic HAP procedures have been developed using conventional chemical processes and emerging mechanochemical reactions.14,16Chemically pure HAP crystallizes in the hexagonal form with a space group P63/m with a(b) = 0.942 nm, c = 0.688 nm, α = β = 90, and γ = 120.17–20 The hydroxide ions in hexagonal HAP appear more disordered inside each row than in monoclinic form moving either downward or upward in the structure.18 This behavior creates strains in the hexagonal lattice that might be compensated for by ionic substitutions or vacancies. Structural substitutions in HAP can drastically alter its physicochemical and nutrient release properties. For example, doping HAP with divalent metal ions, such as zinc (Zn2+), previously afforded antibacterial properties that reduced inflammation and promoted new bone development.21 Zn-substituted HAP materials as multi-nutrient carriers are far less explored, yet very valuable. Zn is classified as a micronutrient and is pivotal in diverse plant processes encompassing reproduction, water absorption, and functioning as a catalyst for various enzymatic activities.22 The deficiency of this essential micronutrient leads to the disruption of enzyme functionality, posing a direct impediment to various physiological processes fundamental to plant development.23,24 This fundamental status underscores its indispensable contribution to plant development and growth, ultimately shaping vital aspects like photosynthesis and overall plant maturation. However, a simple Zn supplement of P-fertilizers is not straightforward. Zn and P undergo antagonistic interactions where high P application rates without adequate Zn can reduce Zn uptake by the roots and induce Zn deficiency, thus decreasing plant growth and yields.25 In this regard, composite HAP materials that can act as a carrier for Zn facilitating their controlled release and gradual availability to plants become critical and can serve as a model system for other micronutrient delivery. HAP nanoparticles can function as a carrying matrix for Zn and a P supply, which is required for root formation during the early phases of plant growth.23
In general, mechanochemical synthesis of pure HAP has been widely used before. Gergely et al. successfully synthesized HAP from eggshells through milling techniques. They obtained multiphase powder containing CaCO3, CaO, H3PO3, CaHPO4, and HAP.26 In addition, HAP has been obtained from seashells via mechanochemical synthesis by Pal et al. The product also was a multiphase compound with HAP, CaHPO4, and Ca2(P4O12)(H2O)4. Furthermore, HAP morphology was polygonal on the nanoscale.27 Nutrient doped HAP synthesis has be reviewed recently including their mechanochemical preparation routes.14 For example, Suchanek et al. obtained Mg-HAP with other phases using the mechanochemical–hydrothermal method.28 Moreover, Bystrov et al. prepared Mg-HAP by a mechanochemical route and they observed only the pure phase of HAP until a concentration of 2.0 Mg-HAP.29 Several attempts have been made to synthesize Zn-substituted HAP mechanochemically. In particular, Chaikina et al. studied the structural changes of Zn ion-doped HAP synthesized mechanochemically using monetite, CaHPO4, and freshly calcined CaO as precursors and ZnO or Zn(H2PO4)2·2H2O as the Zn source. The results showed that the precursor of Zn ions has a crucial influence on controlling the incorporation of Zn into HAP crystals (Ca(10−x)Znx(PO4)6(OH)2; x = 0.1–2.0) without forming a secondary calcium phosphate phase. Zn-HAP remained in a single crystalline phase up to x ≤ 0.25 using ZnO, monetite and CaO as precursors in a planetary mill.30 Furthermore, Bulina et al. mechanochemically synthesized HAP doped with Cu and Zn. A degree of substitution of up to 2 moles of dopant per mol of HAP was obtained using solid-state mechanochemical synthesis with no secondary phases formed.31 The authors proposed that Zn and Cu cations might replace the Ca2+ ion sites. Y. Tang et al. reported that the most suitable site for Zn is Ca(2) more than Ca(1).32 Further, K. Matsunaga et al. investigated the mechanism of incorporating Zn in HAP. They reported that Ca(2) is the most stable and favorable site to be replaced by Zn.33 Finally, Makarova et al. reported Zn-HAP synthesis within a silicate matrix using mechanochemical techniques34 in the form of Ca10−xZnx(PO4)6−x(SiO4)x(OH)2−x, where x = 0.2, 0.6, 1.0, 1.5, and 2.0 with the single crystalline phase achieved up to x = 1.0. Under high dopant concentrations, the low crystallinity of HAP significantly increased. No Zn dissolution properties were determined in the resulting materials.
Since only a few studies exist on the mechanochemical synthesis approach to single crystalline phase transition metal doped materials, such as Zn-HAP, intriguing questions on synthesis pathways and the nutrient release properties of such materials remain. In this work, we attempted to mechanochemically synthesize Zn-HAP via solid-state transformation of a monetite/brushite precursor formed at a pH of 5 while co-milling with ZnCO3. A range of ZnCO3 concentrations was explored from 5 to 25 weight percent and the resulting materials were characterized using physicochemical methods. Importantly, Zn release patterns under soil-relevant conditions were investigated and showed significantly different dissolution kinetics when compared to ZnCO3 mixed with HAP, suggesting mechanochemical co-processing of solid P and Zn precursors can be used to obtain tunable nutrient release patterns.
2 Materials and methods
2.1 Zn-HAP synthesis
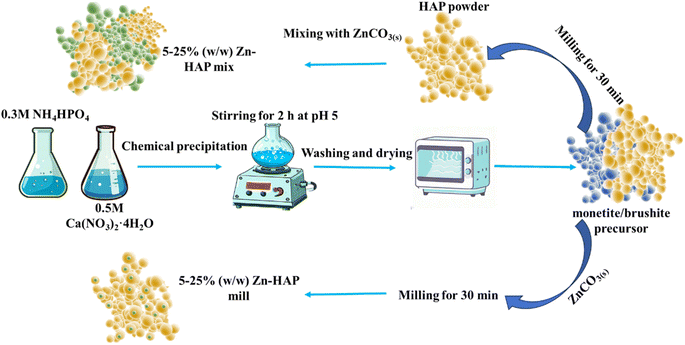
Mechanochemical synthesis was performed in 15 mL stainless steel jars containing 2 zirconia balls while the total powder content was restricted to 200 mg. The ball mass is around 1.15 g, with a diameter of 8 mm. A Retsch MM300 shaker mill operating at 25 Hz was used for 30 min. The extent of the reaction completion was determined using X-ray diffraction (XRD) measurements by systematically increasing the milling time.The chemical precipitation was used to synthesize the monetite/brushite precursor to be mechanochemically converted to HAP. First, 0.6 M ammonium phosphate was dissolved in deionized water and added dropwise into another beaker containing 0.3 M calcium nitrate while the pH was maintained at 5. The stirring process continued for 2 h. Then the precipitated gel was washed and dried. The obtained powder was analyzed using XRD and divided into two parts. One was mechanochemically reacted with varying concentrations of ZnCO3 starting from 5, 10, 15, 20, to 25 w/w, which further in the text are referred to as 5–25 Zn-HAP mill. The other part was milled without ZnCO3 to transform it into crystalline HAP. Finally, HAP was mixed with ZnCO3 starting from 5, 10, 15, 20, to 25 w/w without milling, which further in the text are referred to as 5–25 Zn-HAP mix to serve as a benchmark. The underlying reason for this comparison was that conventionally the Zn supplement in mineral fertilizers is supplied as a standalone salt or mineral, analogous to the mix scenario investigated here. A schematic diagram showing the synthesis steps is illustrated in Fig. 1.
2.2 Zn-HAP physicochemical characterization
![[thin space (1/6-em)]](https://www.rsc.org/images/entities/char_2009.gif) 838 s−1. The applied voltage of the apparatus was 45 kV, while the current was 40 mA. The analysis with done with a mask of 4 mm, 1/8′′ incident beam divergence slit, and 1/2′′ incident beam anti-scatter slit.
838 s−1. The applied voltage of the apparatus was 45 kV, while the current was 40 mA. The analysis with done with a mask of 4 mm, 1/8′′ incident beam divergence slit, and 1/2′′ incident beam anti-scatter slit.
Thermodynamic parameters have been computed using the model of Coats–Redfern, which is represented as (1):35
 | (1) |
 versus 1000/T, the slope and the intercept can be used to calculate A and E*. Then, using the fundamental equations of thermodynamics, enthalpy (ΔH), entropy (ΔS) and Gibbs free energy (ΔG) can be calculated as
| ΔH* = E* − RT, | (2) |
 | (3) |
| ΔG* = ΔH* − TΔS*. | (4) |
2.3 Zn2+ ion release kinetic measurements
Either 1 g of Zn-HAP obtained after HAP milling with ZnCO3 or equivalent amounts of HAP and ZnCO3 mixture were dissolved in 1000 mL of deionized water containing 2 wt% citric acid. 5 mL of the solution was sampled periodically and Zn content was analyzed using atomic absorption spectroscopy (AAS, PerkinElmer). AAS was calibrated in the 0.2, 0.6, and 1.0 ppm range for a Zn lamp (λ = 213.9 nm). Each one of the samples was diluted 5 times to meet the requirements of the calibration range.3 Results and discussion
3.1 XRD analysis of the HAP precursor as well as the milled/mixed Zn-HAP
The crystal structures of the chemical precipitation synthesized precursor and the mechanochemically synthesized Zn-HAP were examined using XRD and compared to that of the mixture of HAP and ZnCO3. All XRD peaks were relatively wide, which indicated the irregularity of plane order and therefore nanoscale behavior. It can be seen in Fig. 2a that the characteristic peaks of the hydrothermally synthesized precursor at pH = 5 were due to monetite, CaHPO4 (ICDD # 01-070-0359) and brushite, CaHPO4·2H2O (ICDD # 00-009-0077). When mechanochemically reacted with 5 to 15% w/w ZnCO3, it transformed into single-phase HAP (ICDD card # 01-073-0293) with no visible precursor peaks. Notably, Fig. 2a suggests some residual carbonate that did not react by ZnCO3 identification at the peak 13° for 20 and 25% w/w ZnCO3. The same peak was also apparent in Fig. 2b, where mixtures of ZnCO3/HAP precursors were analyzed; however, it was already apparent even at a low 5% w/w loading. This indicates the ability of a mechanochemical reaction to incorporate Zn in HAP without residual (unreacted) ZnCO3 up until 15 Zn-HAP. Therefore, these results show the ability of the mechanochemical approach to form Zn-doped HAP from the monetite/brushite precursor up to 20% ZnCO3 w/w.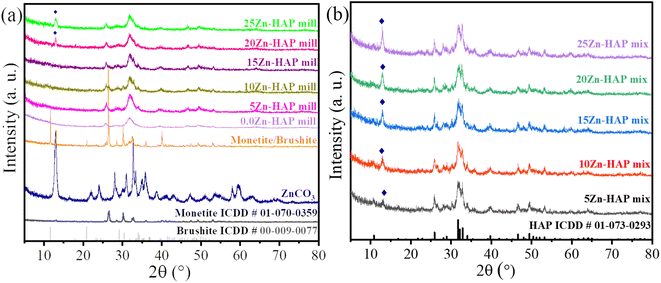 | ||
| Fig. 2 Powder XRD plot for various Zn contents in the HAP structure for (a) milled and (b) mixture procedures (♦: ZnCO3). | ||
The ionic radius of Zn(II) is around 0.74 and 0.9 Å for 6 and 8-fold coordination, while Ca(II) in HAP can have ionic radii 1.06 and 1.18 Å for 7 and 9-fold coordination, respectively.37 The relatively small difference between Zn(II) and Ca(II) ionic radii may facilitate ionic replacement. However, it is difficult to notice the XRD shifts reported in the literature as well as in the present work in Fig. 2 due to the low crystallinity that results from the milling method used and the small difference in ionic radii. In previous studies, Makarova et al. synthesized and studied the structure of HAP doped with Zn and silicate using a mechanochemical approach. The results showed that no significant shift can be detected in XRD patterns.34 Furthermore, Maleki-Ghaleh et al. synthesized Zn-doped HAP using a mechanochemical technique. The XRD patterns did not show a peak shift between the pure HAP and the doped one. However, using the XPS technique, a small shift to lower binding energy of both Ca 2p and P 2p was detected.38 In the current study, a shift was observed using XPS scanning. Pure ZnCO3 was milled under the same conditions without HAP present as seen in Fig. 1S.† It could be noticed that the crystallinity decreased; however, it is still high enough to be identified using XRD, suggesting that unreacted ZnCO3 remains crystalline and should be observed in Fig. 2a.
3.2 Raman spectroscopy of milled/mixed Zn-HAP
Raman spectra are shown in Fig. 3 for various contents of ZnCO3 in milled and mixed Zn-HAP. Fig. 3a shows that all milled Zn-HAP samples exhibit the main peak at 960 cm−1 due to the symmetric stretching mode of PO43− (v1).39 The symmetric bending modes of PO43− (v2) are located at 430 cm−1.39 Furthermore, low intensity antisymmetric stretching mode for PO43− (v3) is observed at around 1047 cm−1.40 The asymmetric bending mode (v4) of PO43− can be observed at 580 cm−1.39 Also, a weak peak can be observed at 3573 cm−1, indicating the presence of the O–H group. 20- and 25 Zn-HAP mill exhibited a small shoulder at 1057–1060 cm−1 due to the C–O (v1) in ZnCO3. On the other hand, as shown in Fig. 3b, the precursor ZnCO3 can be readily distinguished. The peak at 738 cm−1 belongs to C–O (v4), while the peak of 1060 cm−1 due to C–O (v1) is already apparent in the 5 Zn-HAP mix. The latter peak of the carbonate group might overlap with the antisymmetric stretching of P–O (v3) from HAP. Adding Zn ions into HAP structures did not lead to a significant Raman shift. As in Fig. 3c, the (v1) peak belonging to the phosphate group changes with increasing the concentration of Zn ions for the milled group. When S. Gomes et al. studied the structural changes of Zn-doped HAP, they concluded that the incorporation of Zn ions might lead to a deformation of the (v1) signal.41 On the other hand, the peak of 1047 cm−1 does not vary with the additional Zn ions for the milled compounds. The detected peaks at 388, 738, and 1060 cm−1 can also be assigned to the presence of hydrozincite (zinc carbonate basic) (Zn5(OH)6(CO)2), besides the zinc carbonate (ZnCO3).42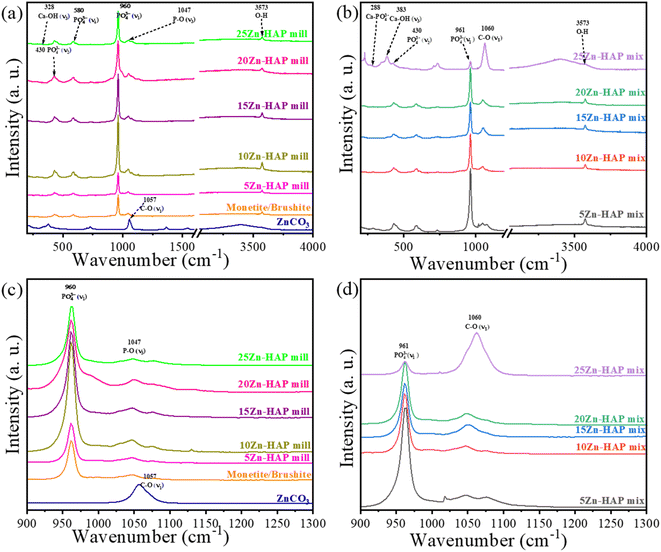 | ||
| Fig. 3 Raman spectra of (a) Zn-HAP mill and (b) Zn-HAP mix, (c) Zn-HAP mill in the range 900–1300 cm−1, and (d) Zn-HAP mix in the range 900–1300 cm−1. | ||
In the case of the Zn-HAP mix compositions, the stretching mode of Ca–OH (v3) is detected at 331 cm−1, and the peak of 288 cm−1 is assigned to Ca-PO4.43 Moreover, the intensity of the main peak of the phosphate group at 961 cm−1 decreases with the increase of zinc carbonate concentrations, while the peak at 1060 cm−1 gradually increases. It reflects the augmentation of the carbonate amount in the composition with the additional zinc carbonate, which seems to be significant with the mixture obtained samples compared to the milled ones. This matches the assumption that the internal bonds of ZnCO3 have been broken in the mechanochemical process. At the same time, the HAP crystals could absorb a limited number of carbonate ions to replace the phosphate or hydroxyl sites. The increase of 1060 cm−1 peak intensity for the 25 Zn-HAP mix might denote a high ratio of carbonate coming from carbonated HAP and ZnCO3. On the other hand, the mixture maintains the crystal structure of zinc carbonate reflected in the significant growth in the carbonate peak at 1060 cm−1. Consequently, the milling technique might be able to insert and incorporate Zn2+ ions into the HAP crystal structure.
3.3 ATR-FTIR spectral analysis of milled/mixed Zn-HAP
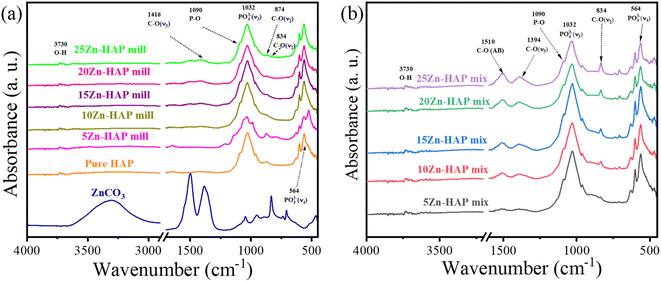
The spectral analysis using ATR of both the milled and mixed samples of ZnCO3 and HAP is shown in Fig. 4. Both exhibit O–H low variations around 3500 cm−1 attributed to the presence of hydroxyl groups in HAP. The most distinctive feature lies at 1500 cm−1 due to the carbonate bonds, in conjunction with another noticeable band spanning from 750 to 1000 cm−1 including PO43− functional groups at 1032 cm−1. These characteristic bands are associated with carbonate groups and are particularly prominent in the mixed samples, in contrast to the milled ones. This domination of CO32− groups in the mixed samples implies a higher concentration and a clearer presence than the milled samples due to the existence of ZnCO3 as a secondary phase. The appearance of the predominant carbonate peak at 834 cm−1 in mixed samples compared with 874 cm−1 in milled refers to the C–O (ν2) vibration bonding.44 However, the former originates from the carbonate group which belongs to ZnCO3, while the latter refers to the carbonate group doped HAP.45 Therefore, despite ZnCO3 being present in the samples at low levels, the carbonate groups are still an essential part of the overall chemical composition due to their substitution in the HAP structure.3.4 Thermal properties of milled/mixed Zn-HAP
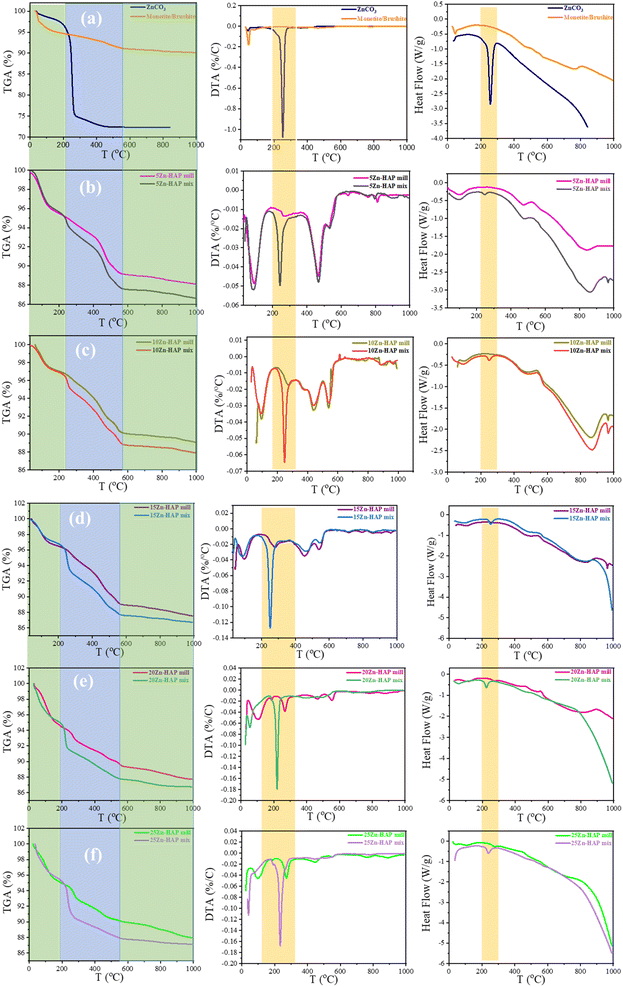
The HAP crystals have a high affinity to absorb carbon dioxide within the chemical synthesis, which may replace the phosphate sites (B), hydroxyl sites (A), or both positions, which is called AB (type). This spontaneous ionic replacement has a significant effect on the chemical and thermal stability of HAP. Thermogravimetric analysis was performed to investigate the thermal behavior and the phase transformations of Zn-HAP obtained mechanochemically compared to the mixtures of HAP/ZnCO3. It can be seen in Fig. 5 that the precursor comprising monetite/brushite exhibited 5% weight loss until around 200 °C, which might be due to moisture release. Furthermore, the brushite phase usually transforms to monetite at this stage.46 After a loss of 5%, it remains stable up to 1000 °C. On the other hand, pure ZnCO3 loses around 25% of its weight from 200 to 260 °C to transform into ZnO.47 Importantly, the DSC of pure ZnCO3 in Fig. 5a shows a high-intensity negative peak of about 260 °C indicating a ZnCO3 phase transformation. In contrast, neither pure HAP nor the monetite/brushite precursor displays any phase transformation in the same stage.As illustrated in Fig. 5b, the TGA behavior of the 5 Zn-HAP mill and mix exhibits three consecutive stages. Namely, from room temperature to around 230 °C, the second from 230 °C to about 600 °C, and the last from 600 °C to 1000 °C. Due to surface water evaporation, the 1st stage contains a weight loss lower than 4.2–5.0% for all compositions. Both 5 Zn-HAP mill and 5 Zn-HAP mix behave similarly in the 1st stage, which could confirm that the weight loss here is assigned to the loss of absorbed moisture. In the second temperature stage of 230 °C–600 °C, the 5 Zn-HAP mix loses more weight than the 5 Zn-HAP mill. The DTA pattern shows more than one peak in the 230 to 600 °C range. The main endothermic peak is around 245 °C for the mixed Zn-HAP, while the milled ones do not exhibit it. This is persistent up to 20 Zn-HAP mill where unreacted ZnCO3 is present. This implies that a phase transformation occurs for the mixture but not for the milled Zn-HAP. The Zn substitutes Ca in the HAP structure as a result of milling and therefore, less ZnCO3 structural phase could be available for milled compositions. TGA further shows a thermal stability/plateau starting from 420 °C in virtually all the samples. Around 470 °C, for 5–15 Zn-HAP mill and mix, a high-intensity endothermic peak is accompanied by mass change. It can be related to the release of CO2 gas from their surfaces.
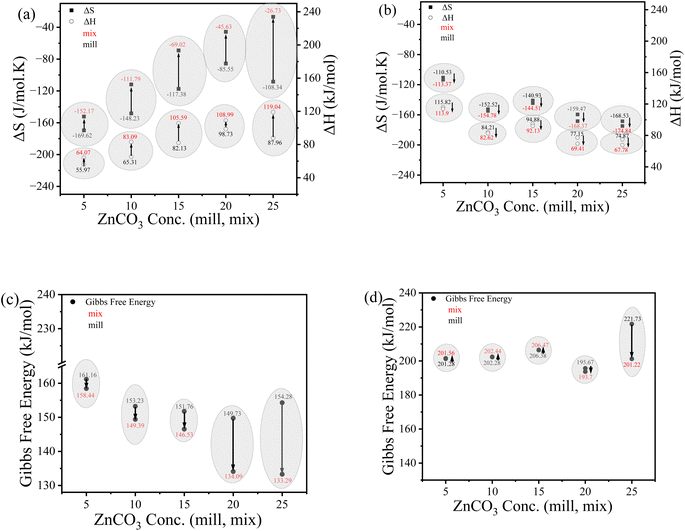
The thermodynamic parameters (enthalpy, entropy and Gibbs free energy) were estimated to study these phase transformations. The Coats–Redfern (CR) model35,48 was used, which is based on a relationship between Ln(−Ln(1 − x)/T2) and 1000/T from TGA analysis and the estimated parameters are listed in Fig. 6a and b for (a) 30–350 °C and (b) 350–500 °C temperature ranges, respectively, with the CR model curves shown in Fig. 2S.† The calculations reveal that the milled samples have higher negative entropy than the mixed ones. The higher negative entropy indicates a more ordered structure and consequently, higher stability. In addition, the higher negative entropy values represent less energy spread due to the presence of a single phase (Zn-HAP) rather than the dual phases as in mixture samples (ZnCO3 and HAP). In the temperature region of 350–500 °C, entropy calculations reveal the opposite trend compared with phase one behavior. Here, the entropy values are more negative for the mixed samples than the milled ones. This suggests that the phase transformation of ZnCO3 proceeds entirely to ZnO, which seems to be more stable than the other compounds including HAP. The unique phase transformation of pure ZnCO3 occurred at 260 °C. The significant changes in thermal stability upon the variation of compositions show the importance of phase structures for the thermal properties. Although the same weight components were introduced for both mill and mix samples, the highly consistent difference between their behaviors shows that the preparation conditions are crucial in controlling the final physicochemical properties.
For example, the DSC curves exhibit significant changes between the milled and the mixed ones, despite their having the same concentrations of ZnCO3. In other words, pure ZnCO3 shows a single-phase transformation to ZnO at 257 °C. This structural change is assigned to the transformation from ZnCO3 to ZnO. The mill group including brushite/monetite, 5 Zn-HAP, 10 Zn-HAP, and 15 Zn-HAP does not show any phase transformation around this region. This means that all the samples that lack ZnCO3 as a secondary phase do not show a phase transformation around the region of 220–270 °C.
However, the 20 Zn-HAP mill and 25 Zn-HAP mill and all mix sample groups starting from 5 Zn up to 25 Zn show a significant phase transformation in the region of 220–270 °C, which can be only assigned to the existence of a secondary phase (ZnCO3) as a complete crystal. The slight change among these samples in the phase transformation temperature from ZnCO3 to ZnO may be because HAP crystals might affect the energy absorbance and distribution in the composite. In the case of the milled compounds (5 Zn, 10 Zn, and 15 Zn), Zn(II) has been incorporated into the HAP lattice, and there is no longer a secondary phase that can show its unique properties such as phase transformation to a more stable phase like ZnO.
Combining this phenomenon which matches with the results from XRD might provide support for the hypothesis that Zn(II) ions have been incorporated successfully into HAP crystals. Thus, thermal degradation study is a powerful tool not only to investigate phase transformation but also to deeply understand the structural changes accompanying ionic doping.
Enthalpy calculations exhibit higher values for the mixed samples than the milled ones. This could be attributed to the higher energy required for the mix samples to complete their structural rearrangement. This behavior of less energy for the milled ones shows lower thermal reactivity and higher thermal stability for the HAP doped with Zn than the HAP/ZnCO3 companions. Finally, the positive values of Gibbs free energy (as shown in Fig. 6c and d) imply that the phase transformation cannot occur spontaneously, rather it requires high energy. The relatively high Gibbs free energy values of the milled samples confirm the higher thermal stability of the Zn-HAP mill than the mix ones, indicating that HAP and ZnCO3 in dual phase composition decreases the thermal stability of the whole composite.
3.5 XPS analysis
XPS of the 0.0 Zn-HAP mill, 5 Zn-HAP mill and 5 Zn-HAP mix has been performed as shown in Fig. 7. A small shift in the Ca 2p3/2 peaks can be observed from 347.2 eV to 347.4 eV for 0.0 Zn-HAP mill and 5 Zn-HAP mill, respectively. The Zn ions have been detected at 1022 eV for Zn 2p3/2 and 1045 eV for Zn 2p1/2. In addition, the P 2p at 133.3 eV for 0.0 Zn-HAP mill and 133.5 eV for 5 Zn-HAP mill has been detected, but spin–orbit coupling is only about 0.8 eV and can't be discerned. The peak identified at 531.3 eV is associated with oxygen ions.23 C1s at 285.0 eV is due to adventitious carbon, while that at 288.6 eV is due to residual carbonates.38,49,50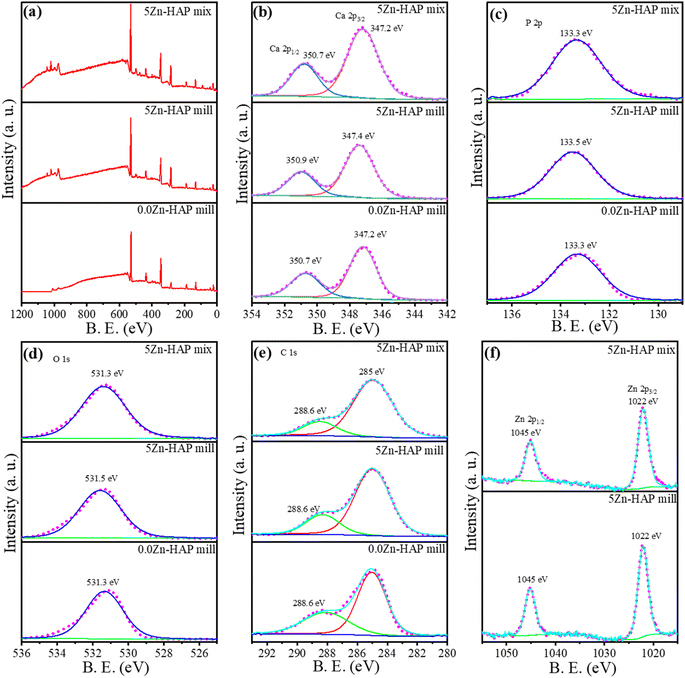 | ||
| Fig. 7 XPS spectra of 0.0 Zn-HAP mill, 5 Zn-HAP mill and 5 Zn-HAP mix: (a) survey, (b) Ca 2p, (c) P 2p, (d) O 1s, (e) C 1s and (f) Zn 2p. | ||
The detected peak shifts of the peak positions are associated with the dopant of Zn into HAP crystals. There is no observed peak shift for the 0.0 Zn-HAP and 5 Zn-HAP mix because the only difference between them is the additional ZnCO3 in the mixed one. However, some peaks belonging to the 5 Zn-HAP mill are shifted compared with the 0.0 Zn-HAP mill, which might support that Zn2+ ions occupy the Ca2+ sites successfully.
3.6 STEM and EDS analysis of milled/mixed Zn-HAP
Electron microscopy analysis is important in elucidating the size/shape and distribution of particles, which can provide valuable insight into the impact of different preparation methods on the microstructure of materials. Fig. 8a1 and a2 show the monetite/brushite composition, which is formed with a semi-spherical shape with dimensions less than 200 nm. Pure-milled HAP (0.0 Zn-HAP mill) is shown in Fig. 8b1 and b2. It seems to be composed of non-unform particles. Fig. 8c1 and c2 display the 5 Zn-HAP mill microstructure predominantly composed of nanorods. These nanorods have an average diameter of approximately 12 nm and a length of about 40 nm. This STEM image demonstrates a non-uniform distribution of sizes, suggesting that the milling process has influenced the particle size distribution. However, it is essential to note that some degree of size heterogeneity is not uncommon in HAP and various factors might influence it in the synthesis process. Moreover, incorporating ZnCO3 at a 25 wt% concentration results in a distinct change in morphology. The clear nanorods now transform into larger aggregations exhibiting a non-uniform distribution in size and shape. The diameter of the nanoparticles can be measured to be around 8 nm, while the aggregations reach an average size of approximately 170 nm. This transformation in morphology signifies a substantial effect of the increased Zn content, leading to a more clustered and varied microstructure. Furthermore, the STEM analysis of the 5- and 25 Zn-HAP mix also reveals the presence of nanorods. The average diameter of these nanorods is around 18 nm with a length of approximately 50 nm. Like 25 Zn-HAP mill, these mixed samples exhibit a non-uniform distribution in size and shape, but the primary morphology remains that of nanorods.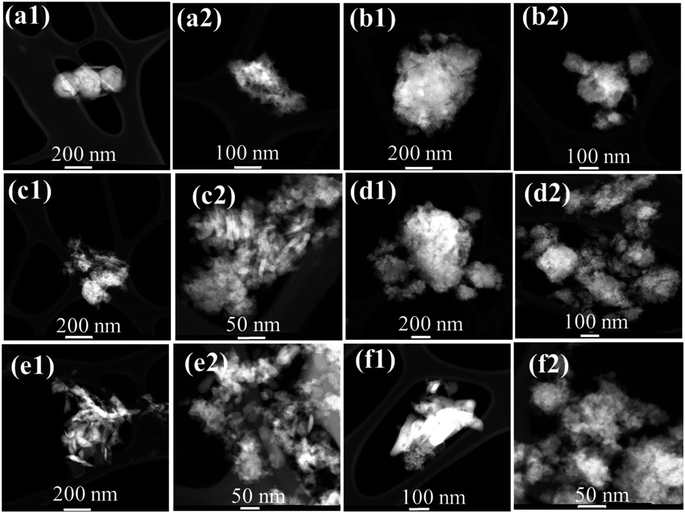 | ||
| Fig. 8 STEM micrographs (a1 and a2) monetite/brushite, (b1 and b2) 0.0 Zn-HAP mill, (c1 and c2) 5 Zn-HAP mill, (d1 and d2) 25 Zn-HAP mill, (e1 and e2) 5 Zn-HAP mix, and (f1 and f2) 25 Zn-HAP mix. | ||
Fig. 9 shows the TEM images for the 5 Zn, 25 Zn mill, and mixed samples. It is shown that 5 Zn-HAP was formed in rod shapes as in Fig. 9a3. Selected area electron diffraction (SAED) shows a relatively low crystallinity for a compound. Fig. 9b1–b4 shows that the 25 Zn-HAP mill contains non-uniform size particles. Fig. 9b3 exhibits the d-spacing for different surrounding crystals indicating the polycrystalline nature of the compound. These crystals seem to be non-alignment crystals. In addition, the crystallinity that appears in the SAED for the 25 Zn-HAP mill seems to be relatively lower than that of 5 Zn-HAP mill, indicating the deterioration of crystallinity by the ionic dopants. Fig. 9c1–c4 shows 5 Zn-HAP mix, which was formed as rod shapes with lengths in a range of 50–200 nm. Fig. 9c3 displays the d-spacing of the stacked layers due to the polycrystalline formation of the compound. The misalignment angles between the surrounding grains seem to be relatively high. The atomic layers between the crystals, which are grain boundaries, tend to be less ordered than the crystals themselves. This implies that the grain boundaries have higher energy, indicating that the chemical reactivity of the crystals with the ambient environment differs from the reactivity of the grain boundaries. Consequently, the atomic stacking of the compound might play an important role in determining the properties of the material.
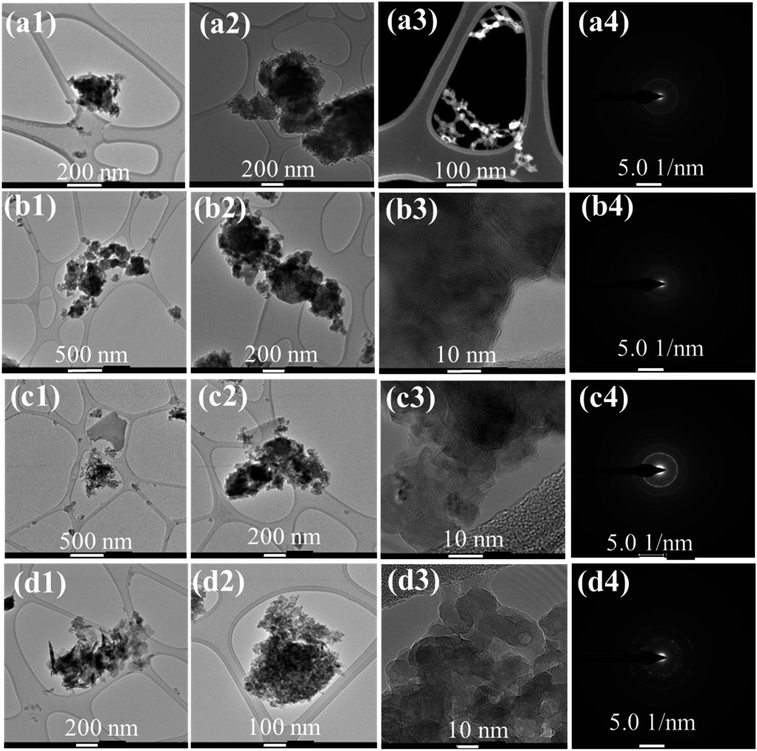 | ||
| Fig. 9 TEM and SAED micrographs at different magnifications: (a1–a4) 5 Zn-HAP mill, (b1–b4) 25 Zn-HAP mill, (c1–c4) 5 Zn-HAP mix, and (d1–d4) 25 Zn-HAP mix. | ||
Fig. 9d1–d4 shows that 25 Zn-HAP mix has rod shapes with lengths around 100–300 nm. The polycrystalline nature looks clearer than the former compound, while the misalignment angles seem to be lower, which is reflected in the SAED as high crystallinity. The relatively high crystallinity of the mix (5 Zn and 25 Zn) compared with the milled ones is analogous to the ionic dopants in the milled group.
On the other hand, EDS is a valuable analytical technique that provides crucial information about the elemental distribution within different samples as depicted in Fig. 10a–d. The results of the EDS analysis offer information about the spatial arrangement of various elements and the uniformity of distribution and potential differences arising from the incorporation of ZnCO3 in the samples. The uniform Ca distribution throughout the particles can be seen across all samples. Similarly, the distribution of O and P elements shows uniformity across the samples. This result is ascribed to the fact that these elements are essential components of HAP, constituting its primary structure and remaining consistent under various experimental conditions. The uniform distribution of these elements implies that the essential chemical composition of the material is preserved, regardless of the preparation methods or the presence of ZnCO3. The low concentrations of Zn ions appear in good distribution. However, it can be noticed that there is a slight deviation in the distribution of the Zn element in Fig. 10d and f, due to the high concentration of Zn elements indicating that ZnCO3 can aggregate. This is significant and can be ascribed to the clustering or the phase existence of ZnCO3 particularly at this higher concentration of both 25 Zn-HAP mill and 25 Zn-HAP mix, which is also confirmed in different spots as shown in Fig. 3S.†
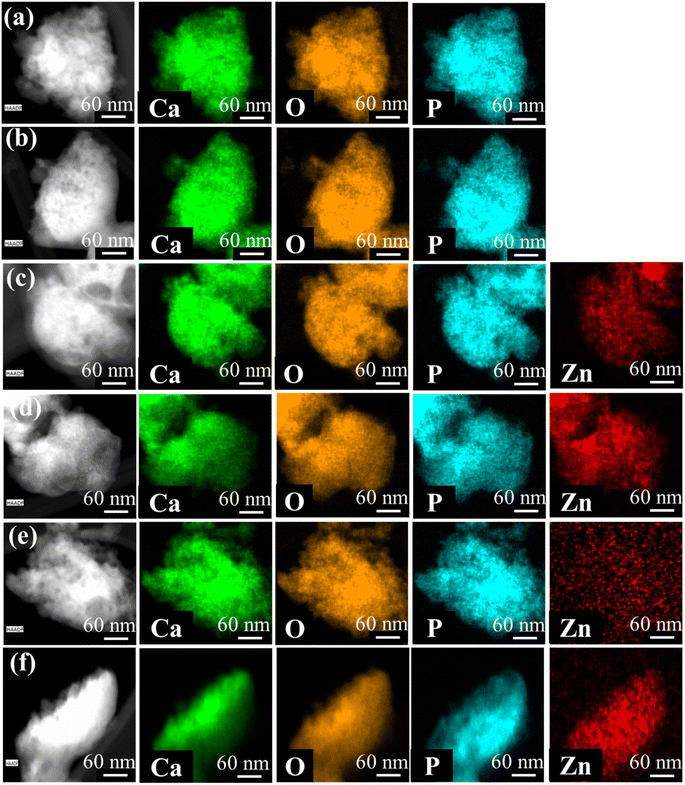 | ||
| Fig. 10 EDS elemental mapping of (a) Brushite/monetite, (b) 0.0 Zn-HAP mill, (c) 5 Zn-HAP mill, (d) 25 Zn-HAP mill, (e) 5 Zn-HAP mix, and (f) 25 Zn-HAP mix. | ||
3.7 Zn2+ ion release in soil-relevant aqueous solutions
The ratio of Cmix/Cmill indicating the ratio between the Zn2+ release patterns for 5, 10, 20, and 25 Zn-HAP mix divided by the released content from 5, 10, 20, and 25 Zn-HAP mill was measured in a 2% citric acid solution and the results are shown in Fig. 11. The absolute values for the Zn2+ release from the samples are shown in Fig. 4S.† To illustrate the difference between the mixed and milled sample Zn2+ release behaviors, each milled sample could be compared with its analog mixture. It can be seen that the Zn2+ ionic release decreases slightly with the time reaching the plateau after 10 h of dissolution reaction. In addition, the mix samples seem to release Zn2+ ions more than their conjugated milled ones. This indicates that the milled samples are characterized by lower Zn2+ release.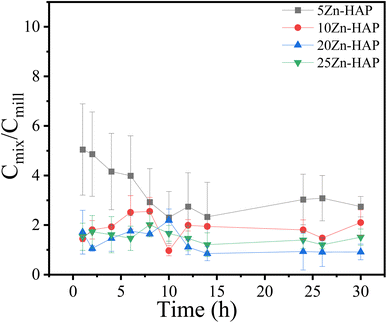 | ||
| Fig. 11 Temporal pattern of Zn2+ ion release for Cmix/Cmill ratios for 5, 10, 20, and 25 Zn-HAP mill and for 5, 10, 20, and 25 Zn-HAP mix samples. Error bars represent triplicate measurement. | ||
When the reaction starts, the pH value of the solution tends to be around 4.5 due to the dissolution of citric acid according to (5)
| C6H8O7 + 3H2O ⇔ C6H5O73− + 3H3O+ | (5) |
However, the dissolution reaction of HAP produces hydroxyl ions, which promote the alkalinity of the solution according to (6)
| ZnxCa10−x(PO4)6(OH)2 → xZn2+ + (10 − x)Ca2+ + 6PO43− + 2(OH)− | (6) |
The Zn2+ ions prefer to bind with organic species such as citrate ions via(7) especially when the pH value exceeds 6.5, which could be reached due to the dissolution of HAP
| 3Zn2+ + 2C6H5O73− → Zn3(C6H5O7)2 | (7) |
These findings match well with the rising pH value of the solution in the experiment time reaching pH 7 as a final value. The release of Zn2+ ions from HAP occurs simultaneously with hydroxyl liberation to compensate for the charge, while the restoration of Zn2+ ions liberates H+ into the solution.51 However, the Zn2+ ions are trapped in the Ca2+ sites, which seem to be interior ions in the HAP crystal, while the hydroxyl groups are surface ions. Consequently, both reactions do not have the same occurrence probability. Thus, the rate of Zn2+ release starts with high values and decreases gradually with the time reaching the plateau after 10 h in the presence of citric acid as illustrated in Fig. 11. It is worth noting that the HAP seems to show great buffering characteristics on its surface sites. This behavior could be highly beneficial for the surrounding environment, especially in agricultural applications to avoid aggressive changes in the pH value of the environment.
Several studies have previously investigated the dissolution of HAP doped with nutrients in different media. Huang et al. embarked on a study involving preparing HAP-Mg3(PO4)2–Zn3(PO4)2 on an AZ31 alloy, followed by immersion in Hank's solution, which contains different inorganic salts and is used for cell culture applications. Their investigations for 15 days revealed that Zn concentration increased steadily from the start of the experiment up to the 6th day followed by a plateau. In detail, the released quantity of Zn into the solution has been doubled from the 3rd to the 6th day of immersion.52 Furthermore, Sergi et al. synthesized HAP doped with 5 and 10 mol% Zn. They observed fluctuating ion behavior within a 20 mL simulated body fluid (SBF) solution, which is used usually for biological tests with a fixed pH value of 7.2. Notably, after 15 days of immersion, the ionic release from 5 Zn-HAP was higher than that of 10 Zn-HAP.53 Ullah et al. prepared co-doped HAP incorporating Zn and Sr using the hydrothermal method. The release behavior of Zn changed with the co-dopant content. For instance, for the composition of HAP containing 5 wt% for both ions, the Zn released quantity decreased to 50% from the 1st to the 7th day of immersion in phosphate buffer saline solution (PBS).54 Sharma et al. investigated the effect of ionic dopants including Zn in HAP that is modified with urea for agricultural applications.24 Zn-HAP/urea was synthesized using the co-precipitation method and applied to wheat crops. The results showed that zinc ions were released from HAP to the soil and absorbed by the plants. The detected level of Zn was high in the plant stem tissues.24 Wojcik et al. investigated the release behavior of Zn ions from a composition containing Zn-doped HAP/gentamicin in PBS solution.55 The results showed that after 24 h of immersion, the released Zn quantity increased 1.5 times that of 1 h immersion.55 These data suggest that both the initial pH value and the surrounding molecular environment play important roles in controlling the ionic release trend from the HAP compounds typically synthesized using high-temperature calcination methods. While the results here provided for a distinctly different Zn2+ ion release patterns from Zn-HAP mill as opposed to mixed materials, relating different properties of 5 Zn-HAP mill materials using surface sensitive techniques, such as XPS, with dissolution properties in various simulated soil pore liquid environments is underway.
4 Conclusions
Two distinct preparation methods, milling and mixing, were employed to investigate the effect of ZnCO3 on the HAP structure and the resulting Zn2+ ion release patterns. A precursor containing brushite/monetite was used and mechanochemically reacted with ZnCO3. The resulting materials were shown to be HAP from powder XRD. STEM analysis of the 5Zn-HAP mill displayed a nanorod-dominant microstructure with an average diameter of 12 nm and a length of 40 nm, while the introduction of 25% Zn led to larger, non-uniform aggregates. The mixed samples exhibited nanorod morphology, with average diameters and lengths of 18 and 50 nm, respectively. EDS analysis demonstrated a uniform distribution of Ca, O, and P elements, with slight deviations attributed to ZnCO3 aggregation in mixed samples. TGA analysis exhibited three consecutive stages: up to around 230 °C, from 230 °C to about 600 °C, and above 600 °C up to 1000 °C for both milled and mixed samples with higher weight loss in mixed samples. It was shown that the mill samples tend to have more negative entropy than the mixed ones, while enthalpy calculations exhibit higher values for the mixed samples than the milled ones. Finally, ionic release data revealed consistent declines in concentration over time for all samples. Interaction between citric acid and Zn, potentially forming zinc citrate, was indicated by declining concentrations. The milled sample with 5% Zn content exhibited nearly stable release, while contrasting behavior was observed in the mixed sample.These results show that milling ZnCO3 results in Zn-HAP, directly affecting the chemical, physical, structural and thermal properties. This study represents a protocol for numerous applications combining HAP with ZnCO3 including medical and agricultural applications.
Data availability
The data will be available upon request.Author contributions
Mohamed Ammar: study design, experiments, data collection and data analysis, writing (initial draft), and editing; Ricardo Bortoletto-Santos: data collection and data analysis, and writing (initial draft); Caue Ribeiro: data analysis and draft revision; Lihua Zhang: experiments, data collection and data analysis; Jonas Baltrusaitis: writing (final), conceptualization supervision, project administration, and funding acquisition. All authors have read and agreed to the published version of the manuscript.Conflicts of interest
The authors declare no conflicts of interest.Acknowledgements
This work is supported by the Engineering for Agricultural Production Systems program grant no. 2020-67022-31144 from the USDA National Institute of Food and Agriculture. This research used JEOL2100F and Thermo Fisher Talos 200X of the Center for Functional Nanomaterials (CFN), a U.S. Department of Energy Office of Science User Facility, at the Brookhaven National Laboratory under Contract No. DE-SC0012704. RBS and CR thank the Brazilian National Council for Scientific and Technological Development (CNPq, grants 442575/2019-0-SISNANO/MCTI program, and 406925/2022-4-INCT Program), FNDCT/CT-AGRO/FINEP (Cooperation Agreement No. 01.22.0080.00, Ref. 1219/21), and FAPESP (grants 20/12210-3 and 23/01549-8). The authors also thank the Agronano Network (Embrapa Research Network) and the National Nanotechnology Laboratory for Agribusiness (LNNA) for providing institutional support and facilities.References
- D. Geisseler and K. M. Scow, Long-term effects of mineral fertilizers on soil microorganisms – A review, Soil Biol. Biochem., 2014, 75, 54–63 CrossRef CAS.
- M. Calabi-Floody, J. Medina, C. Rumpel, L. M. Condron, M. Hernandez, M. Dumont, et al., Chapter Three - Smart Fertilizers as a Strategy for Sustainable Agriculture, In Advances in Agronomy, ed. D. L. Sparks, Academic Press, 2018, pp. 119–157 Search PubMed.
- I. O. Adisa, V. L. R. Pullagurala, J. R. Peralta-Videa, C. O. Dimkpa, W. H. Elmer and J. L. Gardea-Torresdey, et al., Recent advances in nano-enabled fertilizers and pesticides: a critical review of mechanisms of action, Environ. Sci.: Nano, 2019, 6, 2002–2030 RSC.
- L. V. Kochian, Rooting for more phosphorus, Nature, 2012, 488, 466–467 CrossRef CAS PubMed.
- C. Alewell, B. Ringeval, C. Ballabio, D. A. Robinson, P. Panagos and P. Borrelli, Global phosphorus shortage will be aggravated by soil erosion, Nat. Commun., 2020, 11, 4546 CrossRef CAS PubMed.
- C. Langhans, A. H. W. Beusen, J. M. Mogollón and A. F. Bouwman, Phosphorus for Sustainable Development Goal target of doubling smallholder productivity, Nat Sustainability, 2022, 5, 57–63 CrossRef.
- Y. Sakhno and D. P. Jaisi, Novel Route to Enhance the Solubility of Apatite, a Potential Nanofertilizer, through Structural Incorporation of Sodium and Potassium Ions, ACS Agric. Sci. Technol., 2021, 1, 488–498 CrossRef CAS.
- S. Tang and X. Fei, Refractory calcium phosphate-derived phosphorus fertilizer based on hydroxyapatite nanoparticles for nutrient delivery, ACS Appl. Nano Mater., 2021, 4, 1364–1376 CrossRef CAS.
- D. Wang, Y. Xie, D. P. Jaisi and Y. Jin, Effects of low-molecular-weight organic acids on the dissolution of hydroxyapatite nanoparticles, Environ. Sci.: Nano, 2016, 3, 768–779 RSC.
- U. Tosun G, Y. Sakhno and D. P. Jaisi, Synthesis of Hydroxyapatite Nanoparticles from Phosphorus Recovered from Animal Wastes, ACS Sustain. Chem. Eng., 2021, 9, 15117–15126 CrossRef.
- L. Xiong, P. Wang, M. N. Hunter and P. M. Kopittke, Bioavailability and movement of hydroxyapatite nanoparticles (HA-NPs) applied as a phosphorus fertiliser in soils, Environ. Sci.: Nano, 2018, 5, 2888–2898 RSC.
- R. Huang, P. Mao, L. Xiong, G. Qin, J. Zhou and J. Zhang, et al., Negatively charged nano-hydroxyapatite can be used as a phosphorus fertilizer to increase the efficacy of wollastonite for soil cadmium immobilization, J. Hazard. Mater., 2023, 443, 130291 CrossRef CAS PubMed.
- A. A. A. Elsayed, A. El-Gohary, Z. K. Taha, H. M. Farag, M. S. Hussein and K. AbouAitah, Hydroxyapatite nanoparticles as novel nano-fertilizer for production of rosemary plants, Sci. Hortic., 2022, 295, 110851 CrossRef CAS.
- M. Ammar, S. Ashraf and J. Baltrusaitis, Nutrient-Doped Hydroxyapatite: Structure, Synthesis and Properties, Ceramics, 2023, 6, 1799–1825 CrossRef CAS.
- M. Lin, P. Liu, L. Jun, W. Zhou and J. Yuan, Phosphorus bioavailability and migration of hydroxyapatite in different sizes as phosphorus fertilizer in camellia oleifera seedlings, HortScience, 2021, 56, 1112–1118 CAS.
- M. Pu'ad NAS, R. H. Abdul Haq, H. Mohd Noh, H. Z. Abdullah, M. I. Idris and T. C. Lee, Synthesis method of hydroxyapatite: A review, Mater. Today: Proc., 2020, 29, 233–239 Search PubMed.
- M. Yoshimura and H. Suda, Hydrothermal processing of hydroxyapatite: past, present, and future, Hydroxyapatite and Related Materials, CRC Press, 2017, pp. 45–72 Search PubMed.
- M. Aaddouz, K. Azzaoui, N. Akartasse, E. Mejdoubi, B. Hammouti and M. Taleb, et al., Removal of Methylene Blue from aqueous solution by adsorption onto hydroxyapatite nanoparticles, J. Mol. Struct., 2023, 135807 CrossRef CAS.
- N.-I. Farkas, G. L. Turdean, L. Bizo, L. Marincaș, O. Cadar and L. Barbu-Tudoran, et al., The effect of chemical composition and morphology on the drug delivery properties of hydroxyapatite-based biomaterials, Ceram. Int., 2023, 49(15), 25156–25169 CrossRef CAS.
- M. R. Maghsoodi, L. Ghodszad and B. Asgari Lajayer, Dilemma of hydroxyapatite nanoparticles as phosphorus fertilizer: Potentials, challenges and effects on plants, Environ. Technol. Innovation, 2020, 19, 100869 CrossRef.
- T. Tite, A.-C. Popa, L. M. Balescu, I. M. Bogdan, I. Pasuk and J. M. Ferreira, et al., Cationic substitutions in hydroxyapatite: Current status of the derived biofunctional effects and their in vitro interrogation methods, Materials, 2018, 11, 2081 CrossRef PubMed.
- C. O. Dimkpa, U. Singh, P. S. Bindraban, W. H. Elmer, J. L. Gardea-Torresdey and J. C. White, Zinc oxide nanoparticles alleviate drought-induced alterations in sorghum performance, nutrient acquisition, and grain fortification, Sci. Total Environ., 2019, 688, 926–934 CrossRef CAS PubMed.
- L. Abeywardana, M. de Silva, C. Sandaruwan, D. Dahanayake, G. Priyadarshana and S. Chathurika, et al., Zinc-doped hydroxyapatite–urea nanoseed coating as an efficient macro–micro plant nutrient delivery agent, ACS Agric. Sci. Technol., 2021, 1, 230–239 CrossRef CAS.
- B. Sharma, M. Shrivastava, L. O. B. Afonso, U. Soni and D. M. Cahill, Zinc- and Magnesium-Doped Hydroxyapatite Nanoparticles Modified with Urea as Smart Nitrogen Fertilizers, ACS Appl. Nano Mater., 2022, 5, 7288–7299 CrossRef CAS.
- X. Xie, W. Hu, X. Fan, H. Chen and M. Tang, Interactions Between Phosphorus, Zinc, and Iron Homeostasis in Nonmycorrhizal and Mycorrhizal Plants, Front. Plant Sci., 2019, 10 DOI:10.3389/fpls.2019.01172.
- G. Gergely, F. Wéber, I. Lukács, A. L. Tóth, Z. E. Horváth and J. Mihály, et al., Preparation and characterization of hydroxyapatite from eggshell, Ceram. Int., 2010, 36, 803–806 CrossRef CAS.
- A. Pal, S. Maity, S. Chabri, S. Bera, A. R. Chowdhury and M. Das, et al., Mechanochemical synthesis of nanocrystalline hydroxyapatite from Mercenaria clam shells and phosphoric acid, Biomed. Phys. Eng. Express, 2017, 3, 015010 CrossRef.
- W. L. Suchanek, K. Byrappa, P. Shuk, R. E. Riman, V. F. Janas and K. S. TenHuisen, Preparation of magnesium-substituted hydroxyapatite powders by the mechanochemical–hydrothermal method, Biomaterials, 2004, 25, 4647–4657 CrossRef CAS PubMed.
- V. S. Bystrov, E. V. Paramonova, L. A. Avakyan, N. V. Eremina, S. V. Makarova and N. V. Bulina, Effect of Magnesium Substitution on Structural Features and Properties of Hydroxyapatite, Materials, 2023, 16, 5945 CrossRef CAS PubMed.
- M. V. Chaikina, N. V. Bulina, I. Y. Prosanov, O. B. Vinokurova and A. V. Ishchenko, Structure Formation of Zinc-Substituted Hydroxyapatite during Mechanochemical Synthesis, Inorg. Mater., 2020, 56, 402–408 CrossRef CAS.
- N. V. Bulina, O. B. Vinokurova, N. V. Eremina, I. Y. Prosanov, V. R. Khusnutdinov and M. V. Chaikina, Features of solid-phase mechanochemical synthesis of hydroxyapatite doped by copper and zinc ions, J. Solid State Chem., 2021, 296, 121973 CrossRef CAS.
- Y. Tang, H. F. Chappell, M. T. Dove, R. J. Reeder and Y. J. Lee, Zinc incorporation into hydroxylapatite, Biomaterials, 2009, 30, 2864–2872 CrossRef CAS PubMed.
- K. Matsunaga, H. Murata, T. Mizoguchi and A. Nakahira, Mechanism of incorporation of zinc into hydroxyapatite, Acta Biomater., 2010, 6, 2289–2293 CrossRef CAS PubMed.
- S. V. Makarova, N. V. Bulina, Y. A. Golubeva, L. S. Klyushova, N. B. Dumchenko and S. S. Shatskaya, et al., Hydroxyapatite Double Substituted with Zinc and Silicate Ions: Possibility of Mechanochemical Synthesis and In Vitro Properties, Materials, 2023, 16, 1385 CrossRef CAS PubMed.
- R. E. D. F. E. R. N. AWCJP, Kinetic Parameters from Thermogravimetric Data, Nature, 1964, 201, 1 CrossRef.
- N. Fairley, V. Fernandez, M. Richard-Plouet, C. Guillot-Deudon, J. Walton and E. Smith, et al., Systematic and collaborative approach to problem solving using X-ray photoelectron spectroscopy, Appl. Surf. Sci. Adv., 2021, 5, 100112 CrossRef.
- R. D. Shannon, Revised effective ionic radii and systematic studies of interatomic distances in halides and chalcogenides, Acta Crystallogr., Sect. A: Cryst. Phys., Diffr., Theor. Gen. Crystallogr., 1976, 32, 751–767 CrossRef.
- H. Maleki-Ghaleh, M. H. Siadati, A. Fallah, A. Zarrabi, F. Afghah and B. Koc, et al., Effect of zinc-doped hydroxyapatite/graphene nanocomposite on the physicochemical properties and osteogenesis differentiation of 3D-printed polycaprolactone scaffolds for bone tissue engineering, Chem. Eng. J., 2021, 426, 131321 CrossRef CAS.
- H. Liu, X. Cui, X. Lu, X. Liu, L. Zhang and T.-S. Chan, Mechanism of Mn incorporation into hydroxyapatite: Insights from SR-XRD, Raman, XAS, and DFT calculation, Chem. Geol., 2021, 579, 120354 CrossRef CAS.
- A. Antonakos, E. Liarokapis, A. Kyriacou and T. Leventouri, Raman and IR studies of the effect of Fe substitution in hydroxyapatites and deuterated hydroxyapatite, Am. Mineral., 2017, 102, 85–91 CrossRef.
- S. Gomes, J.-M. Nedelec, E. Jallot, D. Sheptyakov and G. Renaudin, Unexpected mechanism of Zn2+ insertion in calcium phosphate bioceramics, Chem. Mater., 2011, 23, 3072–3085 CrossRef CAS.
- W. J. Dufresne, C. J. Rufledt and C. P. Marshall, Raman spectroscopy of the eight natural carbonate minerals of calcite structure, J. Raman Spectrosc., 2018, 49, 1999–2007 CrossRef CAS.
- G. Cheng, Y. Zhang, H. Yin, Y. Ruan, Y. Sun and K. Lin, Effects of strontium substitution on the structural distortion of hydroxyapatite by rietveld refinement and Raman Spectroscopy, Ceram. Int., 2019, 45, 11073–11078 CrossRef CAS.
- P. Rajkumar and B. K. Sarma, Role of Zn and Mg substitutions on the mechanical behaviour of biomimetic hydroxyapatite and insight of the emergence of hydroxyapatite-ZnO nanocomposite, Mater. Charact., 2021, 176, 111107 CrossRef CAS.
- D. Stoilova, V. Koleva and V. Vassileva, Infrared study of some synthetic phases of malachite (Cu2 (OH) 2CO3)–hydrozincite (Zn5 (OH) 6 (CO3) 2) series, Spectrochim. Acta, Part A, 2002, 58, 2051–2059 CrossRef CAS PubMed.
- H. Zhou, L. Yang, U. Gbureck, S. Bhaduri and P. Sikder, Monetite, an important calcium phosphate compound–Its synthesis, properties and applications in orthopedics, Acta Biomater., 2021, 127, 41–55 CrossRef CAS PubMed.
- Y. Liu, J. Zhao, H. Zhang, Y. Zhu and Z. Wang, Thermal decomposition of basic zinc carbonate in nitrogen atmosphere, Thermochim. Acta, 2004, 414, 121–123 CrossRef CAS.
- M. Mayyas, M. Mayyas, F. Pahlevani, Z. Liu, R. Rajarao and V. Sahajwalla, From automotive shredder residue to nano-ceramics and graphitic carbon—Thermal degradation kinetics, J. Anal. Appl. Pyrolysis, 2016, 120, 60–74 CrossRef CAS.
- D. Predoi, S. L. Iconaru, A. Deniaud, M. Chevallet, I. Michaud-Soret and N. Buton, et al., Textural, structural and biological evaluation of hydroxyapatite doped with zinc at low concentrations, Materials, 2017, 10, 229 CrossRef PubMed.
- N. Lowry, M. Brolly, Y. Han, S. McKillop, B. Meenan and A. Boyd, Synthesis and characterisation of nanophase hydroxyapatite co-substituted with strontium and zinc, Ceram. Int., 2018, 44, 7761–7770 CrossRef CAS.
- R. R. Sheha, Sorption behavior of Zn(II) ions on synthesized hydroxyapatites, J. Colloid Interface Sci., 2007, 310, 18–26 CrossRef CAS PubMed.
- W. Huang, B. Xu, W. Yang, K. Zhang, Y. Chen and X. Yin, et al., Corrosion behavior and biocompatibility of hydroxyapatite/magnesium phosphate/zinc phosphate composite coating deposited on AZ31 alloy, Surf. Coat. Technol., 2017, 326, 270–280 CrossRef CAS.
- R. Sergi, D. Bellucci, R. T. Candidato, L. Lusvarghi, G. Bolelli and L. Pawlowski, et al., Bioactive Zn-doped hydroxyapatite coatings and their antibacterial efficacy against Escherichia coli and Staphylococcus aureus, Surf. Coat. Technol., 2018, 352, 84–91 CrossRef CAS.
- I. Ullah, M. A. Siddiqui, S. K. Kolawole, H. Liu, J. Zhang and L. Ren, et al., Synthesis, characterization and in vitro evaluation of zinc and strontium binary doped hydroxyapatite for biomedical application, Ceram. Int., 2020, 46, 14448–14459 CrossRef CAS.
- M. Wojcik, P. Kazimierczak, A. Belcarz, A. Wilczynska, V. Vivcharenko and L. Pajchel, et al., Biocompatible curdlan-based biomaterials loaded with gentamicin and Zn-doped nano-hydroxyapatite as promising dressing materials for the treatment of infected wounds and prevention of surgical site infections, Biomater. Adv., 2022, 139, 213006 CrossRef CAS PubMed.
Footnote |
| † Electronic supplementary information (ESI) available. See DOI: https://doi.org/10.1039/d3mr00012e |
| This journal is © The Royal Society of Chemistry 2024 |

