 Open Access Article
Creative Commons Attribution 3.0 Unported Licence
A comparative study of moisture adsorption on GO, MOF-5, and GO/MOF-5 composite for applications in atmospheric water harvesting†
Muhammad
Saeed-Ul-Hassan
a,
Muhammad
Ehtisham
a,
Ahmad K.
Badawi
 b,
Asad Muhammad
Khan
a,
Rafaqat Ali
Khan
a and
Bushra
Ismail
 *a
*a
aDepartment of Chemistry, COMSATS University Islamabad, Abbottabad Campus-22060, Pakistan. E-mail: msaeed5651123@gmail.com; muhammadehtasham10@gmail.com; amkhan@cuiatd.edu.pk; rafaqatali@cuiatd.edu.pk; bushraismail@cuiatd.edu.pk; Fax: +92 992 383595; Tel: +92 992 383592
bCivil Engineering Department, El-Madina Higher Institute for Engineering and Technology, Giza 12588, Egypt. E-mail: dr.ahmedkaram91@gmail.com
First published on 7th June 2024
Abstract
Water scarcity is an alarming situation across the globe. Several methods have been reported in the literature to minimize the water shortage problem. Sorbent-based atmospheric water harvesting (SBAWH) is considered an energy-efficient, low-cost strategy, and sustainable approach. In the present study, the synthesis of graphene oxide (GO) was carried out using a modified Hummers' method, while the synthesis of MOF-5 and a GO/MOF-5 composite was carried out using a solvothermal approach. The synthesized materials were characterized by X-ray diffraction analysis (XRD), scanning electron microscopy (SEM), and Fourier transform infrared spectroscopy (FTIR). The phase composition and crystallinity of all synthesized samples were confirmed by XRD analysis. SEM analysis provided information about the surface morphology of all synthesized samples. The adsorption of water vapors on surfaces of GO, MOF-5, and the GO/MOF-5 composite was evaluated by FTIR analysis. The negative charge was explored by the PZC technique on the surface of all synthesized materials. The water adsorption characteristics of GO, MOF-5, and the GO/MOF-5 composite were evaluated using an atmospheric water harvesting (AWH) plant. The maximum adsorption capacity of 542 mg g−1 was achieved by the MOF at 55% RH (relative humidity), while a low adsorption capacity of the MOF was observed at higher humidity values. This problem was overcome by making a GO/MOF-5 composite. GO imparts structural stability to the MOF-5 structure at higher humidity values. The maximum adsorption capacity of 1137 mg g−1 was achieved by the GO/MOF-5 composite at 75% RH. Several isotherm models, such as Langmuir, Freundlich, and Temkin, were applied to confirm the single-site occupation by water molecules and chemisorption behavior. Several thermodynamic properties were calculated, including isosteric heat (Qst), Gibbs free energy (ΔG), and sorption entropy (ΔS). The overall thermodynamics study confirms that the adsorption process is spontaneous and exothermic. In addition, second-order kinetics confirms that all synthesized material shows chemisorption behavior.
1. Introduction
Presently, shortages of water are now recognized as a prospective global issue. Although water covers 70% of the Earth's surface, only 2.5% of it is accessible as freshwater.1 The lack of water poses a significant challenge to the progress and advancement of human development. Statistics indicate that over two-thirds of the world's population, which amounts to 4 billion individuals, experiences acute water scarcity for a minimum of one month annually. Additionally, 500 million people endure persistent water shortages throughout the whole year.2 Groundwater in arid regions is persistently diminishing, and the water quality may pose risks to human well-being.3 Even non-arid regions with moderate yearly rainfall are also experiencing water stress.4 Power generation accounts for the largest share of global water consumption, and there might soon be a situation between prioritizing drinking water and meeting energy needs.5 Over fifty percent of the world's population will face water stress by 2050 as a result of rising populations, excessive resource usage, industrialization, and climate change.6 Hence, humans must discover a means of acquiring potable water in desert regions.The atmosphere contains over 13 sextillions (1021) liters of water, in the form of water vapors or droplets. This accounts for roughly 10% of all freshwater resources. The presence of water in our environment is a highly significant renewable resource, and the implementation of atmospheric water harvesting (AWH) technology is anticipated to reduce the impact of water scarcity on human beings.7
Various atmospheric water harvesting (AWH) techniques have been used in previous studies.8,9 The mechanism of SBAWH involves water vapor adsorption from air and its conversion into liquid water. There are three different approaches used in the AWH process: (1) fog capture using nets;10 (2) the condensation process;11 and (3) sorbent-based atmospheric water harvesting (SBAWH).12 The process of fog capture is restricted to specific geographical areas. In the condensation process, the ambient air must be cooled below its dew point temperature, and it requires a large amount of energy.13
SBAWH has received great attention from researchers due to its cost effectiveness and capability of functioning well in arid environments. The ideal adsorbents should possess high water uptake, low energy demand for water release, fast water capture/release, high cycling stability, and low cost.14 Numerous adsorbent materials are employed in SBAWH, including silica gel, hygroscopic substances, hydrogels, zeolite, and metal–organic framework (MOF). Conventional adsorbents are ideal for moisture capture, but their high regeneration temperature and low adsorption capacity compared to MOFs limit their application in AWH.15
MOF nanocomposites can be utilized in several applications, such as catalysis, wastewater treatment, drug delivery, and adsorption. MOFs act as suitable adsorbents due to several properties, such as high porosity and high adsorption capacity, which makes them ideal for SBAWH.16 A group of researchers used MOF-801 as an effective adsorbent for moisture capture, achieving an adsorption capacity of 1 L kg−1 day−1.17 Numerous adsorbents have been previously used in the literature, such as Co-based MOF-31,18 MOF-801 (Zr6O4(OH)4(fumarate)6), MOF-303 (Al(OH)(HPDC)),19 poly(2-acrylamido-2-methyl-1-propanesulfonic acid) (PAMPS) hydrogel,20 porous carbon cuboids,21 and Zn1−xCoxFe2O4 (x = 0.6).22
In the present study, the water vapor adsorption capacity of GO, MOF-5, and a GO/MOF-5 composite was compared. MOF-5 is considered a good adsorbent due to its porous structure. Graphene oxide (GO) is composed of several functional groups, including COOH, OH, and RCOR. GO's groups and layer structure make it suitable for various adsorption applications. When combined with MOF-5, the oxygen-containing functional groups in GO can react with the metal ions in MOF-5 to create a GO/MOF-5 composite, while GO imparts extra stability to the MOF-5 structure. The objective of this study was to prepare and characterize the GO/MOF-5 composite and use it as a sorbent for moisture adsorption studies for application in atmospheric water harvesting.
2. Experimental
2.1 Synthesis of graphene oxide
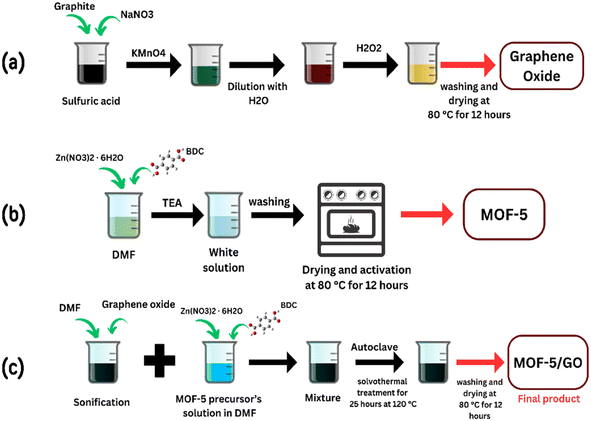
To produce the graphene oxide, a modified Hummer's process was employed. Graphite powder (1 g), sodium nitrate (0.5 g), and sulfuric acid (25 mL) were mixed, and the resultant solution was sterilized under a cold bath for thirty minutes. After stirring, 3 g of KMnO4 was progressively added, and the mixture was then stirred for a further 3 hours. The solution was stirred for an extra hour at 35 °C after being removed from the cold bath. Finally, 50 mL of water was poured and stirred for an hour and further sterilized for another hour with the addition of 100 mL of deionized water. To remove any excess potassium permanganate, 5 mL of hydrogen peroxide was added. Afterward, the precipitate was separated by centrifugation, washed with distilled water to remove unreacted residue, and then dried inside the vacuum oven at 80 °C.232.2 Synthesis of MOF-5
MOF-5 was synthesized by a previously reported procedure. First, 0.62 g of zinc nitrate hexahydrate and 0.16 g of terephthalic acid were completely dissolved in 20 mL of dimethyl formamide (DMF). Subsequently, 11 mL of tetra ethylene amine (TEA) was gradually added while stirring. After that, the resulting mixture was agitated for two hours at ambient temperature. Following the completion of the reaction, the solid-form precipitates were recovered by centrifugation, and they were then added to DMF for three days and washed three times with ethanol, respectively. Finally, the powder MOF-5 was dried at 80 °C for 12 hours.242.3 Synthesis of composite
To create a DMF emulsion of GO, 0.33 g of GO was sonicated and dispersed in DMF. The solvothermal process was used to synthesize the GO/MOF-5 composite with some modifications. In short, Zn (NO3)2·6H2O (5.2 g) and 1,4-benzene dicarboxylic acid (BDC) (1.0 g) were dissolved in 35 mL of GO/DMF solution. The resulting mixture was treated solvothermally at 120 °C for 25 hours. Finally, the obtained sample was washed with DMF and ethanol, and the GO/MOF-5 composite was produced by vacuum drying at 80 °C for 12 hours (Fig. 1).252.4 Characterization
The XRD analysis, conducted using the PAN analytical 3040/60X'Pert PRO, was used to assess the composition of the phases and crystallinity. The lattice parameter (a), volume of cell (Vcell), crystallite size (D), and X-ray density (ρx-ray) of the synthesized samples were determined by applying the following equations.| a = d2 (h2 + k2+ l2)1/2 | (1) |
| Vcell = a3 | (2) |
 | (3) |
 | (4) |
2.5 Point of zero charge
The point of zero charge was determined using the salt addition method. In the salt addition method, 12.5 mg of the sample was mixed in 5 mL of NaNO3 solution having a concentration of 0.1 M while keeping the pH between 2, 4, 6, 8, 10, and 12. Dropwise additions of 0.1 M solutions of HCl and NH4OH were used to alter the initial pH (pHi) readings. All these samples were put on an orbital shaker for 24 hours to check for pH changes after maintaining the appropriate pH levels. The pHpzc value may be found by plotting a graph between the change in pH (ΔpH) and the initial pH (pHi). When the value of pH is higher than pHpzc (pH > pHpzc), the surface is negatively charged, and when it is smaller than pHpzc (pH < pHpzc), it contains a positive charge.263. Adsorption studies
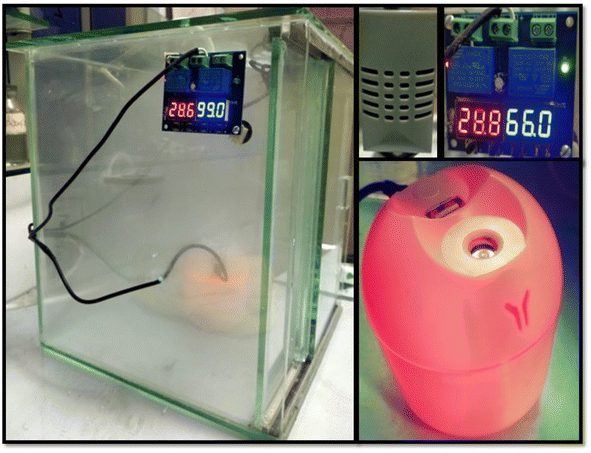
The freshly prepared samples were washed, filtered, and dried at 80 °C for two hours to achieve a constant weight. The water vapor adsorption was carried out using the AWH plant. An AWH plant was simply made up of glass in which a humidifier was placed to generate water vapors, and a small fan was used to spread out water vapors in a closed environment. Furthermore, a small screen was employed to check the change in humidity and temperature inside the closed AWH plant.The adsorption experiments were carried out by placing some freshly prepared samples in a closed system and checking their moisture content by varying the RH from 45% to 95%. The material's overall moisture content was calculated using gravimetric analysis. Initially, the dry weight of the sample was measured and then placed in an AWH plant for 20 minutes. The overall weight changes before and after water vapor adsorption give information about the moisture content in each sample. The same process was repeated again and again until a saturation point was achieved. The highest amount of water captured at saturation point was the equilibrium moisture content (EMC) of all the samples. The same process was repeated to get the moisture content values for all samples in various humidity conditions.
3.1 Isotherm modeling
To find out the adsorption capacity of each sample, the moisture content plotted against time, which yields the value of equilibrium moisture content, is done using experimental data from the water vapor adsorption experiment described above. The amount of water in the material is indicated by its moisture content (Mc). The formula below can be used to determine moisture content. | (5) |
The measured moisture content can be expressed as (g g−1) or (mg g−1). The plot of the moisture content at equilibrium and the activity of water (aw) may also be explored using the Mc values.
The adsorption isotherm is a significant factor in the process of adsorption. The adsorption isotherms describe the underlying events and interactions that occur between the adsorbate and adsorbent. In general, the predictive capability of adsorption performance can be attributed to the utilization of adsorption isotherm modeling. In this study, we used several models, such as Langmuir, Freundlich, and Temkin models, to evaluate the adsorption process. Every model has its significance.
The following equation represents the Langmuir isotherm.27
 | (6) |
 | (7) |
The following equation is used to represent the Freundlich isotherm:27
 | (8) |
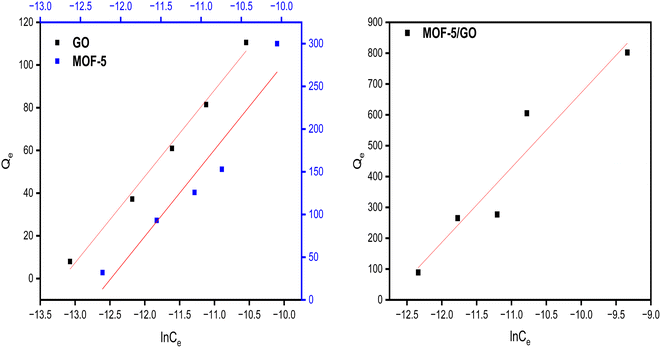
The following equation is employed to represent the Temkin isotherm:27
Qe = BT![[thin space (1/6-em)]](https://www.rsc.org/images/entities/char_2009.gif) ln ln![[thin space (1/6-em)]](https://www.rsc.org/images/entities/char_2009.gif) AT + BT AT + BT![[thin space (1/6-em)]](https://www.rsc.org/images/entities/char_2009.gif) ln ln![[thin space (1/6-em)]](https://www.rsc.org/images/entities/char_2009.gif) Ce Ce | (9) |
3.2 Kinetics study
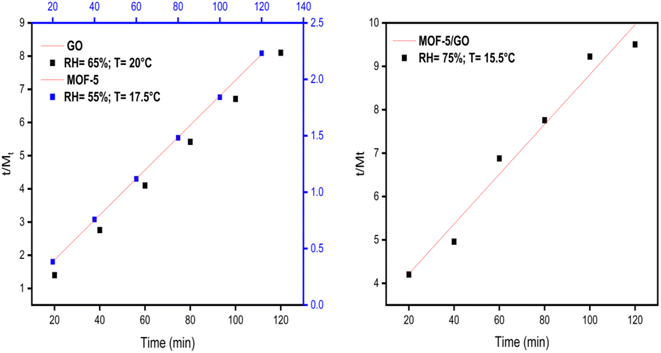
The kinetic behavior of synthesized materials for the adsorption of moisture was assessed using both “Lagergren's” first-order adsorption kinetics model and second-order adsorption kinetics model, respectively. Both models were utilized by employing the below parameters. The water content at time t and its equilibrium moisture content can be calculated: | (10) |
 | (11) |
The first-order adsorption kinetics model was developed to elucidate the behavior of adsorption. The adsorption rate was believed to be dependent on the amount of adsorption, with the variation in adsorption amounts acting as the primary driving force for adsorption. The first-order kinetic model is represented by the corresponding equation:
| Mt = Me + (MO − Me)e−k1t | (12) |
The parameter k1 represents the adsorption rate constant for first-order kinetics, measured in units of h−1.
The second-order kinetics model was employed to elucidate the process of adsorption, which comprises chemical reactions involving the formation and breaking of molecular bonds. The calculation of the equilibrium adsorption quantity, Me, may be determined using the following equation:
 | (13) |
Both models were applied using the following parameters. The pseudo-second-order kinetic model was well fitted to the as-synthesized materials as compared to the first-order kinetic model.
3.3 Thermodynamic studies
The thermodynamic study is based on several parameters. These parameters are isosteric heat of adsorption, Gibbs free energy, and entropy.| Qst = qst + HL | (14) |
 | (15) |
ΔG = RT![[thin space (1/6-em)]](https://www.rsc.org/images/entities/char_2009.gif) ln ln![[thin space (1/6-em)]](https://www.rsc.org/images/entities/char_2009.gif) aw aw | (16) |
They provide information about the adsorption process, whether it is exothermic, endothermic, non-spontaneous, or favorable. The negative value of ΔG reveals that the process of adsorption is spontaneous, while the positive value shows that the process is endothermic.28
4. Results and discussion
4.1 Characterization
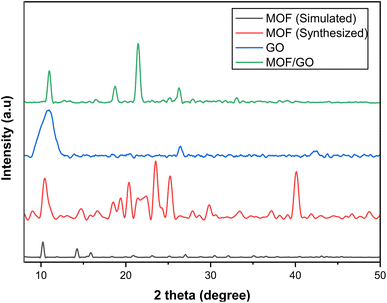
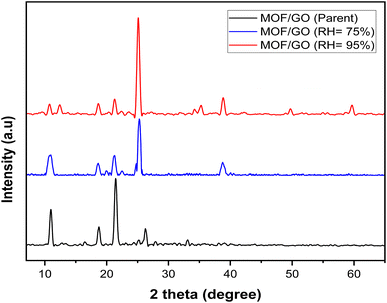
The synthesized samples of MOF-5, GO, and the MOF-5/GO composite were characterized by XRD analysis to study phases. The XRD pattern of synthesized materials is shown in Fig. 2. The sharp and intense peaks of GO are observed with hkl values of (001,002,100), respectively. At 26°, typical (002) planes of graphite are seen (ICSD File. 75-2078). The diffraction patterns of the graphene oxide samples show a peak at around 11°, corresponding to the (001) plane, and another at about 43° with the (100) plane (JCPDS No. 82-2261). In addition, the GO interfacial distance was raised with a d-spacing of 0.77 nm (FWHM = 0.4368). This increase was caused by the incorporation of oxide functional groups, such as OH, C–O, C![[double bond, length as m-dash]](https://www.rsc.org/images/entities/char_e001.gif) O, and COOH, during chemical oxidization reactions at the graphite basal planes. As a result, there was a large gap between the succeeding carbon layers.29
O, and COOH, during chemical oxidization reactions at the graphite basal planes. As a result, there was a large gap between the succeeding carbon layers.29
The diffraction patterns of MOF-5 are in agreement with the previously reported pattern by Yaghi et al.30 and that reported by Huang et al.31 The observed patterns are also closely related to the single crystal pattern (CCDI File No. 1516287). MOF-5 shows sharp peaks at 2 theta values of 10.72°, 21.3°, 23.9°, 25.53°, and 41.57°, with hkl values of 220, 660, 640, 731, and 882, respectively. Several patterns are also observed between 30° and 40°, which might be the phase of free zinc oxide.32 There is somehow a change in the peak position and intensity, which is due to the different crystal growth and atomic orientation, but they do not change the crystal structure of the material. A diffraction peak at 2θ of 10°, 18°, 21°, 25°, and 32° is seen in GO/MOF-5 (Fig. 3). Since MOF-5 is our primary component in the hybrid, the GO/MOF-5 diffraction pattern resembles that of MOF-5, suggesting that the MOF-5 structure is retained and does not undergo GO-induced deformation.
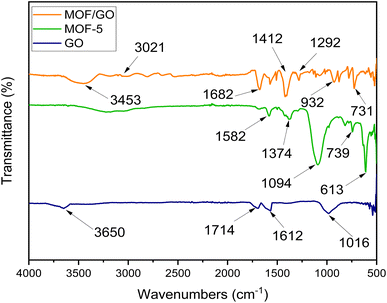
The prepared samples were characterized by FTIR to determine the functional groups and chemical structure. The FTIR spectra of GO, MOF-5, and GO/MOF-5 are similar to those reported in the literature.33 For graphene oxide, the existence of an O–H group was confirmed by the medium-sharp peak that emerged at a wavelength of 3650 cm−1. Additionally, at a frequency of 1612 and 1714 cm−1, the C![[double bond, length as m-dash]](https://www.rsc.org/images/entities/char_e001.gif) C and C
C and C![[double bond, length as m-dash]](https://www.rsc.org/images/entities/char_e001.gif) O stretching was observed, while the CO stretching was observed at 1016 cm−1. Since COOH, OH, C
O stretching was observed, while the CO stretching was observed at 1016 cm−1. Since COOH, OH, C![[double bond, length as m-dash]](https://www.rsc.org/images/entities/char_e001.gif) O, and C–O groups were present, it was determined that oxygen atoms were heavily occupied along the edges and basal plane of GO, indicating the confirmation of graphene oxide.29
O, and C–O groups were present, it was determined that oxygen atoms were heavily occupied along the edges and basal plane of GO, indicating the confirmation of graphene oxide.29
In the FTIR spectrum of MOF-5, the peaks before 1000 cm−1 show the presence of metal oxide. The peak appearing around 1370 cm−1 is caused by symmetric stretching of the carboxylic group in BDC, while the peak appearing at 1582 cm−1 shows the asymmetric stretching of the carboxylic group. In GO/MOF-5, the peaks at 1292 cm−1, 1412 cm−1, and 1682 cm−1 represent C–O, OH bending, and C![[double bond, length as m-dash]](https://www.rsc.org/images/entities/char_e001.gif) O, respectively, whereas the band at 3021 cm−1 corresponds to C–H bending. The broad band at 3453 cm−1 must be due to the overlapping bands from OH, indicating the presence of water content on a sample (Fig. 4).34
O, respectively, whereas the band at 3021 cm−1 corresponds to C–H bending. The broad band at 3453 cm−1 must be due to the overlapping bands from OH, indicating the presence of water content on a sample (Fig. 4).34
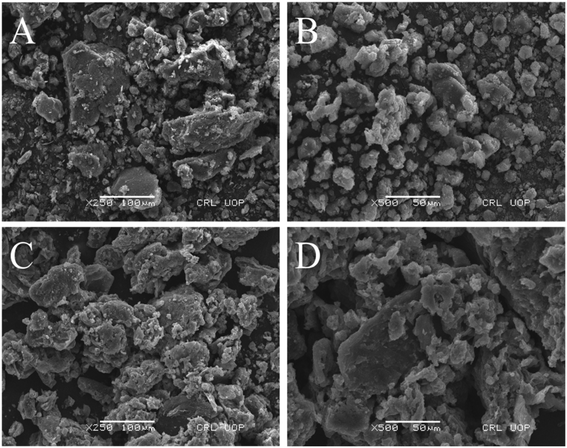
The surface morphology of the synthesized composite was revealed by scanning electron microscopy. It is observed from Fig. 2(a and b) that the GO and MOF-5 sample surfaces contain spherical particles of different sizes.
From Fig. 5(c and d), it is clearly seen that the incorporation of GO into MOF-5 increases the overall porosity of the GO/MOF-5 composite. The high-water vapor adsorption capacity of the GO/MOF-5 composite might be due to the increase in functional group and porosity.
Points of zero charge (PZC) were employed to analyze the charge on the surface of the materials. The exterior charge of materials is important for studying the mechanism of water interaction with materials. The salt addition method was applied to ascertain the point of zero charge. The determination of the point of zero charges (pHpzc) of prepared samples is presented in Fig. S1.† The pHpzc of graphene oxide is 6.9, that of MOF-5 is 6.0, and that of GO/MOF-5 is 1.83, which is less than the pH of water (7.4), as pH > (pHpzc), which indicates that the charge on the surface of all materials is negative. The negative charge on the surface of materials might be due to the presence of various functional groups such as hydroxyl, epoxy, ester, and carboxylic groups.
4.2 Moisture adsorption studies
The moisture content of all the samples was determined using the same process as described in Section 2.6. The plots of moisture content (Mc) and time were plotted using Origin software and MS Excel. Initially, the sites on the material surface are accessible for adsorption; with time, sites are occupied by water molecules, and equilibrium is achieved. The point at which equilibrium is established is known as the saturation point. The state in which material neither absorbs nor desorbs moisture is called equilibrium moisture content (EMC). After the sorption point, the adsorption of the material starts to decrease. The adsorption of water vapor depends on the RH%. At different RH%, different moisture contents of materials are obtained.When considering graphene oxide (GO), the moisture content rises as the relative humidity (RH%) rises. This is happening since there are many sites available for binding owing to the many functional groups that readily capture water molecules. On the other hand, the Mc value in the case of MOF-5 increases little at first. Unexpected fluctuations in the water content of MOF-5 are noticed at a relative humidity of 55%. This is followed by a further decrease in water content at a relative humidity of 61%. The rapid rise in moisture content of MOF-5 between RH 43% and RH 63% may be attributed to its unstable nature toward higher humidity levels. This is caused by an abrupt breakdown in their structure caused by weak metal oxide bonds, which ultimately triggers a hydrolysis process in MOF-5.35 When compared to MOF-5, the GO/MOF-5 composite shows a significant rise in moisture content; at 75% relative humidity, the maximum moisture value of 1137 mg g−1 is achieved.
At 75% RH, exceptional behavior in water uptake performance for the GO/MOF-5 composite is observed. This is due to the capillary condensation process that takes place at the surface of the material. From 0 to 120 min, the water molecule binds to the functional group at primary adsorption sites through hydrogen bonding. From 120 to 140 min, a steep rise is observed in the case of the GO/MOF-5 composite. This reveals that there is a pore filling of material that takes place at this stage. Beyond 140, all the available sites are filled with water vapor, so there is no further increase in moisture content (Fig. 6).36–38
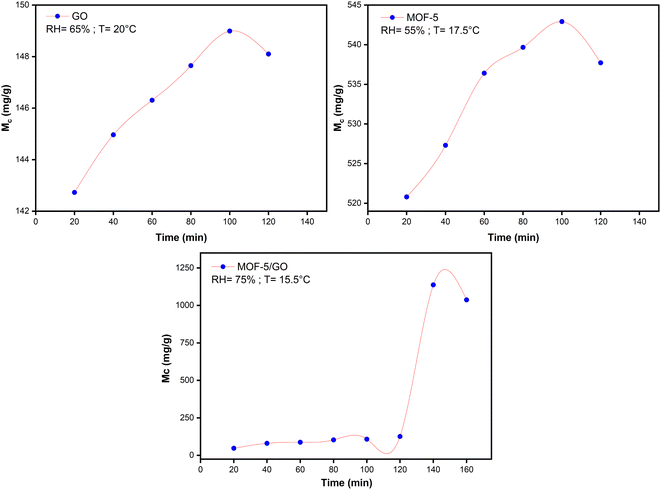 | ||
| Fig. 6 Maximum moisture content (Mc) study against time (min) on GO, MOF-5, and the GO/MOF-5 composite. | ||
Based on the studies regarding moisture content, GO is making MOF-5 more hydrolytically stable and increasing the adsorption capability of the GO/MOF-5 composite. Due to the strong pi–pi interactions and decreased repellent hydration forces between the sheets of GO, GO exhibits strong hydrophilicity and quick water dynamics.39,40 These properties lead the MOF-5 to become more durable in water.
4.3 Adsorption isotherms
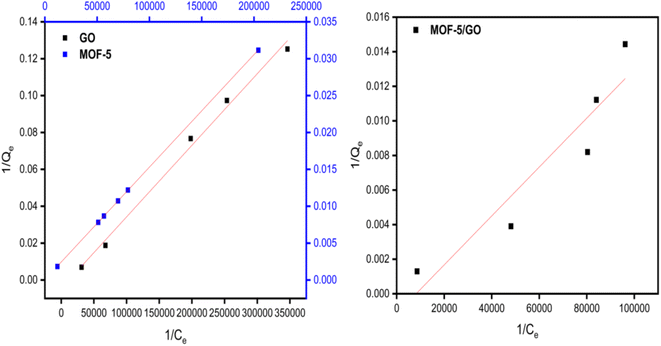
The adsorption isotherm constitutes one of the crucial elements of adsorption. The phenomenon and interactions among adsorbate and adsorbent are explained by the adsorption isotherms. The adsorption isotherm model may offer information on the adsorbent's adsorption capacity, the mechanism of adsorption, and the assessment of the adsorption process's performance. The obtained data were fitted to various adsorption isotherms to determine the nature of the adsorption.According to the Langmuir isotherm, the presence of a single layer of adsorbate on the adsorbent surface causes the maximum adsorbent capacity to occur. The following equation represents the isotherm of Langmuir.27 A value of RL >1 is not a favorable adsorption mechanism, RL = 1 is straight, while RL = 0 is an irreversible mechanism of adsorption (Fig. 8).
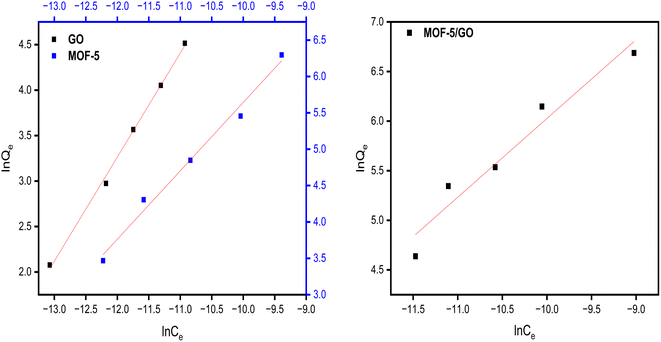
Freundlich isotherms describe a physical adsorption known as multilayer adsorption, where the interactions between the molecules are weak and the adsorption takes place in many layers. The value of n describes linear adsorption when n = 1, physisorption when n > 1, and chemisorption when n < 1. The Freundlich model fits well with all materials (Fig. 9).
Temkin model for all samples presented in (Fig. 10). The Temkin isotherm presupposes three assumptions: the impact of indirect adsorbate/adsorbate correlations on the adsorption procedure; homogenous spreading of binding energy; and adsorption heat of atoms falling linearly with the coverage of the adsorbent surface.
B T is the coefficient of adsorption heat, and AT is the bonding equilibrium constant. However, the BT value provides details on the chemisorption or physisorption process. The process of adsorption occurs physically if BT < 8 kJ mol−1 and chemically when BT > 8 kJ mol−1.
The parameters of all isotherm model were compared, along with the R-square values (Table 1). It was concluded that there is linear sorption and chemisorption behavior in every material based on the isotherm study.
| Material | Langmuir | Freundlich | Temkin |
|---|---|---|---|
| R 2/RL | R 2/n | R 2/BT (kJ mol−1) | |
| GO | 0.994/0.52 | 0.997/1 | 0.99/40.43 |
| MOF-5 | 0.99/0.99 | 0.99/1 | 0.92/11.70 |
| GO/MOF-5 | 0.887/1.00 | 0.88/1 | 0.91/24.26 |
4.4 Kinetics study
Plotting t/Mtvs. time (t) results in a straight line with values for the intercept, slope, Me, R2, and second-order rate constant (Fig. 11). The greater value of the linear regression correlation coefficient R2 was obtained using the second-order kinetics model. As a result, the experimental results and parameters have a very strong correlation. Second-order kinetics also reveal that the material exhibits chemisorption behavior. The values of the slope, intercept, second-order rate constant (k2), and experimental and theoretical Me for GO, MOF-5, and the GO/MOF-5 composite are given in Tables S2–S4 and 2.†| Material | RH% | Slope (m) | Intercept (c) | M e (Th) | M e (Exp) (mg g−1) | k 2 (min−1) |
|---|---|---|---|---|---|---|
| GO | 65 ± 3 | 0.0666 | 0.0808 | 14.8993 | 14.9927 | 0.0550 |
| MOF-5 | 55 ± 3 | 0.01836 | 0.0176 | 54.2913 | 54.4662 | 0.1915 |
| GO/MOF-5 | 75 ± 3 | 0.05742 | 3.06936 | 13.7475 | 17.4155 | 0.01074 |
4.5 Thermodynamics study
| Qst = qst + HL | (17) |
The Clausius–Clapeyron equation was used to drive it by the graph of 1/T vs. ln![[thin space (1/6-em)]](https://www.rsc.org/images/entities/char_2009.gif) aw.
aw.
 | (18) |
Using the slope derived from the equation, the isosteric heat of adsorption (Qst) was calculated.
 | (19) |
 | (20) |
 | (21) |
| ΔS = −27.20 × 8.314 |
| ΔS = −0.2261 kJ mol−1 |
ΔG = RT![[thin space (1/6-em)]](https://www.rsc.org/images/entities/char_2009.gif) ln ln![[thin space (1/6-em)]](https://www.rsc.org/images/entities/char_2009.gif) aw aw | (22) |
ΔG = RT![[thin space (1/6-em)]](https://www.rsc.org/images/entities/char_2009.gif) ln ln![[thin space (1/6-em)]](https://www.rsc.org/images/entities/char_2009.gif) aw aw | (23) |
| ΔG = 8.314 × 289.4 × ln(0.75) |
| ΔG = −6.91 kJ mol−1 |
The value of ΔG for the GO/MOF-5 composite is negative, so the process of adsorption is spontaneous in nature.
The change in Gibbs free energy (ΔG) with Xeq for GO, MOF-5, and the GO/MOF-5 composite is represented in Fig. S8–S10.† The ΔG for synthesized material varied from −1.95 to −1.22 kJ mol−1. The negative value for all samples confirms that the water vapor adsorption process is spontaneous at different humidity levels.28
5. Conclusion
Over the past few years, MOFs and MOF-based composites have received great attention in wastewater treatment and AWH. MOFs and MOF-based composites act as effective adsorbent materials due to their high porosity, tunable pore sizes, easy functionalization, high adsorption capacity, and surface area, making them ideal for the adsorption process. In the present study, we synthesized GO, MOF-5, and a GO/MOF-5 composite and evaluated their behavior toward water vapor adsorption. The synthesized materials were characterized by XRD, SEM, and FTIR analysis. XRD analysis confirms the successful synthesis of the materials. SEM analysis confirms the formation of well-shaped particles and a porous GO/MOF-5 composite. In FTIR analysis, the peak observed at 3000–3650 cm−1 confirms the presence of water vapor adsorption on all the synthesized samples. PZC confirms the presence of a negative charge on all synthesized samples. MOFs are stable at lower humidity values and show structure changes at higher humidity values. MOF-5 shows a Mc value of 29 mg g−1 and 542 mg g−1 at a RH of 45% to 95%. At 65% RH, the Mc value of MOF-5s greatly decreased from 542 mg g−1 to 81 mg g−1. The incorporation of GO imparts great structural strength to MOF-5 at higher humidity values. The Mc values of the GO/MOF-5 composite increased from 89 mg g−1 to 1137 mg g−1 at 45% to 95% RH. The results evaluated from the isosteric heat of adsorption, entropy, and Gibbs free energy suggest that the water vapor adsorption process was exothermic and spontaneous. The second-order kinetics model confirms the chemisorption behavior of all the synthesized materials. The high adsorption capacity of the GO/MOF-5 composite makes it ideal for applications in AWH.Author contributions
Muhammad Saeed-Ul-Hassan: conceived and designed the experiments, performed the experiments, analyzed the data, prepared figures and/or tables, and wrote the original draft. Muhammad Ehtisham: conceived and designed the experiments, analyzed the data, and wrote the original draft. Bushra Ismail (CA): Supervised, provided chemicals, conceived and designed the experiments, analyzed the data, authored or reviewed drafts of the article, and validated and approved the final draft. Ahmad K. Badawi: authored or reviewed drafts of the article, edited, and validated and approved the final draft. Asad Muhammad Khan: provided chemicals and performed XRD and analyzed the results. Rafaqat Ali Khan: performed and analyzed the FTIR analysis.Conflicts of interest
There are no conflicts to declare.References
- G. Raveesh, R. Goyal and S. K. Tyagi, Energy Convers. Manage., 2021, 239, 114226 CrossRef.
- M. M. Mekonnen and A. Y. Hoekstra, Sci. Adv., 2016, 2, e1500323 CrossRef PubMed.
- L. Kumar, M. J. Deitch, I. A. Tunio, A. Kumar, S. A. Memon, L. Williams, U. Tagar, R. Kumari and S. Basheer, Case Stud. Chem. Environ. Eng., 2022, 6, 100232 CrossRef CAS.
- P. Burek, Y. Satoh, G. Fischer, M. T. Kahil, A. Scherzer, S. Tramberend, L. Nava, Y. Wada, S. Eisner and M. Flörke, Water futures and solution-fast track initiative, 2016 Search PubMed.
- P. Faeth and B. K. Sovacool, Capturing synergies between water conservation and carbon dioxide emissions in the power sector, CNA Analysis and Solutions, Virginia, 2014 Search PubMed.
- A. E. Ercin and A. Y. Hoekstra, Environ. Int., 2014, 64, 71–82 CrossRef PubMed.
- G. Tao, X. Chen, Y. Wang, Z. Ding, D. Wang, J. Wang, J. Ding, X. Wang, Z. Cheng and L. Cheng, J. Clean. Prod., 2023, 419, 138296 CrossRef CAS.
- H. Kim, S. R. Rao, E. A. Kapustin, L. Zhao, S. Yang, O. M. Yaghi and E. N. Wang, Nat. Commun., 2018, 9, 1191 CrossRef PubMed.
- M. J. Kalmutzki, N. Hanikel and O. M. Yaghi, Sci. Adv., 2018, 4(10), eaat9180 CrossRef CAS PubMed.
- O. Klemm, R. S. Schemenauer, A. Lummerich, P. Cereceda, V. Marzol, D. Corell, J. van Heerden, D. Reinhard, T. Gherezghiher, J. Olivier, P. Osses, J. Sarsour, E. Frost, M. J. Estrela, J. A. Valiente and G. M. Fessehaye, AMBIO, 2012, 41, 221–234 CrossRef PubMed.
- B. Gido, E. Friedler and D. M. Broday, Atmos. Res., 2016, 182, 156–162 CrossRef.
- N. Hanikel, M. S. Prévot and O. M. Yaghi, Nat. Nanotechnol., 2020, 15, 348–355 CrossRef CAS PubMed.
- Y. Tu, R. Wang, Y. Zhang and J. Wang, Joule, 2018, 2, 1452–1475 CrossRef CAS.
- X. Zhou, H. Lu, F. Zhao and G. Yu, ACS Mater. Lett., 2020, 2, 671–684 CrossRef CAS.
- S. V. Boriskina, A. Raza, P. Wang, T. Zhang, L. Zhou and J. Zhu, MRS Bull., 2019, 44, 59–66 CrossRef.
- X. Huang, Q. Qin, Q. Ma and B. Wang, Water, 2022, 14(21), 3487 CrossRef CAS.
- W. Xu and O. M. Yaghi, ACS Cent. Sci., 2020, 6, 1348–1354 CrossRef CAS PubMed.
- S. Li, P. Wu, L. Chen, Y. Tang, Y. Zhang, L. Qin, X. Qin and H. Li, J. Water Proc. Eng., 2024, 58, 104899 CrossRef.
- Z. Chen, X. Yang, Z. Cui, S. Du and R. Wang, Nano Energy, 2024, 125, 109596 CrossRef CAS.
- A. Feng, Y. Shi, C. Onggowarsito, X. S. Zhang, S. Mao, M. A. Johir, Q. Fu and L. D. Nghiem, ChemSusChem, 2024, e202301905 CrossRef PubMed.
- G. P. Hao, G. Mondin, Z. Zheng, T. Biemelt, S. Klosz, R. Schubel, A. Eychmüller and S. Kaskel, Angew. Chem., Int. Ed., 2015, 54, 1941–1945 CrossRef CAS PubMed.
- M. Ehtisham, A. K. Badawi, A. M. Khan, R. A. Khan and B. Ismail, RSC Adv., 2024, 14, 6165–6177 RSC.
- E. H. Sujiono, D. Zabrian, M. Y. Dahlan, B. D. Amin and J. Agus, Heliyon, 2020, 6(8), e04568 CrossRef CAS PubMed.
- G. Chen, J. Luo, M. Cai, L. Qin, Y. Wang, L. Gao and J. Ni, Molecules, 2019, 24(18), 3369 CrossRef CAS PubMed.
- Z. Karimzadeh, S. Javanbakht and H. Namazi, BioImpacts, 2019, 9(1), 5 CrossRef CAS PubMed.
- J. J. Gulicovski, L. S. Čerović and S. K. Milonjić, Mater. Manuf. Processes, 2008, 23, 615–619 CrossRef CAS.
- R. Ragadhita and A. B. D. Nandiyanto, Indones. J. Sci. Technol., 2021, 6, 205–234 CrossRef.
- Z.-S. Zhang, X.-d. Li, H.-J. Jia and Y.-l. Liu, Lwt, 2022, 167, 113866 CrossRef CAS.
- N. M. S. Hidayah, W. W. Liu, C. W. Lai, N. Z. Noriman, C. S. Khe, U. Hashim and H. C. Lee, AIP Conf. Proc., 2017, 1892(1), 150002 CrossRef.
- H. Li, M. Eddaoudi, M. O'Keeffe and O. M. Yaghi, Nature, 1999, 402, 276–279 CrossRef CAS.
- L. Huang, H. Wang, J. Chen, Z. Wang, J. Sun, D. Zhao and Y. Yan, Microporous Mesoporous Mater., 2003, 58, 105–114 CrossRef CAS.
- M. M. Peng, U. J. Jeon, M. Ganesh, A. Aziz, R. Vinodh, M. Palanichamy, H. T. Jang and J. Bull, Korean Chem. Soc, 2014, 35, 3213 CrossRef CAS.
- Z.-H. Huang, G. Liu and F. Kang, ACS Appl. Mater. Interfaces, 2012, 4, 4942–4947 CrossRef CAS PubMed.
- G. Kumar and D. T. Masram, ACS Omega, 2021, 6, 9587–9599 CrossRef CAS PubMed.
- Y. Ming, J. Purewal, J. Yang, C. Xu, R. Soltis, J. Warner, M. Veenstra, M. Gaab, U. Müller and D. J. Siegel, Langmuir, 2015, 31, 4988–4995 CrossRef CAS PubMed.
- X. Zheng, Z. Li, Y. Wu, Y. Liu, Z. Wu and P. Zhang, Chem. Eng. J., 2024, 483, 148920 CrossRef CAS.
- U. Legrand, D. Klassen, S. Watson, A. Aufoujal, B. Nisol, R. Boudreault, K. E. Waters, J.-L. Meunier, P.-L. Girard-Lauriault and M. R. Wertheimer, Ind. Eng. Chem. Res., 2021, 60, 12923–12933 CrossRef CAS.
- H. Misran, S. Othman, N. Mahadi, Z. Aspanut, Z. Lockman, A. Matsumoto and N. Amin, Acta Phys. Pol., 2019, 135, 1119–1122 CrossRef CAS.
- F. Mouhat, F.-X. Coudert and M.-L. Bocquet, Nat. Commun., 2020, 11, 1566 CrossRef CAS PubMed.
- W. Yuan, C. Li, T. Chu, M. Cheng and S. Hou, Mater. Lett., 2022, 314, 131849 CrossRef CAS.
- Y. Li, J. Miao, X. Sun, J. Xiao, Y. Li, H. Wang, Q. Xia and Z. Li, Chem. Eng. J., 2016, 298, 191–197 CrossRef CAS.
- Y. Ming, N. Kumar and D. J. Siegel, ACS Omega, 2017, 2, 4921–4928 CrossRef CAS PubMed.
- J. A. Greathouse and M. D. Allendorf, J. Am. Chem. Soc., 2006, 128, 10678–10679 CrossRef CAS PubMed.
Footnote |
| † Electronic supplementary information (ESI) available. See DOI: https://doi.org/10.1039/d4na00150h |
| This journal is © The Royal Society of Chemistry 2024 |

