 Open Access Article
Soft colloidal monolayers with reflection symmetry through confined drying†
Sanjib
Majumder
 ac,
Madivala G.
Basavaraj
 *bc and
Dillip K.
Satapathy
 *ac
*ac
aSoft Material Laboratory, Department of Physics, IIT Madras, Chennai-600036, India
bPECS Lab, Department of Chemical Engineering, IIT Madras, Chennai-600036, India. E-mail: basa@iitm.ac.in
cCentre for Soft and Biological Matter, IIT Madras, Chennai-600036, India. E-mail: dks@iitm.ac.in
First published on 23rd July 2024
Abstract
Colloidal monolayers serve as fundamental building blocks in fabricating diverse functional materials, pivotal for surface modifications, chemical reactivity, and controlled assembly of nanoparticles. In this article, we report the formation of colloidal monolayers generated by drying an aqueous droplet containing soft colloids confined between two hydrophilic parallel plates. The analysis of the kinetics of evaporation in this confined mode showed that: (i) for a significant portion of the drying time, the drops adopt a catenoid configuration; (ii) in the penultimate stage of drying, the catenoid structure undergoes division into two daughter droplets; (iii) the three-phase contact line remains pinned at a specific location while it continuously slips at all other locations. The interplay between interface-assisted particle deposition onto the solid substrate and the time evolution of particle concentration within the droplet during evaporation results in unique microstructural features in the deposited patterns. Notably, these deposit patterns exhibit reflection symmetry. The microstructural features of the dried deposits are further quantified by calculating the particle number density, inter-particle separation, areal disorder parameter, and bond orientational order parameter. The variation of these parameters for deposits formed under different conditions, such as by altering the spacing between parallel plates and the concentration of microgel particles in the droplet, is discussed.
1 Introduction
Colloidal self-assembly is a well-explored area with significant implications for understanding fundamental material physics and diverse technological applications. Of particular interest is the self-assembly of colloids in two dimensions, which provides a myriad of opportunities to understand the role of inter-particle interactions and other physicochemical properties in phase transitions in real time. Typically, the formation of self-assembled colloidal monolayers can be realized by (i) transferring particles trapped at a fluid–fluid interface onto a solid substrate, (ii) dip coating or spin-coating dilute particle dispersions, or (iii) evaporation-driven direct deposition of particles onto the substrate. While studying the interfacial self-assembly patterns of particles is crucial for enhancing Pickering emulsion stabilization, which finds extensive applications in industries such as food1,2 and pharmaceuticals,3 investigating the evaporative patterns of colloids holds relevance for inkjet printing,4 fabrication of photonic crystals,5,6 development of miniature electronic devices,7,8 lithography,9,10 and more. When a colloidal dispersion droplet evaporates on a substrate, the particles accumulate along the three-phase contact line of the droplets, resulting in a distinctive peripheral deposit pattern known as “coffee rings” or “coffee stains”. Deegan et al.11 for the first time identified that the capillary flow of particles induced by non-uniform evaporative flux along the interface, combined with the pinning of the three-phase contact line of the evaporating drop, is responsible for the formation of such ring-like deposits. In a nutshell, the factors influencing the spatial distribution of particles in dried deposits include: the flows inside the drop such as outward capillary flow and inward Marangoni flow,12,13 colloidal interactions,14 particle size,15,16 particle shape,17 surface chemistry of the particles, substrate wettability,18,19 orientation of the substrate,20,21 drying conditions such as humidity and temperature,19,22–24 inclusion of other materials such as surfactants,13,25 and volatility of the solvent.26Most studies on evaporative self-assembly focus on three primary configurations for drying, i.e., sessile mode, pendant mode, or drying on an inclined surface. These drying modes assume that the rate of evaporation at any given point remains unaffected by evaporation elsewhere along the interface of the drop.21,24,27 It is well established that the evaporative flux is a dominant factor in determining deposit patterns; therefore, manipulating it can yield intriguing deposit patterns. On the other hand, spatial confinement is known to play a significant role in governing the structure and dynamics of colloids.28,29 In this regard, positioning a droplet between two solid surfaces provides both spatial confinement and the chance to modify the curvature or shape of the interface, consequently altering the evaporative flux, which can potentially lead to novel deposit patterns. In an early investigation of droplet evaporation within a confined geometry, Lin and Granick documented the formation of gradient concentric ring patterns by drying a polymeric solution in a sphere-on-a-plate geometry.30 Similarly, Xu et al. observed these gradient concentric ring patterns in a sphere-on-a-plate geometry and provided a detailed theoretical explanation for their formation.31 The formation of concentric rings and concentric crack patterns by drying dispersion droplets containing elliptical particles in a sphere-on-a-plate geometry is also reported by Mondal and Basavaraj.32 Studying particle dynamics during evaporation poses a significant challenge in a sphere-on-a-plate geometry compared to a sessile drop drying mode. However, investigating particle dynamics becomes considerably easier in drying induced by parallel plate confinement.33 The kinetics of evaporation of simple liquids with or without salt dried in parallel plate confinement has been the subject of considerable research.34–37 There are studies investigating the buckling process of colloidal dispersion drops dried in such a configuration.33,38 In contrast, there are few studies on the deposit patterns formed by drying colloidal dispersion droplets confined between two parallel plates.39–41 Mondal and Basavaraj41 reported the formation of spiral deposits irrespective of the shape of the colloids. They studied the effect of confinement spacing, particle concentration, and droplet volume on the deposit pattern. According to them, the continuous stick-slip motion of the contact line leads to the generation of symmetric spiral deposits. Upadhyay and Bhardwaj40 have demonstrated how the deposit patterns depend on the wettability of both the top and bottom substrates and the particle size using experiments and a theoretical model. The wettability of the substrates is shown to change the overall evaporative flux across the interface, which leads to different deposit patterns when substrates have varying wettability. The symmetry of the deposit patterns, when both the top and bottom substrates have identical surface chemistry, is shown to depend on particle size. Chattopadhyay et al.39 reported the formation of scallop shell-like deposit patterns by tuning the spacing between the substrates.
The dispersions of non-deformable colloids have been extensively used to understand the fundamental aspects of the evaporation of particle-laden drops and the resulting self-assembly patterns. However, only a handful of studies exist on the evaporative self-assembly of poly(N-isopropylacrylamide) particles (PNIPAM), which belongs to a class of soft colloids.42–46 Horigome and Suzuki42 reported the effect of particle concentration on the mechanism of drying of PNIPAM-laden aqueous droplets. Mayarani et al.43 showed that tuning the particle concentration in an evaporating aqueous droplet makes obtaining a uniform monolayer of PNIPAM microgels possible. This work identified a critical concentration at which the PNIPAM particles form a monolayer that spans the entire base area of the deposit, known as the critical monolayer concentration (CML). Takizawa et al.47 studied the transport mechanism of PNIPAM microgels to the air/water interface during droplet evaporation, where they identified the Marangoni flow as the main driving force for their adsorption onto the interface. Minato et al.45 reported the effect of charge groups immobilized in PNIPAM microgels on their adsorption to the air/water interface, where they found out that a larger number of immobilized charges decreases the adsorption probability. Moreover, their arrangement is shown to be disrupted when the particle-laden interface gets transferred onto the substrate. Later, Mayarani et al.48 reported the formation of cell-like tessellations in the PNIPAM monolayer deposits under higher relative humidity conditions. Jose et al.27 examined the effect of the softness of microgels on evaporative self-assembly patterns. They elucidated that at 0.5 CML, the drops with highly crosslinked microgels resulted in coffee-ring deposits, while those with less-crosslinked microgels formed uniform monolayer deposits. They identified the higher rate of deformability of the less-crosslinked microgels adsorbed at the air/water interface as the cause of the formation of uniform monolayer deposits at 0.5 CML.
Although the self-assembly of microgels is widely studied, research on drying microgel particle dispersions in a confined geometry is scarce. This study aims to investigate how parallel plate confinement affects the spatial arrangement of particles in the final dried deposits of PNIPAM microgels compared to drying in sessile mode. To achieve this goal, we conducted two sets of experiments. In the first set, we varied the distance between the parallel glass plates while keeping the particle concentration constant. In the second set of experiments, we altered the particle concentration at a constant spacing. The particle concentrations and spacing considered are carefully selected so that only monolayer deposits form upon complete evaporation of the solvent. Consequently, we thoroughly examined the impact of two parameters, particle concentration and spacing between two parallel plates, on the microstructures of the particulate deposits. In contrast to the azimuthal symmetry of the deposits formed in sessile mode, the dried patterns formed on both top and bottom plates in confined drying exhibit reflection symmetry. Our results show that via parallel plate drying, the fractional area of the deposit over which the particles are arranged in an ordered or disordered manner can be tuned by varying the concentration of particles in the dispersion and the confinement spacing.
2 Experimental section
2.1 Materials
To synthesize PNIPAM, we utilized N-isopropylacrylamide (NIPAM), N,N′-methylenebisacrylamide (BIS), and potassium peroxodisulfate (KPS) as the monomer, cross-linker, and initiator, respectively. These chemicals, sourced from Sigma-Aldrich, were used as received without any additional purification steps. Water, double deionized using a Milli-Q system (with a resistivity of 18.2 MΩ cm at 25 °C), was used for the synthesis, purification of the resulting dispersion, and preparation of diluted dispersions for all experiments.2.2 Synthesis and characterization of PNIPAM microgels
PNIPAM microgel particles were synthesized via a free radical polymerization method. Initially, NIPAM (0.25 g) and BIS (0.09 g) were dissolved in 20 mL of deionized water in a three-neck round-bottom flask, purged with nitrogen gas, and then heated to 70 °C in an oil bath under continuous stirring. After approximately 1 hour, KPS (0.02 g) dissolved in 1 mL of deionized water was rapidly added to the solution. Within about 5 minutes, the solution became turbid, indicating the initiation of the polymerization reaction, which was allowed to proceed for an additional 6 hours under the same reaction conditions (70 °C). Subsequently, the temperature of the reaction mixture was reduced to 25 °C and maintained overnight (about 12 hours). The synthesized microgels underwent purification through several centrifugation, decantation, and redispersion steps. Following this purification process, a concentrated aqueous dispersion of PNIPAM particles was obtained. This concentrated dispersion was then further diluted to prepare aqueous dispersions of suitable concentrations for the drying experiments. Particle size analysis was performed using the dynamic light scattering (DLS) technique on a Zetasizer Nano S90 Malvern instrument equipped with a He–Ne laser at a detection angle of 90°. The average hydrodynamic diameter of the PNIPAM microgels at 25 °C was measured to be 745 nm, with a polydispersity index (PDI) of 0.3, determined using the cumulant analysis method.2.3 Evaporation of aqueous PNIPAM microgel dispersions in different configurations
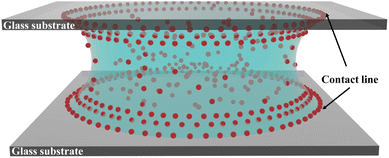
Commercially available microscope slides of dimensions 75 × 25 × 1 mm3 were cut into glass slides of 25 × 25 × 1 mm3 dimensions for the confinement experiments. These glass slides were cleaned with soap solution, thoroughly rinsed with DI water, and finally dried with nitrogen gas before conducting the drying experiments. The equilibrium contact angle of the sessile drop of an aqueous dispersion of PNIPAM microgels on the cleaned glass slides was measured to be 25 ± 5°. One or multiple scotch tapes of 2 mm width, 25 mm length and varying thickness, which served as spacers, were first attached at the two edges of a clean glass slide. Then a drop of aqueous dispersion of PNIPAM microgels of 0.7 ± 0.1 μL volume was placed at the center of the bottom glass slide using a micropipette. Following this, a glass slide was carefully placed on the spacers to confine the dispersion between two parallel glass plates. This results in the formation of a catenoid-shaped liquid bridge, as shown in Fig. 1. Spacers of different thicknesses and aqueous dispersions with varying concentrations of microgel particles were used in this study. For a comparative understanding of the confinement effect, we also considered drying in the classical sessile drop configuration, that is, the evaporation of an aqueous PNIPAM microgel dispersion drop of 0.7 ± 0.1 μL volume placed on top of a clean glass slide without any confinement. All the drying experiments were performed in a controlled environment, where the temperature and the relative humidity were maintained at 25 ± 1 °C and 40 ± 5%, respectively.2.4 Evaporation kinetics
We monitored the temporal evolution of the projected area of the droplet confined between two parallel glass plates during drying with an upright bright-field microscope (Magnus MLXi Plus) using a 4× objective lens. From the frames of the microscopy video, the area of the drop in contact with the bottom plate was measured using ImageJ software. The temporal evolution of the drop configuration was tracked using a drop shape analyzer (DSA-256E goniometer, Kruss GmbH, Germany).2.5 Imaging of the particulate deposits
After complete evaporation of the solvent, the particulate deposits formed on the top and bottom plates were imaged using an upright dark-field microscope (Nikon Eclipse LV100ND) in reflection mode. The MosaicJ plugin of ImageJ was used to stitch the images of the deposits recorded at 5× magnification.2.6 Analysis of the microstructure of the deposit
We used an in-house developed MATLAB code to get the coordinates of the centroids of the particles in the regions of interest at different locations on the deposit, which are of 10 μm × 10 μm area, followed by the construction of Voronoi polygons around these centroids. The number density (ND) is determined as the number of particles per unit area in the regions of interest. The inter-particle separation (IPS) is also determined using an in-house developed MATLAB code. The areal disorder parameter (AD) and the bond orientational order parameter (Ψ6) are used to quantify the local arrangement of the particles in the deposits, which are determined by analyzing the overlaid Voronoi polygons on the centroids of particles. The areal disorder parameter is given bywhere σav is the standard deviation in the area and Aav is the average area corresponding to all Voronoi polygons drawn over a particular area of observation considered for analysis. The areal disorder parameter ranges between 0 and 1; for a perfectly ordered arrangement, all the Voronoi polygons have the same area, which gives AD = 0. The bond orientational order parameter Ψ6, which ranges between 0 and 1, is given by
where Nb is the number of nearest neighbors of the particle under consideration and θj is the bond angle, which is the angle between the vector connecting the particle of interest with its jth nearest neighbor and the reference axis. For a perfect hexagonally ordered pattern, Ψ6 = 1, which decreases with an increase in defect sites.
3 Results and discussion
3.1 Microstructure of the deposits formed by sessile drop drying
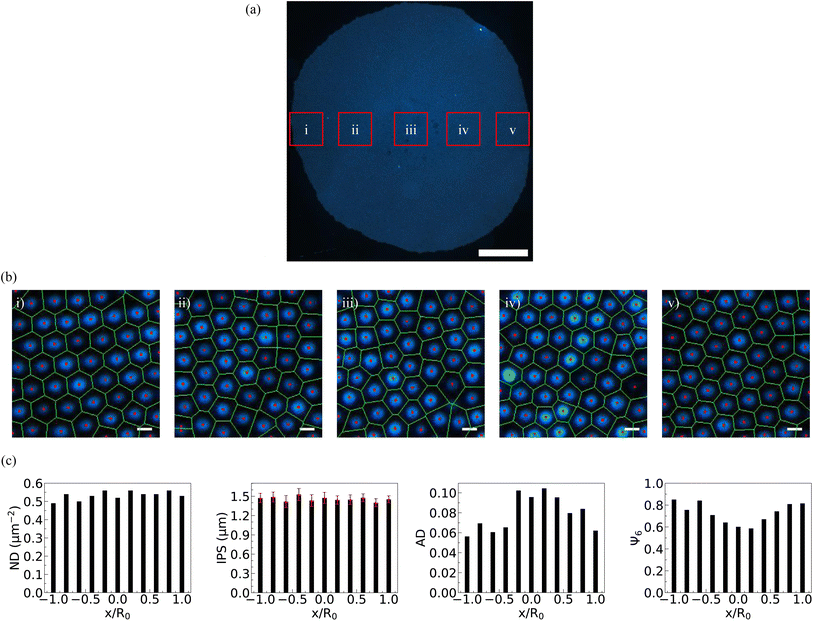
When an aqueous sessile drop containing PNIPAM microgels evaporates on a solid substrate at a specific concentration, termed the critical monolayer concentration (CML), a monolayer deposit of particles is obtained covering the whole deposit area, which is shown in Fig. 2(a). In our experiments, CML is determined to be 0.021 ± 0.001 wt%. Consistent with previous findings, at this concentration, coffee-ring formation is completely suppressed. This means that the particles occupy the entire base area of the drop uniformly, although with some variations in their spatial organization. The dark-field microscopy images of the particle arrangement recorded in different regions along the diameter of the dried particulate deposit, marked in Fig. 2(a), are presented in Fig. 2(b)(i)–(v). In Fig. 2(b), (i) and (v) micrographs correspond to the diametrically opposite sides of the periphery region of the deposit, while (ii) and (iv) correspond to the interior region of the deposit, and (iii) corresponds to the central region of the deposit. From micrographs (i) and (v), it is evident that the particles are hexatically ordered at the periphery, while it can be seen in micrographs (ii)–(iv) that the ordering of the particle arrangement reduces towards the central region. This observation aligns well with previous experimental reports.27As the solvent evaporates, microgels migrate towards the three-phase contact line propelled by capillary flow, where they irreversibly adsorb to the interface upon contact. At CML, the microgel particle count is just sufficient to cover the entire air/water interface of the droplet, culminating in the formation of a uniform monolayer on the substrate. Initially, during solvent evaporation, these microgel particles self-organize into a loosely packed hexagonally ordered pattern at the air/water interface. However, as the drying progresses and the drop height approaches the size of the microgel particle, immersion capillary forces come into play. This phenomenon leads to the restructuring of particle arrangements, transitioning from a hexagonally ordered pattern to a disordered one, particularly notable in the central region in the final stages of drying.
To quantify the particle distribution within the deposit, we analyzed the number density (ND) and inter-particle separation (IPS) from one side to the diametrically opposite side of the deposit, passing through its center. Simultaneously, we evaluated the areal disorder (AD) and the bond orientational order parameter (Ψ6) to characterize the particle arrangement within the deposit, as illustrated in Fig. 2(c). As can be inferred from Fig. 2(c), the number density and inter-particle distance remain relatively constant across the deposit, indicating complete suppression of the coffee ring at CML. While AD increases towards the central region of the deposit, Ψ6 decreases from the periphery towards the center. These order parameter profiles clearly indicate a centro-symmetric particle arrangement within the deposit formed in the sessile drying mode. We have designated this critical concentration CML as the reference concentration for the subsequent experiments conducted using a confined geometry.
3.2 Deposit patterns from drying in parallel plate confinement
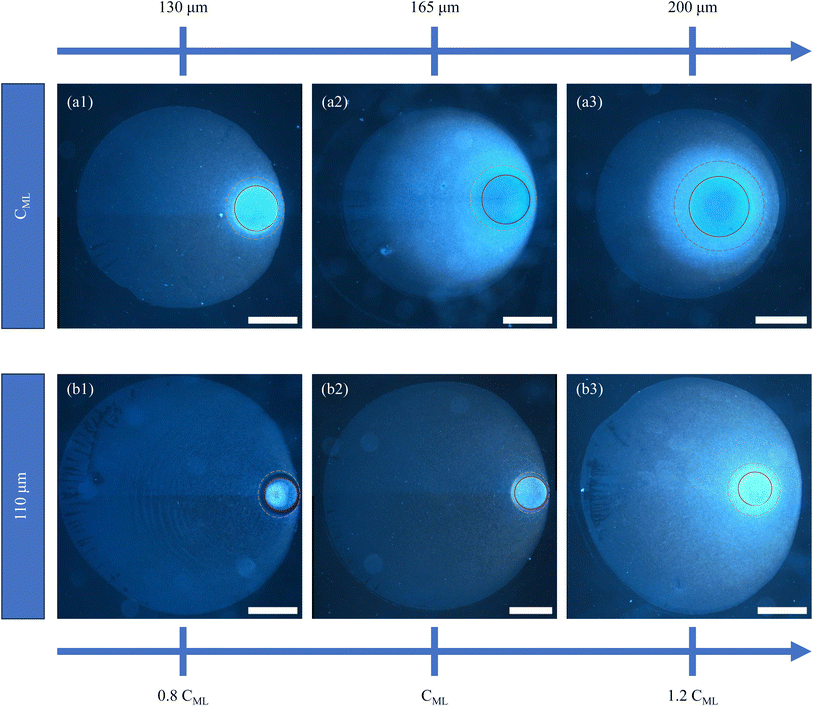
Two sets of experiments were conducted to investigate the influence of parallel plate confinement on the evaporation-induced deposition of microgel particles. In the first set, dispersions at a constant particle concentration CML were examined under three distinct spacings, 130 μm, 165 μm, and 200 μm. Subsequently, the second set of experiments involved varying the particle concentration from 0.8 CML to 1.2 CML, while maintaining a fixed parallel plate separation of 110 μm. The use of hydrophilic glass substrates for confinement resulted in the formation of drop shapes resembling catenoids. Notably, the similarity in wettability between the top and bottom glass substrates led to nearly identical deposits on both surfaces (refer to Fig. S1 and S2†). The images of the patterns on the bottom glass substrate are shown in Fig. 3, a detailed analysis of which will be presented later. The darkfield microscopy images in the upper panel (a1), (a2), and (a3) of Fig. 3 depict the final deposits formed under three different spacings 130 μm, 165 μm, and 200 μm, respectively where the initial concentration of particles is CML. The dark field microscopy images in the bottom panel (b1), (b2), and (b3) correspond to the final deposits formed in the case of three different concentrations 0.8 CML, CML, and 1.2 CML, respectively, for a fixed parallel plate spacing of 110 μm. The final deposit is a single particle thick monolayer containing a brighter disk-like region in the interior of the deposit, which is in stark contrast to the deposit patterns obtained from drying dispersions of hard colloids confining between two parallel plates.39,41 In all the images, the brightest disk-like regions of the deposits are delineated by red circles. We have highlighted another area of interest with dashed golden circles, presenting distinct characteristics compared to the rest of the deposits. It is evident from the images in Fig. 3 that the diameter of the disk-like region of the deposits increases with increasing spacings between the parallel plates, while there is no effect on the dimensions of the same for varying particle concentration, even though the core looks brighter in the case of higher particle concentration. The diameter of the disk-like region of the deposits in the cases of 130 μm, 165 μm, and 200 μm is found to be 332 ± 12 μm, 492 ± 13 μm, and 570 ± 18 μm, respectively. While the core region is the brightest spot in the deposit in every case, the region highlighted with golden-colored dashed circular lines in all of the deposits shown in Fig. 3 seems to depend on both the thickness of the spacers and the particle concentration. The diameter of this annular region around the core increases with increasing spacing between the plates, as shown in Fig. 3(a1)–(a3). However, this annular region seems to be depleted of particles when the particle concentration of the drying droplet is 0.8 CML, and the spacing between the plates is 110 μm, which is shown in Fig. 3(b1). The mechanism that leads to the formation of such a brighter disk-like region and the kinetics of evaporation are further probed by in situ microscopy and quantified by image analysis, which is discussed below.3.3 Drying kinetics of the microgel particle-laden liquid bridge
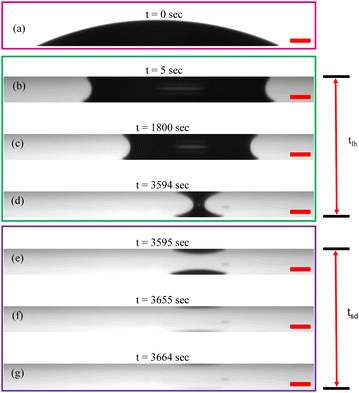
To comprehend the unique patterns formed when PNIPAM microgel-laden aqueous dispersions dry between two parallel glass plates, it is crucial to examine the evaporation kinetics from both side and top perspectives. Initially, we deposit a 0.7 ± 0.1 μL aqueous droplet containing PNIPAM microgels at concentration CML onto a clean glass substrate, forming a spherical cap shape (Fig. 4(a)). Immediately, another glass substrate is brought in from the top and placed at a height h = 200 μm with the help of the spacers placed on the bottom plate. As soon as the top plate touches the drop, a liquid bridge forms between the two parallel plates, eventually forming a catenoid, as shown in Fig. 4(b).Although the volume of the dispersion remains nearly constant in both Fig. 4(a) and (b), the drop adopts a catenoid shape in the latter to minimize free energy, influenced by the wettability of the substrate and the spacing between them. Under the experimental conditions considered here, once the liquid bridge forms, the contact area of the drop on the bottom plate decreases compared to the sessile configuration, as illustrated in Fig. 4(a) and (b). Given the similar wettability of the substrates, the area of the aqueous dispersion in contact with both plates is expected to be identical, as observed in the side-view images presented in Fig. 4.
We note that the complete evaporation of water from a 0.7 μL pNIPAM dispersion placed between parallel plates maintained at a separation of 200 μm takes approximately 60 ± 8 minutes, which is significantly longer than the 8 ± 2 minutes required for drying in a sessile configuration under the same ambient conditions. The liquid bridge configuration persists almost until the end of evaporation, accounting for approximately 98% to 99% of the total evaporation time, as depicted in Fig. 4(b)–(d), with the time scale of persistence of the liquid bridge marked as tlb. Subsequently, the meniscus profile of the drop begins to change noticeably, indicating a thinning of the liquid bridge, as shown in Fig. 4(d), ultimately collapsing into two tiny drops, as depicted in Fig. 4(e) (see the ESI† video). The water from these tiny drops evaporates in about 70 seconds, as illustrated in Fig. 4(e)–(g), resulting in the formation of a bright circular disc region in the deposit patterns shown in Fig. 3. This time scale of complete evaporation of the daughter drops in the final stage of drying is designated as tsd. Therefore, the total evaporation time of the drop, tf, confined between parallel plates, is the sum of the time it spends drying in the liquid bridge configuration and the subsequent sessile or pendant configuration, expressed as tf = tlb + tsd.
To gain further insight into the drying kinetics, the top view of the microgel dispersion between the two parallel plates at 200 μm spacing is also recorded using bright-field optical microscopy. A correlation between the side view and top view of the dispersion drying in this configuration at a particular time instance is depicted in Fig. 5. In the transmission mode, when viewed from the top, the light traversing through the inner region of the catenoid and that near the contact line encounters different sequences of media with varying refractive indices. Consequently, the central region appears transparent to light, while the vicinity near the three-phase contact line manifests as a black ring with a thickness denoted as t in the top-view image (Fig. 5(b)). This ring in the top-view image corresponds to the projected area between the contact line and the neck of the catenoid, as depicted by the curved blue arrow in Fig. 5. Furthermore, the inner and outer radii of the ring, r and R, in both the side and top view images are marked, representing the neck radius and the contact radius of the catenoid, respectively. Additionally, the height of the liquid bridge in Fig. 5(a) is labeled as h.
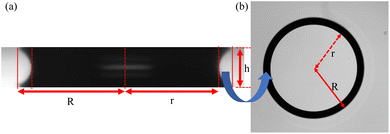 | ||
| Fig. 5 Detailed description of the catenoid-shaped dispersion drop squeezed between two hydrophilic plates. (a) Side view of the liquid bridge and (b) top view of the liquid bridge. | ||
The temporal evolution of the drying liquid bridge is visualized through a series of time-lapse images presented in Fig. 6. It is important to note that the time scale in these images is normalized by tlb. These images are then analyzed to understand how the projected view of the catenoid changes as water evaporates from the confined dispersion, providing insights into the evaporation kinetics. Using image analysis, we identify the location of the ring during the drying process, which is overlaid and plotted in Fig. 7(a)–(c) for the drying of an aqueous droplet with a volume of 0.7 μL containing PNIPAM microgels at concentration CML, under three different parallel plate spacings: 130 μm, 165 μm, and 200 μm, respectively. We draw attention to the overlapping rings in the region marked by an arrow in Fig. 7. This overlap indicates the pinning of the three-phase contact line, suggesting that the contact line remains fixed at this location. However, at other locations, the contact line continuously slips while the catenoid shape of the drying drop persists (see the ESI† video). Consequently, due to continuous depinning, the center of the ring, which coincides with the axis of the catenoid, shifts towards the pinned side during drying. Moreover, it is evident from Fig. 7 that the thickness of the projected ring increases with an increase in spacing between the parallel plates, indicating that for a constant volume of the dispersion, the catenoid is stretched, leading to a narrower neck. Furthermore, the thickness of the ring during drying remains almost constant for all the parallel plate configurations considered in this study, except in the penultimate stage of drying (t = 0.99tlb), where the ring becomes thicker. To quantify these observations, various parameters characterizing the dispersions drying in parallel plate confinement are plotted in Fig. 8.
 | ||
| Fig. 7 Temporal evolution of the drying front of the liquid bridge for three different spacings of 130 μm, 165 μm, and 200 μm in (a), (b), and (c), respectively. | ||
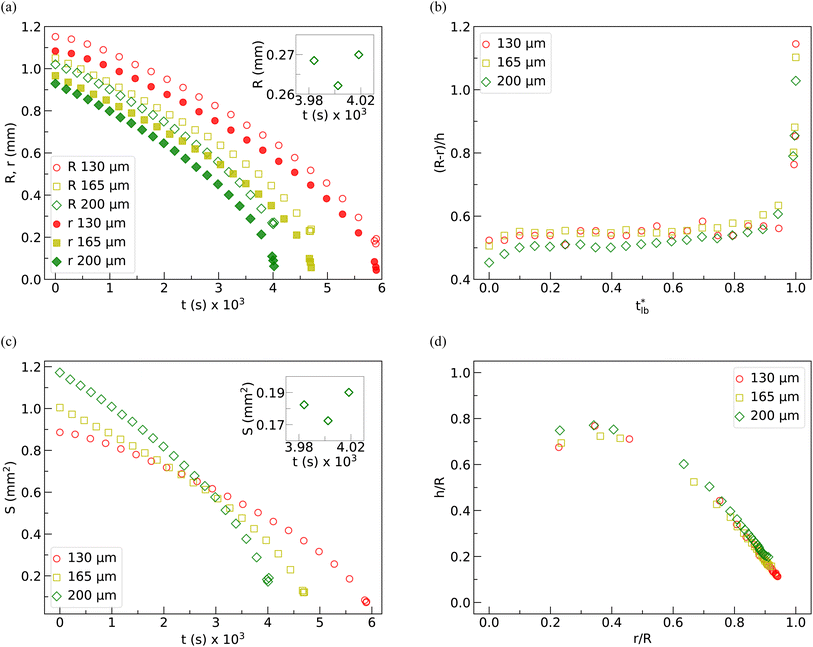
Fig. 8(a) shows the variation of the contact radius (R), formed due to the contact of the catenoid with the top surface, and the neck radius (r) as a function of time (t) during evaporation (up to tlb) for 130 μm, 165 μm, and 200 μm spacings between the parallel plates. It is evident that the decrease in R and r is gradual for most of the observation window. However, there is a more drastic reduction in r close to the time corresponding to the break-up of the catenoid into two daughter drops. From the data in Fig. 8(a), we observe that though R decreases for most of the drying period, just before the collapse of the LB, R increases again while r continues to decrease. This non-monotonic trend of R can be clearly observed in the inset of Fig. 8(a). To understand how the shape of the LB changes with time, (R − r)/h vs. t*lb (where t*lb = t/tlb) is plotted in Fig. 8(b). (R − r)/h is found to be almost constant up to t*lb ≈ 0.98, and after that, it increases steeply, indicating that the thick neck catenoid turns into a thin neck catenoid, which is not energetically favorable, leading to the collapse of the liquid bridge. Fig. 8(c) shows the temporal evolution of the instantaneous interfacial area S = πa2[(h/a) + sinh(h/a)]. From this graph, it is evident that for the dispersion of a given volume, the initial interfacial area increases with the increase in spacing between the parallel plates. In the parallel plate configuration, the vapor diffusion occurs mainly in the radial direction. Since the surface of the catenoid near the contact line is closer to the ambient, the rate of evaporation in this region is higher. In contrast, water evaporation from the neck region is comparatively slower, as the water vapor concentration in this region is higher due to the accumulated vapor evaporating from the region closer to the contact line. The rate of reduction of the interfacial area increases with the height of the liquid bridge. The interfacial area is observed to increase marginally just before the collapse of the liquid bridge (see the inset in Fig. 8(c)). As the liquid drops tend to attain a lower surface area to minimize the total surface energy, an increase in the surface area in the last stage indicates the occurrence of instability in the system, which causes the break-up of the liquid bridge. In Fig. 8(d), the two dimensionless quantities, h/R vs. r/R, have been plotted. Note that at the start of drying, r/R is highest and h/R is lowest. During drying, r/R decreases, while the magnitude of h/R increases. However, in the penultimate stage of drying, h/R decreases. Interestingly, the value of r/R is nearly the same when the liquid bridge collapses in all of the cases. From this quantitative analysis, we may conclude that in the penultimate stage of drying, the drop configuration deviates from the minimum energy configuration, which results in the break-up of the liquid bridge into two daughter droplets.
3.4 Microstructure of the deposits formed via confined drying
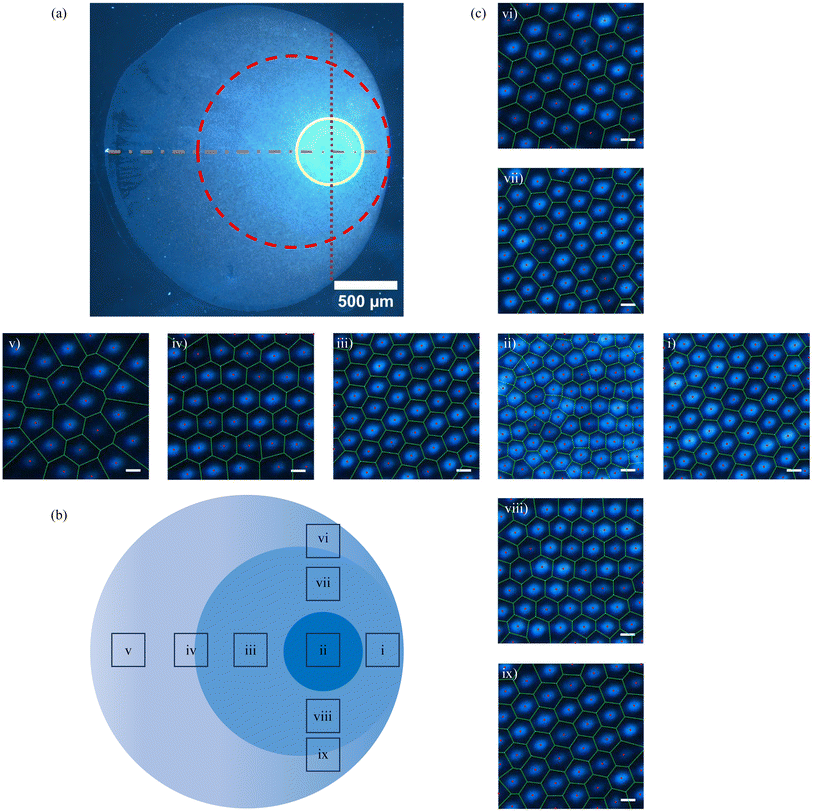
In this section, we delve into both qualitative and quantitative analyses of the microstructure of the dried patterns. As evident from Fig. 3, the final deposits resulting from drying in parallel plate confinement exhibit a lack of centrosymmetry, featuring nested circular regions, as more clearly marked in Fig. 9(a) and (b). Hence, we opt to conduct microstructure analysis along two thin strips orthogonal to each other, with lines passing through their centers demarcated by dot-dashed and dotted lines in Fig. 9(a). This deposit originated from drying microgel suspensions at a concentration of 1.2 CML, constrained between parallel plates spaced 110 μm apart. To highlight the microstructural differences, we studied the arrangement of particles within square regions of 10 μm × 10 μm dimensions at various locations on the orthogonal strips delineated in Fig. 9(b). It is noteworthy that the line traversing the center of the horizontal strip intersects both the center of the deposit pattern and the center of the bright circular disc, as indicated by the solid circle in Fig. 9(a). The dark field microscopy images labeled (i)–(v) and (vi)–(ix) in Fig. 9(c) showcase the arrangement of microgel particles in these square regions at different locations on the horizontal strip and vertical strip, respectively.In Fig. 9(c)(ii), the optical micrograph reveals that microgel particles within the inner bright circular region exhibit a random arrangement, a characteristic observed consistently across the entire bright area. Notably, this region demonstrates the highest particle number density. The deposition of particles in this area occurs in the penultimate stage of drying, following the breakup of the catenoid into two daughter drops. Consequently, the available time scale for particle rearrangement is relatively small, resulting in a disordered state. Adjacent to the bright circular region, specifically in the space between the dashed and solid circles delineated in Fig. 9(a), microgel particles exhibit hexatic ordering with a loosely packed arrangement. This ordering is evident in the microscopy images in Fig. 9(c)(i), (iii), (vii) and (viii), corresponding to small square regions along both the horizontal and vertical strips. As water continues to evaporate, the particle concentration in the drying dispersion increases over time compared to the initial dispersion. Coupled with repulsive inter-particle interactions, this increase in concentration facilitates hexatic ordering, wherein each PNIPAM particle is surrounded by six nearest neighbors.
Additionally, the relatively slow rate of evaporation further promotes the rearrangement of PNIPAM into a hexatically ordered state. These processes are observable in the ESI video.† In the regions marked by (iv), (vi), and (ix) in Fig. 9(b), the particle density is slightly lower, yet the concentration remains sufficiently high for hexatic ordering to persist. However, the inter-particle separation is larger compared to that observed in Fig. 9(c)(i), (iii), (vii) and (viii). In the regions of the deposits formed in the early stages of evaporation, indicated as (v) in Fig. 9(b), there is a loss of long-range order, evident in the microstructure shown in Fig. 9(c)(v). The particle number density in this region is the lowest, leading to an insufficient number of particles to establish the most energetically favorable hexagonal arrangement with six nearest neighbors. Consequently, the particle arrangement tends to resemble a liquid-like structure.
The qualitative analysis of the deposits reveals that the microstructural features of the particulate deposit along the horizontal strip are not symmetric with respect to the center of the deposit. However, it is symmetric with respect to the center of the inner bright circle along the vertical strip. This means that the deposits possess a reflection symmetry with respect to the horizontal dashed line, which hereafter will be referred to as the reflection axis. Further analysis of the particle arrangement in the deposit pattern involves quantifying the particle number density (ND), inter-particle separation (IPS), areal disorder (AD), and the bond orientational order parameter (Ψ6). These parameters are illustrated in Fig. 10(a)–(d). The data presented in these figures correspond to square regions measuring 10 μm by 10 μm located along the reflection axis, which passes through the center of the deposit as well as the center of the circular bright region, and the orthogonal axis, which traverses the center of the circular bright region.
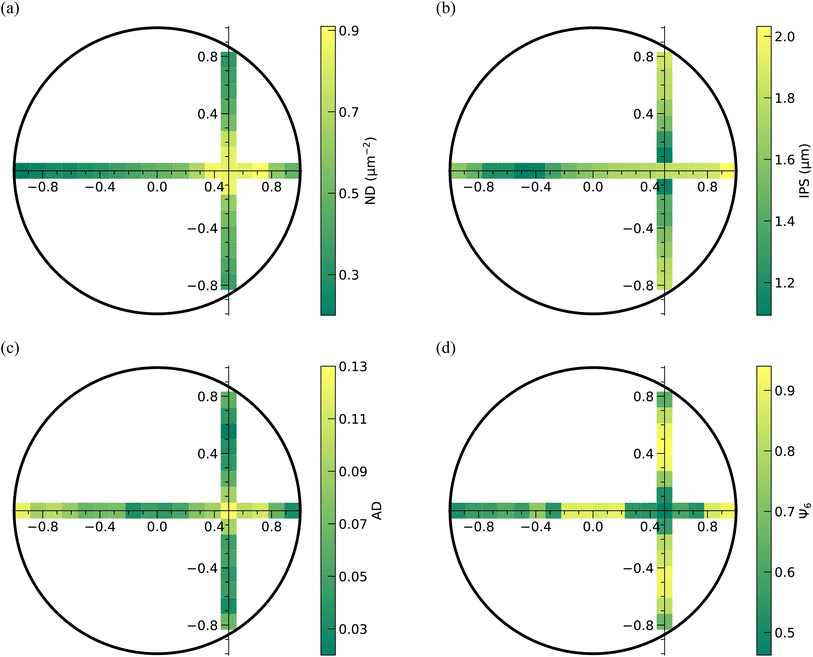 | ||
| Fig. 10 Qualitative analysis of the microstructure of the deposit formed on the bottom plate using 110 μm spacing between the plates and an initial concentration of 1.2 CML. The regions of interest correspond to the areas along the axis of reflection and the line perpendicular to the axis of reflection, as shown in Fig. 9(a). (a) Number density (ND), (b) inter-particle separation (IPS), (c) areal disorder (AD), and (d) bond orientational order parameter (Ψ6) determined on the areas along these two particular lines on the deposit. | ||
From Fig. 10(a), it can be inferred that the particle number density (ND) is highest near the intersection of the orthogonal strips and decreases monotonically as one moves away from this region. Since the inter-particle separation is inversely related to the particle number density, IPS is minimum in the intersection region and increases away from it, as shown in Fig. 10(b). Notably, both ND and IPS exhibit almost symmetrical variations along the two strips on either side of the intersection. While the contour plots in Fig. 10(a) and (b) show that ND and IPS decrease monotonically as one traverses away from the intersection region, both AD and Ψ6 vary in a non-monotonic fashion, as evident from Fig. 10(c) and (d). The parameters AD and Ψ6 determine the extent of ordering, with lower AD and higher Ψ6 implying a higher order in the particle arrangement. From Fig. 10(c) and (d), it can be seen that AD is maximum and Ψ6 is minimum in the region of intersection, which corroborates with the fact that the PNIPAM particles in this region are disordered, despite the ND of the particles in this region being highest. Along the vertical strip, AD decreases as we move from the intersection region towards the periphery on either side of the reflection axis; however, at the periphery, AD increases marginally. Due to the lower number density of the particles at the edge of the deposit, a small degree of disorderedness arises in the particle arrangement. Similarly, the magnitude of Ψ6 increases with an increase in the distance from the intersection region, but at the periphery on either side, the Ψ6 is lower. Along the reflection axis, the AD decreases towards the side of the periphery closer to the center of the bright circular region, that is, towards the right side of the intersection region in the current case. However, on the opposite side, AD decreases to a region close to the center of the deposit before going up again. Likewise, the magnitude of Ψ6 increases towards the periphery on the right side, but on the opposite side, it increases first up to a region close to the center of the deposit, followed by a decrease. From the analysis of experimental data, we can substantiate that the deposit consists of mainly three eccentric circular regions. The innermost circle corresponds to a region with a high particle number density, wherein the PNIPAM microgels are in a disordered arrangement. Surrounding this innermost circular area is a second region corresponding to highly ordered microgels. Lastly, the outermost region corresponds to microgels with a comparatively low particle number density and a relatively low degree of order. Even though this is true in most cases, we have observed that when the initial concentration of the dispersion is low (0.8 CML) for a smaller spacing between the plates like 110 μm, the innermost circular region is surrounded by a circular region whose most of the part is depleted of particles, a magnified image of which is shown in Fig. S3.†
3.5 Effect of spacing and PNIPAM concentration on the microstructure of the dried deposits
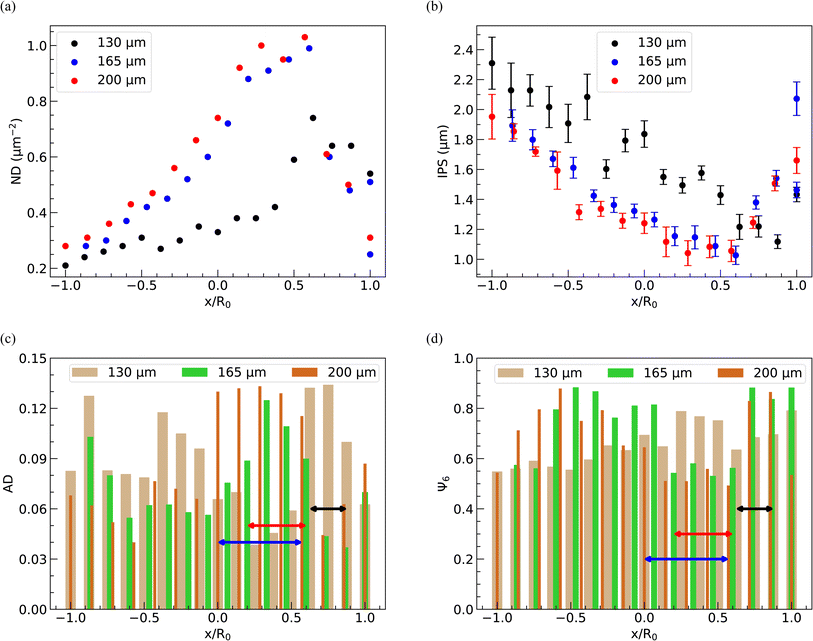
In Fig. 11(a)–(d) and 12(a)–(d), we display the spatial distribution of ND, IPS, AD, and Ψ6 along the horizontal strip crossing the center of the deposit and the inner bright circular area. These plots represent three different spacings and three distinct PNIPAM concentrations. The parameters ND, IPS, AD, and Ψ6 are calculated within square domains measuring 10 μm × 10 μm.The position of the square domain along the strip, denoted by the variable x, is normalized by R0, the radius of the dried deposit. The value x/R0 = 0 denotes the center of the deposit, while x/R0 = ±1 indicates the diametrically opposite edges. When a droplet is confined between two parallel plates, the contact diameter decreases as the spacing between the plates increases, resulting in a reduction in the area available for particle deposition. Consequently, on average, the ND is higher in deposits formed at 200 μm spacing, as depicted in Fig. 12(a). The variation of ND with x/R0, regardless of the spacing between the parallel plates, exhibits a non-monotonic behavior, reaching a maximum in the bright disc region within the deposits. As the inter-particle distance decreases with increasing ND, the average IPS between particles in the deposits is minimized in the bright disc region, irrespective of the spacing between the glass plates, as shown in Fig. 11(b).
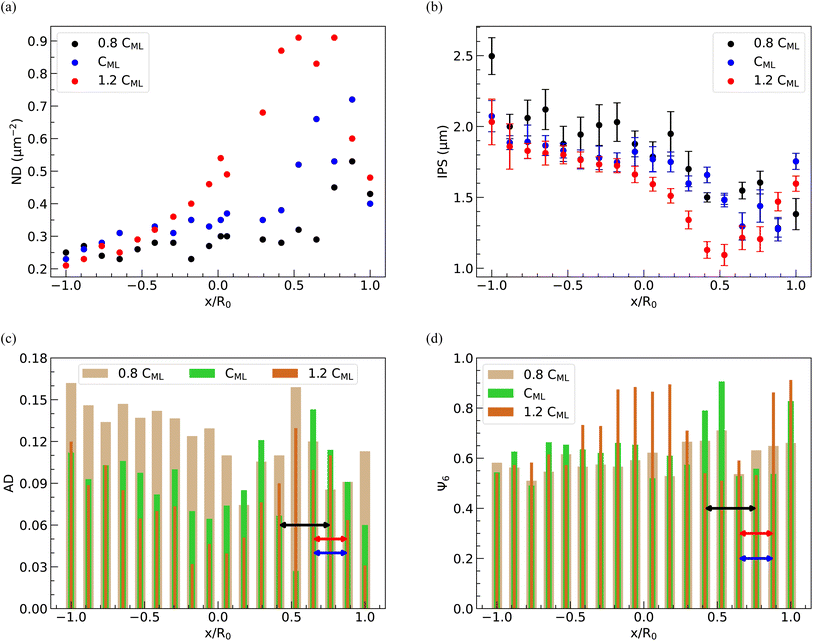
As shown in Fig. 12(a) and (b), a similar trend in the variation of ND and IPS is observed when the concentration of PNIPAM microgels in the dispersion is varied, keeping the spacing between the plates fixed at 110 μm. At 1.2 CML PNIPAM concentration, the average value of ND is higher due to higher particle loading, while the average IPS is larger at 0.8 CML PNIPAM concentration.
The spatial distribution of PNIPAM particles in the deposits is further analyzed by estimating AD and Ψ6. The locations of the bright disc regions in the dried deposits used to obtain the data presented in Fig. 11(c), (d) and 12(c) and (d) are shown by lines with a double-sided arrow. It can be seen that, in general, AD in the bright disc region is higher, which indicates that the microgel particles in this region are least ordered and correspondingly, Ψ6 is lower, despite the ND in this region being highest. A closer look at the data in Fig. 11(c) and (d) reveals that AD decreases (Ψ6 increases) on either side of the bright disc region; however, with further movement towards the periphery, AD increases (Ψ6 decreases) again as the ND in these regions is lowest. From Fig. 12(c) and (d), we note that AD is considerably higher and Ψ6 is markedly lower in the case of 0.8 CML PNIPAM concentration, as there are not enough PNIPAM particles in the drying dispersion to induce ordering. The data presented in Fig. 11 and 12 show that the extent of the hexatically ordered arrangement of the particles in the monolayer deposit can be tuned by varying the initial concentration of particles in the dispersion and the spacing between the parallel plates.
4 Conclusions
This article reports an investigation into deposit patterns resulting from the drying of aqueous dispersions containing PNIPAM microgels confined between two parallel plates. We examine the microstructures of these deposits to elucidate the influence of the spacing between parallel plates and the initial dispersion concentration on the final deposit pattern. Our findings reveal that the deposit patterns exhibit reflection symmetry along a single axis passing through the center of the deposit, regardless of the initial dispersion concentration or spacing between the plates. While drops in unrestricted drying geometries remain pinned at the entire three-phase contact line during drying, those drying between parallel plates maintain pinning on one side of the contact line while experiencing continuous slipping on the other side. This contrasts with the kinetics of evaporation observed in drops containing non-deformable colloids, where multiple stick-slip motions occur. We conduct an analysis of the evaporation kinetics to comprehend how the drying mechanism influences the deposit pattern. By employing a parallel-plate confinement drying technique and utilizing PNIPAM particles as building blocks, we demonstrate the potential to fabricate particulate monolayer films with distinctive microstructural characteristics not achievable through other self-assembly approaches.Data availability
The data supporting this article have been included as part of the ESI.†Author contributions
SM: carried out all the experiments and data analysis and wrote the first draft; MGB and DKS: scientific discussions, project supervision and funding. All authors provided critical feedback and contributed to the final version of the manuscript.Conflicts of interest
There are no conflicts to declare.Acknowledgements
We thank Dr M. Jose for the help during the initial phase of the microgel synthesis and discussions. The generous financial support from IIT Madras under the Institutes of Eminence (IoE) scheme funded by the Ministry of Education, Government of India, is acknowledged.Notes and references
- M. Kargar, K. Fayazmanesh, M. Alavi, F. Spyropoulos and I. T. Norton, J. Colloid Interface Sci., 2012, 366, 209–215 CrossRef CAS.
- C. C. Berton-Carabin and K. Schroën, Annu. Rev. Food Sci. Technol., 2015, 6, 263–297 CrossRef CAS PubMed.
- J. Frelichowska, M.-A. Bolzinger, J.-P. Valour, H. Mouaziz, J. Pelletier and Y. Chevalier, Int. J. Pharm., 2009, 368, 7–15 CrossRef CAS.
- B.-J. De Gans, P. C. Duineveld and U. S. Schubert, Adv. Mater., 2004, 16, 203–213 CrossRef CAS.
- H. Cong, B. Yu, J. Tang, Z. Li and X. Liu, Chem. Soc. Rev., 2013, 42, 7774–7800 RSC.
- Y. Xia, B. Gates, Y. Yin and Y. Lu, Adv. Mater., 2000, 12, 693–713 CrossRef CAS.
- T. Sreekumar, T. Liu, S. Kumar, L. M. Ericson, R. H. Hauge and R. E. Smalley, Chem. Mater., 2003, 15, 175–178 CrossRef CAS.
- H. Ko and V. V. Tsukruk, Nano Lett., 2006, 6, 1443–1448 CrossRef CAS.
- F. Burmeister, C. Schäfle, T. Matthes, M. Böhmisch, J. Boneberg and P. Leiderer, Langmuir, 1997, 13, 2983–2987 CrossRef CAS.
- K. Kolegov and L. Y. Barash, Adv. Colloid Interface Sci., 2020, 285, 102271 CrossRef CAS PubMed.
- R. D. Deegan, O. Bakajin, T. F. Dupont, G. Huber, S. R. Nagel and T. A. Witten, Nature, 1997, 389, 827–829 CrossRef CAS.
- H. Hu and R. G. Larson, J. Phys. Chem. B, 2006, 110, 7090–7094 CrossRef CAS.
- T. Still, P. J. Yunker and A. G. Yodh, Langmuir, 2012, 28, 4984–4988 CrossRef CAS.
- R. Bhardwaj, X. Fang, P. Somasundaran and D. Attinger, Langmuir, 2010, 26, 7833–7842 CrossRef CAS.
- L. K. Malla, R. Bhardwaj and A. Neild, Colloids Surf. A Physicochem. Eng. Asp., 2019, 567, 150–160 CrossRef CAS.
- C. H. Chon, S. Paik, J. B. Tipton and K. D. Kihm, Langmuir, 2007, 23, 2953–2960 CrossRef CAS.
- P. J. Yunker, T. Still, M. A. Lohr and A. Yodh, Nature, 2011, 476, 308–311 CrossRef CAS PubMed.
- F. Fan and K. J. Stebe, Langmuir, 2004, 20, 3062–3067 CrossRef CAS.
- N. D. Patil, P. G. Bange, R. Bhardwaj and A. Sharma, Langmuir, 2016, 32, 11958–11972 CrossRef CAS PubMed.
- F. Clément and J. Leng, Langmuir, 2004, 20, 6538–6541 CrossRef.
- M. Gopu, S. Rathod, U. Namangalam, R. K. Pujala, S. S. Kumar and D. Mampallil, Langmuir, 2020, 36, 8137–8143 CrossRef CAS.
- F. Du, L. Zhang and W. Shen, J. Colloid Interface Sci., 2022, 606, 758–767 CrossRef CAS.
- H. Lama, D. K. Satapathy and M. G. Basavaraj, Langmuir, 2020, 36, 4737–4744 CrossRef CAS.
- P. Katre, S. Balusamy, S. Banerjee and K. C. Sahu, Langmuir, 2022, 38, 4722–4735 CrossRef CAS.
- M. Anyfantakis, Z. Geng, M. Morel, S. Rudiuk and D. Baigl, Langmuir, 2015, 31, 4113–4120 CrossRef CAS PubMed.
- H. Kim, F. Boulogne, E. Um, I. Jacobi, E. Button and H. A. Stone, Phys. Rev. Lett., 2016, 116, 124501 CrossRef.
- M. Jose, M. G. Basavaraj and D. K. Satapathy, Soft Matter, 2021, 17, 7921–7931 RSC.
- C. R. Nugent, K. V. Edmond, H. N. Patel and E. R. Weeks, Phys. Rev. Lett., 2007, 99, 025702 CrossRef PubMed.
- D. K. Satapathy, O. Bunk, K. Jefimovs, K. Nygård, H. Guo, A. Diaz, E. Perret, F. Pfeiffer, C. David and G. Wegdam, et al. , Phys. Rev. Lett., 2008, 101, 136103 CrossRef CAS.
- Z. Lin and S. Granick, J. Am. Chem. Soc., 2005, 127, 2816–2817 CrossRef CAS.
- J. Xu, J. Xia, S. W. Hong, Z. Lin, F. Qiu and Y. Yang, Phys. Rev. Lett., 2006, 96, 066104 CrossRef.
- R. Mondal and M. G. Basavaraj, Phys. Chem. Chem. Phys., 2019, 21, 20045–20054 RSC.
- J. Leng, Phys. Rev. E, 2010, 82, 021405 CrossRef.
- X. He, J. Cheng, C. P. Collier, B. R. Srijanto and D. P. Briggs, J. Colloid Interface Sci., 2020, 576, 127–138 CrossRef CAS.
- L. Daubersies and J.-B. Salmon, Phys. Rev. E, 2011, 84, 031406 CrossRef CAS PubMed.
- N. Deka, S. Saha and S. Dash, Colloids Surf. A Physicochem. Eng. Asp., 2022, 639, 128256 CrossRef CAS.
- S. J. Lee, J. Hong and Y.-S. Choi, Langmuir, 2014, 30, 7710–7715 CrossRef CAS PubMed.
- F. Boulogne, F. Giorgiutti-Dauphiné and L. Pauchard, Soft Matter, 2013, 9, 750–757 RSC.
- A. Chattopadhyay, S. R. Sampathirao, O. Hegde and S. Basu, Langmuir, 2022, 38, 5590–5602 CrossRef CAS PubMed.
- G. Upadhyay and R. Bhardwaj, Langmuir, 2021, 37, 12071–12088 CrossRef CAS PubMed.
- R. Mondal and M. G. Basavaraj, Soft Matter, 2020, 16, 3753–3761 RSC.
- K. Horigome and D. Suzuki, Langmuir, 2012, 28, 12962–12970 CrossRef CAS PubMed.
- M. Mayarani, M. G. Basavaraj and D. K. Satapathy, Nanoscale, 2017, 9, 18798–18803 RSC.
- M. Jose, R. Singh and D. K. Satapathy, Soft Matter, 2023, 19, 1803–1812 RSC.
- H. Minato, M. Takizawa, S. Hiroshige and D. Suzuki, Langmuir, 2019, 35, 10412–10423 CrossRef CAS PubMed.
- M. Jose, R. Singh and D. K. Satapathy, J. Colloid Interface Sci., 2023, 642, 364–372 CrossRef CAS PubMed.
- M. Takizawa, Y. Sazuka, K. Horigome, Y. Sakurai, S. Matsui, H. Minato, T. Kureha and D. Suzuki, Langmuir, 2018, 34, 4515–4525 CrossRef CAS.
- M. Mayarani, M. G. Basavaraj and D. K. Satapathy, J. Colloid Interface Sci., 2021, 583, 683–691 CrossRef CAS.
Footnote |
| † Electronic supplementary information (ESI) available. See DOI: https://doi.org/10.1039/d4na00542b |
| This journal is © The Royal Society of Chemistry 2024 |

