Facile preparation of Hf3N4 thin films directly used as electrodes for lithium-ion storage†
Zhengguang
Shi
 ab,
Geng
Yu
ab,
Jing
Li
ab,
Zhenggang
Jia
c,
Xuexi
Zhang
c,
Cheng-Te
Lin
ab,
Geng
Yu
ab,
Jing
Li
ab,
Zhenggang
Jia
c,
Xuexi
Zhang
c,
Cheng-Te
Lin
 d,
Qianru
Lin
b,
Zhaoyu
Chen
 b and
Hsu-Sheng
Tsai
 *ab
*ab
aSchool of Physics, Harbin Institute of Technology, 150001, Harbin, China. E-mail: hstsai@hit.edu.cn
bLaboratory for Space Environment and Physical Sciences, Harbin Institute of Technology, 150001, Harbin, China
cSchool of Materials Science and Engineering, Harbin Institute of Technology, 150001, Harbin, China
dKey Laboratory of Marine Materials and Related Technologies, Zhejiang Key Laboratory of Marine Materials and Protective Technologies, Ningbo Institute of Materials Technology and Engineering (NIMTE), Chinese Academy of Sciences, 315201, Ningbo, China
First published on 30th August 2024
Abstract
Transition-metal nitride thin-film electrodes are potential electrode materials for all-solid-state thin-film lithium-ion batteries. In this study, orthorhombic Hf3N4 thin-film electrodes applied in lithium-ion batteries were fabricated by the magnetron sputtering deposition of Hf followed by N2 plasma immersion and post-annealing for the first time. This electrode material without additives such as binders and conductive agents exhibited a high specific capacity, high cycling stability, and excellent rate performance. At a current density of 0.1 A g−1, the initial discharge capacity was 583.2 mA h g−1 and the stable Coulombic efficiency was 96.6%. At a high current density of 2 A g−1, the Hf3N4 thin-film electrodes could still provide a stable discharge capacity of about 260 mA h g−1 and Coulombic efficiency close to 100%. By analyzing the cyclic voltammetry curves at different scan rates, it was found that the Li+ storage in Hf3N4 thin-film electrodes was mainly contributed by a pseudo-capacitance mechanism.
New conceptsOrthorhombic Hf3N4 thin films are first prepared by sputtering deposition followed by N2 plasma immersion and post-annealing under a relatively lower temperature and pressure. As the electrode of a lithium-ion battery, the Hf3N4 thin films exhibit a high specific capacity, high cycle stability, and excellent rate performance. The contribution of pseudo-capacitance is the main reason for the high specific capacity of the Hf3N4 thin-film electrodes. |
1 Introduction
The demand for thin-film lithium-ion batteries (TFLIBs) is become increasingly urgent with the development of microelectronics, such as wearable devices, microsensors, and small medical implants. Compared with conventional lithium-ion batteries (LIBs), TFLIBs possess a high energy density, long lifespan, negligible self-discharge rate, and flexible battery design, as well as the non-addition of binders and conductive agents. Although TFLIBs are heavier than traditional LIBs due to the weights of the substrate and packaging materials, they can provide excellent cycling stability and high safety. The materials used for fabricating TFLIBs are widely available and they can be prepared by various deposition and coating techniques. Due to their significant advantages and application potential, the electrodes of TFLIBs have been a research hotspot in the field of batteries since the 1980s. In the past few decades, the preparation of various thin-film electrode materials have been reported, among which transition-metal compounds have attracted considerable attention from researchers due to their unique physical and chemical properties, such as high conductivity, high hardness, electrochemical stability, wear resistance, and corrosion resistance.1,2The excellent properties of transition-metal compounds make them promising options to be used as electrode materials for LIBs, including oxides, carbides, dichalcogenides, and nitrides.3–6 However, there are still some drawbacks in these transition-metal compounds as the electrodes of LIBs. For example, while transition-metal oxide electrodes exhibit high capacity, their relatively poor conductivities limit their electrochemical performance.7 The highly conductive transition-metal nitride (TMN) electrodes can provide much higher specific capacities, compared with their carbide and oxide analogs. However, the large-scale preparation of TMNs is relatively difficult, which seriously hinders the exploitation of their thin-film electrodes.8,9 The preparation of TMN thin films, such as CoxNy, MnxNy, NixNy, TixNy, VxNy, MoxNy, FexNy, and HfxNy, is simplified as thin-film growth techniques, including physical and chemical vapor depositions, have been developed.8,10–18 The research into TMNs has greatly promoted the development of TMN thin-film electrodes for application in TFLIBs. Among the TMNs, Hf-based nitrides possess good conductivity, and excellent mechanical properties, as well as high temperature and corrosion resistance.18–21 As early as 2015, HfNx (x = 1.039 and 1.334) thin films with different stoichiometric ratios were prepared by Gu et al. using magnetron sputtering deposition.22 According to the results of the first-principle calculations and a series of experiments, it was confirmed that the nitrogen-rich phase in HfNx thin films has a cubic Th3P4 structure with the space group I![[4 with combining macron]](https://www.rsc.org/images/entities/char_0034_0304.gif) 3d. Gao et al. pointed out in their report that HfN thin films with high conductivity could be grown by physical vapor deposition and the as-deposited films etched by Ar/Kr plasma, which improved their specific capacitance for their application as the electrodes of supercapacitors.23 In 2016, Tao et al. systematically studied all the stable phases and their crystal structures in a Hf–N binary system based on an evolutionary algorithm and first-principle calculations in order to discover new materials with superior properties, obtaining the convex hull diagram shown in Fig. 1.24 The compounds at the convex hull in Fig. 1 are the steady-state phases, while the others closest to the convex hull are the metastable phases. The steady-state phases include Hf6N (R
3d. Gao et al. pointed out in their report that HfN thin films with high conductivity could be grown by physical vapor deposition and the as-deposited films etched by Ar/Kr plasma, which improved their specific capacitance for their application as the electrodes of supercapacitors.23 In 2016, Tao et al. systematically studied all the stable phases and their crystal structures in a Hf–N binary system based on an evolutionary algorithm and first-principle calculations in order to discover new materials with superior properties, obtaining the convex hull diagram shown in Fig. 1.24 The compounds at the convex hull in Fig. 1 are the steady-state phases, while the others closest to the convex hull are the metastable phases. The steady-state phases include Hf6N (R![[3 with combining macron]](https://www.rsc.org/images/entities/char_0033_0304.gif) m), Hf3N (P6322), Hf3N2 (R
m), Hf3N (P6322), Hf3N2 (R![[3 with combining macron]](https://www.rsc.org/images/entities/char_0033_0304.gif) m), HfN (Fm
m), HfN (Fm![[3 with combining macron]](https://www.rsc.org/images/entities/char_0033_0304.gif) m), Hf5N6 (C2/m), and Hf3N4 (C2/m), while Hf2N (P42/mnm), Hf4N3, (C2/m), Hf6N5 (C2/m), Hf4N5 (I4/m), Hf3N4 (I
m), Hf5N6 (C2/m), and Hf3N4 (C2/m), while Hf2N (P42/mnm), Hf4N3, (C2/m), Hf6N5 (C2/m), Hf4N5 (I4/m), Hf3N4 (I![[4 with combining macron]](https://www.rsc.org/images/entities/char_0034_0304.gif) 3d), and Hf3N4 (Pnma) are the metastable phases. Except for the HfN (Fm
3d), and Hf3N4 (Pnma) are the metastable phases. Except for the HfN (Fm![[3 with combining macron]](https://www.rsc.org/images/entities/char_0033_0304.gif) m) structure, most of these compounds have not been prepared or the preparation conditions are very harsh. In 2009, Dzivenko et al. first announced the crystal growth of cubic Hf3N4 using a laser-heated diamond anvil cell under the conditions of 15 GPa and 2500 K.25 Similarly, Salamat et al. crystallized the amide-derived nanocrystalline Hf3N4 in the diamond anvil cell under 12 GPa at 1500 K, making it with a tetragonally distorted fluorite structure, which was further heated to 2000 K under 19 GPa to obtain the orthorhombic Hf3N4.26 Such harsh preparation conditions hinder the development of Hf–N binary compounds for applications. If there is a relatively simple method to prepare these compounds, it would be highly beneficial for their future research and application.
m) structure, most of these compounds have not been prepared or the preparation conditions are very harsh. In 2009, Dzivenko et al. first announced the crystal growth of cubic Hf3N4 using a laser-heated diamond anvil cell under the conditions of 15 GPa and 2500 K.25 Similarly, Salamat et al. crystallized the amide-derived nanocrystalline Hf3N4 in the diamond anvil cell under 12 GPa at 1500 K, making it with a tetragonally distorted fluorite structure, which was further heated to 2000 K under 19 GPa to obtain the orthorhombic Hf3N4.26 Such harsh preparation conditions hinder the development of Hf–N binary compounds for applications. If there is a relatively simple method to prepare these compounds, it would be highly beneficial for their future research and application.
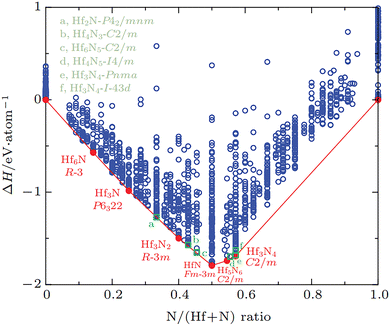 | ||
| Fig. 1 Diagram of the stable phases of the Hf–N system.24 | ||
In this study, Hf3N4 thin films were prepared by a three-step process first involving the sputtering deposition of Hf followed by N2 plasma immersion (NPI) and post-annealing under a low vacuum at relatively lower temperature. Further, the Hf3N4 thin film was fabricated on Cu foil as the working electrode and a Li metal plate was used as the counter electrode to assemble a half cell. The electrochemical performance and Li+-storage ability of the Hf3N4 thin-film electrodes were tested and satisfactory results were obtained.
2 Experimental section
2.1 Preparation of Hf3N4 thin films
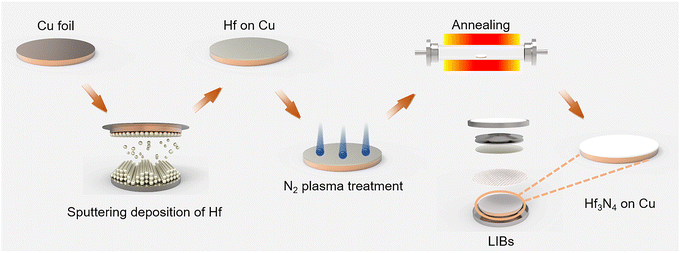
Hf thin films were deposited by a magnetron sputtering system (ACT2000 PHASE II). Si wafer (100) was oxidized to form a 200 nm-thick SiO2 at the surface, which was then used as the substrate for the Hf thin-film deposition. A Hf metal target with a purity of 99.99% was used for the sputtering deposition. Before the sputtering process, the vacuum chamber was evacuated to a base pressure of 10−6 Pa. Then the target was pre-sputtered by Ar plasma for 30 min to remove any contamination. During the deposition, the working pressure was maintained at 0.15 Pa, while the distance between the target and substrate was 55 mm, the sputtering power was 45 W, and the thickness of the Hf thin films was fixed at 10 nm.The obtained Hf thin films were immersed into N2 plasma with the RF power of 100 W under ∼0.2 torr for 15 to 60 min. After the plasma treatment, the thin films were annealed in a tube furnace at 800 °C for 30 min under a N2/H2 (9![[thin space (1/6-em)]](https://www.rsc.org/images/entities/char_2009.gif) :
:![[thin space (1/6-em)]](https://www.rsc.org/images/entities/char_2009.gif) 1) atmosphere, leading to the formation of Hf3N4 thin films. A schematic diagram of the preparation process can be seen in Fig. 2.
1) atmosphere, leading to the formation of Hf3N4 thin films. A schematic diagram of the preparation process can be seen in Fig. 2.
2.2 Characterization of the materials
Atomic force microscopy (AFM) was used to characterize the surface morphology and roughness of the thin films. X-Ray photoelectron energy spectrometry (XPS) was used to analyze the bonding and oxidation states of Hf in the Hf3N4 thin films. The crystal structure and chemical composition of the Hf3N4 thin films were identified using a spherical aberration corrected transmission electron microscopy system (AC-TEM) equipped with an energy dispersive spectrometry unit (EDS) and electron energy loss spectrometry (EELS).2.3 Battery fabrication
The H3N4 thin film as the working electrode was prepared on Cu foil by the above process. Also, 1 M LiPF6 was dissolved in methylene carbonate (EC), dimethyl carbonate (DEC), and dimethyl carbonate (DMC) as the electrolyte for LIBs (EC![[thin space (1/6-em)]](https://www.rsc.org/images/entities/char_2009.gif) :
:![[thin space (1/6-em)]](https://www.rsc.org/images/entities/char_2009.gif) DEC
DEC![[thin space (1/6-em)]](https://www.rsc.org/images/entities/char_2009.gif) :
:![[thin space (1/6-em)]](https://www.rsc.org/images/entities/char_2009.gif) DMC = 1
DMC = 1![[thin space (1/6-em)]](https://www.rsc.org/images/entities/char_2009.gif) :
:![[thin space (1/6-em)]](https://www.rsc.org/images/entities/char_2009.gif) 1
1![[thin space (1/6-em)]](https://www.rsc.org/images/entities/char_2009.gif) :
:![[thin space (1/6-em)]](https://www.rsc.org/images/entities/char_2009.gif) 1). A Celgard 2500 monolayer polypropylene film was used as the separator and a Li metal plate was used as the counter electrode. The whole process was implemented in the glove box for the assembly of half-cells. The subsequent electrochemical tests could be carried out after the battery was aged for more than 10 h.
1). A Celgard 2500 monolayer polypropylene film was used as the separator and a Li metal plate was used as the counter electrode. The whole process was implemented in the glove box for the assembly of half-cells. The subsequent electrochemical tests could be carried out after the battery was aged for more than 10 h.
The powder of the cathode material used for the full-cells was composed of 70 wt% LiFePO4, 20 wt% carbon black, and 10 wt% polyvinylidenedifluoride (PVDF). First, this powder was added into an appropriate amount of N-methyl pyrrolidone (NMP) solution. Then the resulting mixture was stirred at 800 RPM for 12 h to make it evenly mixed. The obtained cathode material was coated on an aluminum foil and dried in a vacuum oven at 80 °C for 12 h, and finally rolled for 12 h to obtain the cathode sheet.
2.4 Electrochemical measurements
Using the small-current battery tester (Neware, CT-4008T), the voltage window was set as 0.01–3.0 V (relative to Li/Li+) to test The cycling and rate performance were assessed for button batteries. Here, an electrochemical workstation (CHI-760E) was used to obtain the cyclic voltammetry (CV) curves and electrochemical impedance spectra. The fabrication of full-cells was consistent with that of half cells in this work. The voltage window was set as 1–2.5 V and the current density was 0.1 A g−1.3 Results and discussion
3.1 Characterizations of the thin films
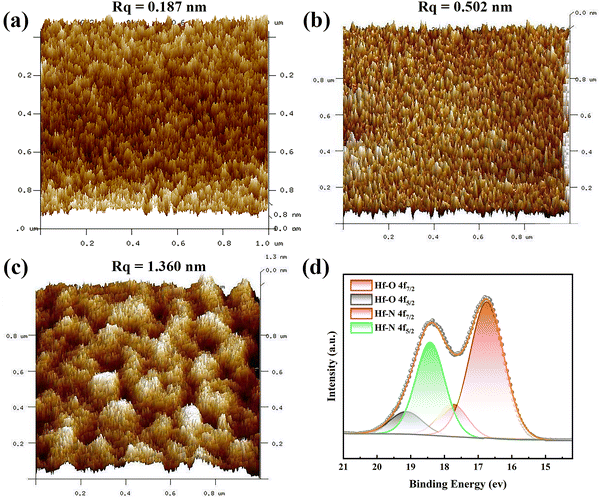
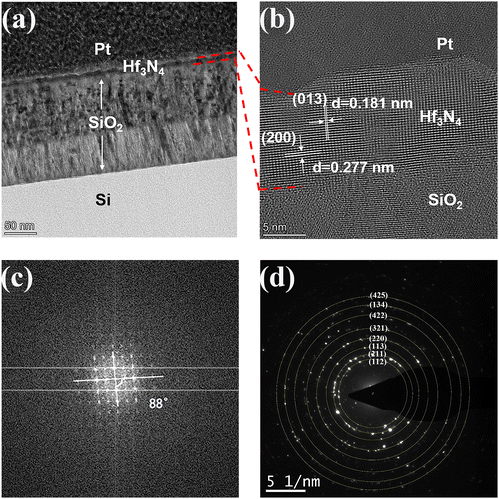
The surface morphologies of the Hf thin films before and after the NPI followed by annealing were inspected by AFM, and the results are shown in Fig. 3(a)–(c). The surface of the as-deposited Hf thin film with a root-mean-square roughness (Rq) of ∼0.187 nm was considerably smoother than those of Hf thin films after the NPI and post-annealing. The surface roughness of thin films could be greatly increased by the NPI and Rq kept increasing with the duration of NPI, which was caused by the incessant ion bombardment. The higher surface roughness of the thin films used as electrodes with a larger specific surface area may be beneficial for battery applications. XPS analysis was performed to determine the oxidation state of Hf in the thin films after the NPI and post-annealing. Fig. 3(d) shows the Hf 4f XPS spectra of the Hf thin film after NPI for 30 min and post-annealing and it was found that there were Hf–O and Hf–N bonds in the Hf thin film. The XPS peaks located at around 16.7 and 18.5 eV individually corresponded to the Hf 4f7/2 and 4f5/2 of Hf–N bonding, suggesting that the oxidation state of Hf was +4.27 The XPS peaks observed at around 17.7 and 19.2 eV represent the Hf 4f7/2 and 4f5/2 of Hf–O bonding, respectively. The existence of Hf–O bonds in the thin film was due to the slight oxidation of the surface after the sample was stored under atmosphere.28,29 The XPS result indicates that NPI for 30 min may be sufficient for the complete conversion of the 10 nm-thick Hf thin film into Hf3N4. Consequently, the following characterizations and battery application focus on the Hf thin film prepared after NPI for 30 min and post-annealing.To identify the crystal structure of the Hf thin film after NPI for 30 min and post-annealing, AC-TEM was used to characterize it in this study, as can be seen in Fig. 4. Fig. 4(a) shows the cross-sectional TEM image, in which the as-prepared thin film on SiO2/Si substrate can be seen. The SiO2 layer displayed a bilayer structure, which might be due to the difference in oxygen concentration. Fig. 4(b) and (c) show the high-resolution TEM image of the as-prepared thin film and the diffraction pattern processed by fast Fourier transform (FFT). The two crystal plane spacings of the as-prepared thin film were estimated to be 0.181 and 0.277 nm, corresponding to the (013) and (200) interplanar distances of the orthorhombic Hf3N4 with the space group Pnma, respectively. Moreover, the angle between the (013) and (200) planes of the orthorhombic Hf3N4 was measured to be around 88° (Fig. 4(c)).
 | (1) |
To verify this result, the theoretical angle between the (013) and (200) planes of the orthorhombic Hf3N4 can be calculated using eqn (1), where φ is the angle between two crystal planes, (h, k, l) is the index of the crystal plane, and a, b, and c are the lattice parameters. The calculated angle was equal to 90°, which was consistent with our analytical result. There was an error of 2°, which probably came from the polycrystalline material rather than the single-crystal one. The as-prepared thin film material could be identified as orthorhombic Hf3N4 since the pair of crystal plane spacings and the angle between them are unique for each material. The selected area electron diffraction (SAED) pattern of the orthorhombic Hf3N4 thin film in Fig. 4(d) shows a set of diffraction rings constructed by a number of diffraction spots, representing the various crystal planes in the orthorhombic Hf3N4. It was confirmed that the orthorhombic Hf3N4 thin film prepared in this study was polycrystalline. These diffraction rings corresponded to the (112), (211), (113), (220), (321), (422), (134), and (425) crystal planes of orthorhombic Hf3N4 separately. The crystal plane spacings of the Hf3N4 thin film obtained in this study were compared with those from the JCPDS database, as listed in Table S1 (ESI†). In addition, the Hf and N elements in the thin film were separately detected by an EDS and EELS system equipped with TEM. As can be seen in Fig. S1a (ESI†), the Hf element was evenly distributed in the thin film. It was observed that there was an energy loss peak at 401.7 eV in the EELS spectrum in Fig. S1b (ESI†), corresponding to the K-edge of N3−.30
3.2 Electrochemical measurements and analysis
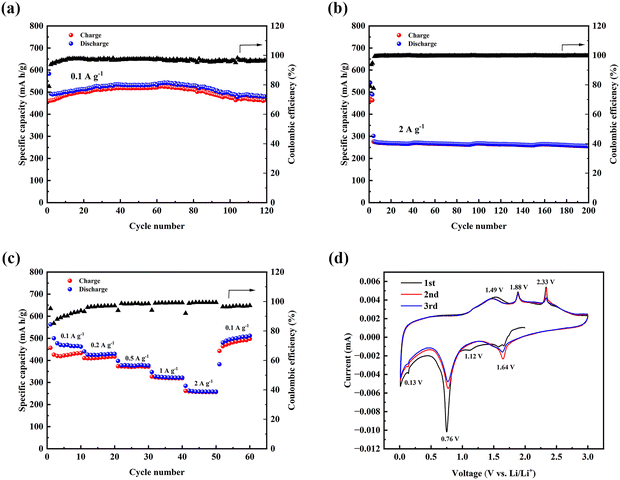
Next, the orthorhombic Hf3N4 thin-film electrode prepared on Cu foil was assembled into the button cell to test its Li+-storage performance. Fig. 5(a) shows the cyclic performance of the orthorhombic Hf3N4 thin-film electrode at a current density of 0.1 A g−1. The initial discharge capacity was 583.2 mA h g−1 and then decreased to 492.7 mA h g−1 in the second cycle. The discharge capacity gradually increased with cycling, reaching a maximum of 543.6 mA h g−1 in the 66th cycle. This value was very close to the theoretical value 543.7 mA h g−1 after the complete conversion of Hf3N4, and we suspect that in addition to the conversion reaction, the system also experienced lithium-ion embedding or alloying. The phenomenon of gradually increasing specific capacity can be attributed to the activation of the electrode materials during cycling, forming more optimized ion channels to improve the battery performance.7 It was gratifying that the battery still had a high discharge capacity of 480.3 mA h g−1 after 200 cycles and the Coulombic efficiency remained above 96.6%. Within the same voltage window (0.01–3 V), the battery was tested for long-term cycling at a high current density of 2 A g−1 as shown in Fig. 5(b). Before conducting the charge–discharge process at high current density, the electrode material was activated in the first three cycles at 0.1 A g−1. It could be seen that the discharge capacity initially reached 301.8 mA h g−1. After 200 cycles, it could be kept at about 260 mA h g−1 with a capacity retention of 85% and a stable coulombic efficiency close to 100%. In order to evaluate the practical applicability of the Hf3N4 thin-film electrodes, we further fabricated full-cells with the LiFePO4 cathode and tested the specific capacity at a current density of 0.1 A g−1, as can be seen in Fig. S3 (ESI†). After some capacity fluctuation in the first few cycles, the charge and discharge capacities tended to be more stable and the Coulombic efficiency finally reached 93%.The rate capability is another key indicator for electrode materials and so the battery was tested at various current densities within the voltage window of 0.01–3 V. The current density was gradually increased from 0.1 to 2 A g−1 in 4 steps and finally returned to 0.1 A g−1, where cycling at each current density proceeded for 10 cycles, as shown in Fig. 5(c). The discharge capacity of the orthorhombic Hf3N4 thin-film electrode was 563.2 mA h g−1 at 0.1 A g−1 initially and the coulombic efficiency increased to 94% after 10 cycles. At the current density of 0.2 A g−1, the discharge capacity was above 400 mA h g−1 and the Coulombic efficiency remained higher than 97%. Even at a high current density of 2 A g−1, the orthorhombic Hf3N4 thin-film electrode could still provide a discharge capacity of about 280 mA h g−1 and a Coulombic efficiency close to 100%. When the current density was restored to 0.1 A g−1, the discharge capacity recovered to 511.2 mA h g−1 and the Coulombic efficiency remained above 97%. At high current density, diffusion limitation is the main reason for the low capacity. Our results show that the Coulombic efficiency of the orthorhombic Hf3N4 thin-film electrode was maintained at a high level and its capacity recovery was good as the current density returned from 2 to 0.1 A g−1, indicating its excellent rate capability. Compared with previous research using other TMN thin films as the electrodes of LIBs, the orthorhombic Hf3N4 thin-film electrode demonstrated superior performance. For example, TiN thin-film electrodes prepared by Raman et al. exhibited a stable capacity of only about 206 mA h g−1 at a current density of 25 μA cm−2 and capacity attenuation was very obvious.31 Fu et al. used hexagonal Fe3N, Co3N, and Ni3N thin films as electrodes grown by pulse laser deposition (PLD).32,33 In 40 cycles, their specific capacities were only within 320–440 mA h g−1, which are significantly lower than that of our Hf3N4 thin-film electrode. Similarly, a Mn3N2 thin-film electrode exhibited capacity fluctuation within 300–500 mA h g−1, indicating its poor lithium-storage stability.34 The performance of a reported Ni2N thin-film electrode was comparable to that of the Hf3N4 thin film electrode prepared in this work and the specific capacity of Ni2N remained at 461.9 mA h g−1 at 0.12 A g−1 after 100 cycles.35 The performances of some TMN thin-film electrodes used in LIBs are listed in Table S2 (ESI†) for further comparison. Overall, the orthorhombic Hf3N4 thin-film electrode has a relatively high potential among TMNs for further study.
To explore the electrochemical reaction mechanism of the orthorhombic Hf3N4 thin-film electrode during the charge–discharge process, CV curves were measured at a scan rate of 0.2 mV s−1, as shown in Fig. 5(d). The CV curve of the first cycle was significantly different from those of the last two cycles. A weak reduction peak at 1.12 V could only be observed in the first-cycle CV curve, corresponding to the formation of a solid–electrolyte interface (SEI) layer during the initial lithiation process, which is the main reason for the different first-cycle CV curve from the subsequent ones. In addition, the electrode would be activated after the first discharge and its structure changed. In the subsequent cycles, the activation of the electrode material was no longer as strong as that in the first cycle, so that the CV curves almost coincided after the first cycle. The CV curves of the first three cycles also showed multiple redox peaks, with oxidation peaks located at 1.49, 1.88, and 2.33 V, respectively, while the remaining reduction peaks were located at 1.64, 0.76, and 0.13 V, respectively. After the first cycle, these redox peaks in the subsequent two CV curves overlapped to a large extent and the changes in the peak intensities were not obvious, which reflects that the electrochemical reactions in the electrode material during the charge–discharge process were highly reversible. At the same time, the formation of SEI layers can reduce the reaction between electrode materials and electrolytes, thereby protecting the electrodes and ultimately ensuring the good electrochemical performance of batteries.36
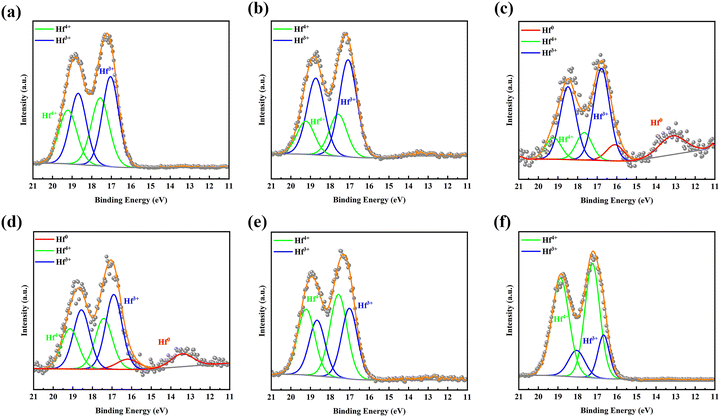
By observing the curve of the voltage and capacity change (Fig. S2, ESI†), it could be seen that it changed smoothly and displayed a voltage plateau; therefore, it can be identified as a two-phase reaction mechanism. To verify the electrochemical reactions of the orthorhombic Hf3N4 thin-film electrode during the charge–discharge process, the electrodes were characterized by XPS after charging or discharging to specific voltages, as shown in Fig. 6. The XPS spectrum of the as-prepared thin-film electrode (Fig. 3(d)) was used as the reference for comparison. The XPS spectrum of the electrode after discharging to 1.0 V, as shown in Fig. 6(a), was compared with that in Fig. 3(d), so that we could speculate on the electrochemical reaction of the electrode at the first reduction peak of the CV curve (1.64 V). Identically, the electrochemical reactions of the electrode at other redox peaks of the CV curve (0.13, 0.76, 1.49, 1.88, and 2.33 V) could also be deduced.37,38 When the discharge voltage reached 1.0 V, the percentage of Hf4+ in the electrode decreased greatly and Hf3+ began to appear at the same time. It is speculated that the Hf3N4 starts to be reduced into HfN under discharge at 1.64 V. As it is discharged to 0.5 V, the percentage of Hf4+ in the electrode further decreases and that of Hf3+ keeps increasing (Fig. 6(b)), indicating that the same reaction keeps proceeding under discharge from 1.64 to 0.76 V. The metal Hf is formed in the electrode as it is discharged to 0.01 V (Fig. 6(c)), implying that the Hf3N4 and HfN start to be reduced into Hf under discharge at 0.13 V in addition to the reduction of Hf3N4 into HfN. Oppositely, the Hf tends to be totally oxidized into HfN and Hf3N4 as well as the HfN tends to be partially oxidized into Hf3N4 under charge from 0.01 to 2.0 V (Fig. 6(d) and (e)). As the charge voltage reaches 3.0 V, the percentage of Hf4+ in the electrode further increases, suggesting that the HfN is further oxidized into Hf3N4 at 2.33 V (Fig. 6(f)). The details concerning the electrochemical reactions of the orthorhombic Hf3N4 thin-film electrode during the charge–discharge process are summarized in Table 1. It is noted that the orthorhombic Hf3N4 thin-film electrode became a composite one of HfN/Hf3N4 after the cycling.
3.3 Deep analysis of the Li+-storage mechanism of the orthorhombic Hf3N4
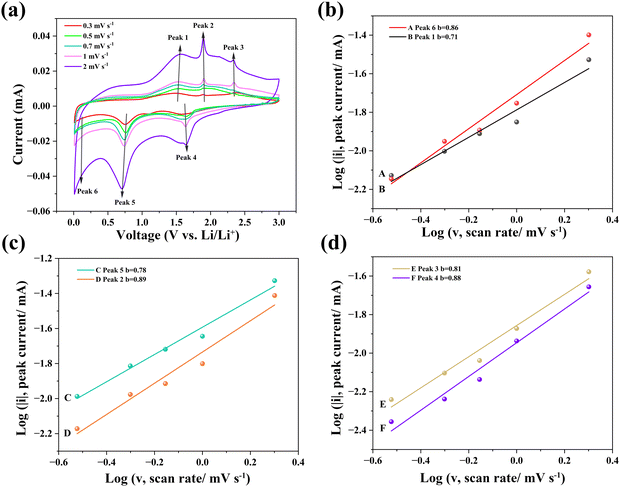
To further analyze the Li+-storage mechanism of the orthorhombic Hf3N4 thin-film electrode, CV curves of the electrode were obtained by testing at different scan rates (0.3, 0.5, 0.7, 1, and 2 mV s−1). The second cycle at each scan rate was selected as the test result, as shown in Fig. 7(a). It could be seen that the positions and shapes of the oxidation and reduction peaks at different scan rates were almost unchanged, indicating that the electrochemical polarization of the electrode did not become significant with increasing the scan rate, which is conducive for the intercalation/deintercalation of Li+ in the electrode. In the CV curves, different scan rates corresponded to certain peak currents, which basically obey the power law as below:39| i = avb | (2) |
The Li+-storage mechanism in the electrode can be analyzed more specifically by quantifying the contributions of the pseudo-capacitance and diffusion process to the total capacity. The overall current (i) composed of the capacitive (K1v) and the diffusion-controlled (K2v1/2) currents can be expressed as eqn (3), which can be further evolved into eqn (4), where i(v) is the current as a function of scan rate, and K1 and K2 are constants.40
| i(v) = K1v + K2v1/2 | (3) |
| i(v)v−1/2 = K1v1/2 + K2 | (4) |
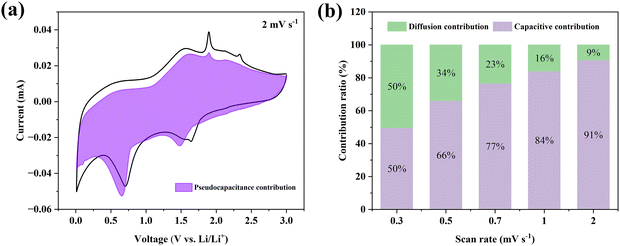
In the CV curves at different scan rates (Fig. 7(a)), the i(v)v−1/2 as a function of v1/2 at a certain potential can be fitted to obtain the slope K1 and the intercept K2. Then the values of the capacitive current (K1v) at each specific voltage can be calculated. The area surrounded by the capacitive current–voltage curve is the contribution of pseudo-capacitance to the total capacity. Fig. 8(a) exhibits the calculated capacity contributions from the pseudo-capacitance of 91% (purple region within the CV curve) and from the diffusion process of 9% (white region within the CV curve) at 2 mV s−1. Further, the contribution ratios of the pseudo-capacitance and diffusion process to the total capacity at different scan rates are shown in Fig. 8(b). It can be seen that the contribution of pseudo-capacitance to the total capacity gradually increased with the scan rate from 0.3 to 2 mV s−1, which indicates that the contribution of pseudo-capacitance to the total capacity was more dominant when the charge–discharge process was faster. The pseudo-capacitance mechanism for Li-ion storage involves a highly reversible chemisorption, desorption, and/or redox reaction. These processes are not limited to the electrode surface, but can be extended into its subsurface, thus providing a higher specific capacity and energy density than those contributed by the diffusion mechanism. The pseudo-capacitive mechanism, which is positive for the battery performance, has been proven in previous reports,41,42 leading to the high specific capacity of the orthorhombic Hf3N4 thin-film electrodes.
4 Conclusions
In this work, orthorhombic Hf3N4 thin films were prepared by the sputtering deposition of Hf followed by NPI and post-annealing under a relatively lower temperature and pressure. The surface morphology of the thin films was characterized by AFM, showing that the surface of the thin films became rougher after the NPI and the surface roughness increased with the duration of NPI. The higher surface roughness led to a larger specific surface area for the thin films, which may be conducive to the thin films as electrodes for improving the battery performance. The characteristic XPS peaks revealed that the 10 nm-thick Hf thin film could be completely transformed into Hf3N4 after NPI for 30 min and post-annealing. The orthorhombic structure (space group: Pnma) of the as-prepared thin film was further identified by TEM analysis.The orthorhombic Hf3N4 thin-film electrode achieved a specific capacity of 480.3 mA h g−1 at 0.1 A g−1 after 200 cycles with a Coulombic efficiency above 96.6%. At a current density of 2 A g−1, the specific capacity of 260 mA h g−1 could be preserved after 200 cycles with a Coulombic efficiency of nearly 100%. The orthorhombic Hf3N4 thin film electrode also displayed excellent rate performance, implying its high structure stability during the charge–discharge process. The redox peaks in the CV curves of the battery indicate that the intercalation/deintercalation of Li+ in the orthorhombic Hf3N4 thin-film electrode was highly reversible. The electrochemical reactions corresponding to each reduction or oxidation peak in the CV curve were speculated on by XPS analysis. By processing and analyzing the CV curves at different scan rates, it was found that the contribution of pseudo-capacitance was the main reason for the high specific capacity of the orthorhombic Hf3N4 thin-film electrode.
In summary, the facile preparation of orthorhombic Hf3N4 thin films has been first announced in this paper. The Hf3N4 thin films used as the electrodes of LIBs exhibited a high specific capacity and cycling stability for the development of TFLIBs, which can be expected to be further promoted and explored in the near future.
Data availability
The data supporting the findings of this study are available on request from the corresponding author.Conflicts of interest
The authors declare no conflict of interest.Acknowledgements
This work was supported by the Grants from Harbin Institute of Technology, Harbin, China (AUGA5710000920). The authors thank the Space Environment Simulation Research Infrastructure (SESRI) in Harbin Institute of Technology for the assistance in our experiments.References
- J. Lin, L. Lin, S. Qu, D. Deng, Y. Wu, X. Yan, Q. Xie, L. Wang and D. Peng, Promising Electrode and Electrolyte Materials for High-Energy-Density Thin-Film Lithium Batteries, Energy Environ. Mater., 2022, 5, 133–156 CrossRef CAS.
- Q. Xia, F. Zan, Q. Zhang, W. Liu, Q. Li, Y. He, J. Hua, J. Liu, J. Xu, J. Wang, C. Wu and H. Xia, All-Solid-State Thin Film Lithium/Lithium-Ion Microbatteries for Powering the Internet of Things, Adv. Mater., 2023, 35, 2200538 CrossRef CAS PubMed.
- J. Li, Y. Zhang, M. Huo, S.-H. Ho and H.-S. Tsai, Metallic group VB transition metal dichalcogenides for electrochemical energy storage, Mater. Today Chem., 2022, 26, 101241 CrossRef CAS.
- Z. Shi, H. Huang, C. Wang, M. Huo, S.-H. Ho and H.-S. Tsai, Heterogeneous transition metal dichalcogenides/graphene composites applied to the metal-ion batteries, Chem. Eng. J., 2022, 447, 137469 CrossRef CAS.
- H.-S. Tsai, J. Li, Z. Shi, M. Huo and S.-H. Ho, Group IV elemental 2D materials beyond graphene used as electrodes for alkali-ion batteries, Mater. Chem. Front., 2023, 7, 1312–1320 RSC.
- H.-S. Tsai, Polymorphic Phosphorus Applied to Alkali-Ion Battery Electrodes, Small Methods, 2022, 6, 2200735 CrossRef CAS PubMed.
- B. Zhao, M. Nisula, A. Dhara, L. Henderick, F. Mattelaer, J. Dendooven and C. Detavernier, Atomic Layer Deposition of Indium-Tin-Oxide as Multifunctional Coatings on V2O5 Thin-Film Model Electrode for Lithium-Ion Batteries, Adv. Mater. Interfaces, 2020, 7, 2001022 CrossRef CAS.
- Z. Ma, Z. Li, Y. Zeng, P. Li and H. Zhang, High electrochemical performance of γ′′-FeN thin film electrode for lithium ion batteries, J. Power Sources, 2019, 423, 159–165 CrossRef CAS.
- L. Wang, J. Sun, R. Song, S. Yang and H. Song, Hybrid 2D–0D Graphene–VN Quantum Dots for Superior Lithium and Sodium Storage, Adv. Energy Mater., 2016, 6, 1502067 CrossRef.
- H. Zhang, W. Hu, B. Wei, J. Zheng, Z. Qi and Z. Wang, Freestanding Co3N thin film for high performance supercapacitors, Ceram. Int., 2021, 47, 3267–3271 CrossRef CAS.
- W. Li, X. Xu, T. Gao, T. Harumoto, Y. Nakamura and J. Shi, Enhanced perpendicular magnetic anisotropy of ferrimagnetic Mn4N films deposited on the glass substrate, J. Phys. D: Appl. Phys., 2022, 55, 275004 CrossRef CAS.
- G. Durai, P. Kuppusami, T. Maiyalagan, M. Ahila and P. Vinoth Kumar, Supercapacitive properties of manganese nitride thin film electrodes prepared by reactive magnetron sputtering: Effect of different electrolytes, Ceram. Int., 2019, 45, 17120–17127 CrossRef CAS.
- D. Zhang, H. Li, A. Riaz, A. Sharma, W. Liang, Y. Wang, H. Chen, K. Vora, D. Yan, Z. Su, A. Tricoli, C. Zhao, F. J. Beck, K. Reuter, K. Catchpole and S. Karuturi, Unconventional direct synthesis of Ni3N/Ni with N-vacancies for efficient and stable hydrogen evolution, Energy Environ. Sci., 2022, 15, 185–195 RSC.
- B. Wei, H. Liang, D. Zhang, Z. Qi, H. Shen and Z. Wang, Magnetron sputtered TiN thin films toward enhanced performance supercapacitor electrodes, Mater. Renew. Sustain. Energy, 2018, 7, 11 CrossRef.
- A. M. Kia, J. Speulmanns, S. Bönhardt, J. Emara, K. Kühnel, N. Haufe and W. Weinreich, Spectroscopic analysis of ultra-thin TiN as a diffusion barrier for lithium-ion batteries by ToF-SIMS, XPS, and EELS, Appl. Surf. Sci., 2021, 564, 150457 CrossRef.
- A. Jrondi, G. Buvat, F. D. L. Pena, M. Marinova, M. Huvé, T. Brousse, P. Roussel and C. Lethien, Major Improvement in the Cycling Ability of Pseudocapacitive Vanadium Nitride Films for Micro-Supercapacitor, Adv. Energy Mater., 2023, 13, 2203462 CrossRef CAS.
- L. Hallett, I. Charaev, A. Agarwal, A. Dane, M. Colangelo, D. Zhu and K. K. Berggren, Superconducting MoN thin films prepared by DC reactive magnetron sputtering for nanowire single-photon detectors, Supercond. Sci. Technol., 2021, 34, 035012 CrossRef.
- S.-Y. Chun, Mechanical and Structural Behavior of HfN Thin Films Deposited by Direct Current and Mid-Frequency Magnetron Sputtering, J. Nanosci. Nanotechnol., 2021, 21, 4125–4128 CrossRef CAS PubMed.
- Y.-E. Ke and Y.-I. Chen, Mechanical properties, bonding characteristics, and thermal stability of magnetron-sputtered HfNx films, Surf. Coat. Technol., 2020, 388, 125575 CrossRef CAS.
- N. Sucheewa, W. Wongwiriyapan, A. Klamchuen, M. Obata, M. Fujishige, K. Takeuchi, T. Lertvanithphol, T. Wutikhun, S. Kullyakool, W. Auttasiri, N. Sowasod, T. Prataen, W. Tanthapanichakoon and J. Nukeaw, Tailoring Properties of Hafnium Nitride Thin Film via Reactive Gas-Timing RF Magnetron Sputtering for Surface Enhanced-Raman Scattering Substrates, Crystals, 2022, 12, 78 CrossRef CAS.
- S.-Y. Chun, Low Resistivity Hafnium Nitride Thin Films Deposited by Inductively Coupled Plasma Assisted Magnetron Sputtering in Microelectronics, J. Nanosci. Nanotechnol., 2021, 21, 4129–4132 CrossRef CAS PubMed.
- Z. Gu, C. Hu, H. Huang, S. Zhang, X. Fan, X. Wang and W. Zheng, Identification and thermodynamic mechanism of the phase transition in hafnium nitride films, Acta Mater., 2015, 90, 59–68 CrossRef CAS.
- Z. Gao, Z. Wu, S. Zhao, T. Zhang and Q. Wang, Enhanced capacitive property of HfN film electrode by plasma etching for supercapacitors, Mater. Lett., 2019, 235, 148–152 CrossRef CAS.
- T. Fan, Q.-F. Zeng and S.-Y. Yu, Novel compounds in the hafnium nitride system: first principle study of their crystal structures and mechanical properties, Acta Phys. Sin., 2016, 65, 118102 CrossRef.
- D. A. Dzivenko, A. Zerr, G. Miehe and R. Riedel, Synthesis and properties of oxygen-bearing c-Zr3N4 and c-Hf3N4, J. Alloys Compd., 2009, 480, 46–49 CrossRef CAS.
- A. Salamat, A. L. Hector, B. M. Gray, S. A. J. Kimber, P. Bouvier and P. F. McMillan, Synthesis of Tetragonal and Orthorhombic Polymorphs of Hf3N4 by High-Pressure Annealing of a Prestructured Nanocrystalline Precursor, J. Am. Chem. Soc., 2013, 135, 9503–9511 CrossRef CAS PubMed.
- S. Karwal, M. A. Verheijen, B. L. Williams, T. Faraz, W. M. M. Kessels and M. Creatore, Low resistivity HfNx grown by plasma-assisted ALD with external rf substrate biasing, J. Mater. Chem. C, 2018, 6, 3917–3926 RSC.
- S. Zeng, T. Muneshwar, S. Riddell, A. P. Manuel, E. Vahidzadeh, R. Kisslinger, P. Kumar, K. M. M. Alam, A. E. Kobryn, S. Gusarov, K. C. Cadien and K. Shankar, TiO2-HfN Radial Nano-Heterojunction: A Hot Carrier Photoanode for Sunlight-Driven Water-Splitting, Catalysts, 2021, 11, 1374 CrossRef CAS.
- A. Mozalev, M. Bendova, F. Gispert-Guirado and E. Llobet, Hafnium-Oxide 3-D Nanofilms via the Anodizing of Al/Hf Metal Layers, Chem. Mater., 2018, 30, 2694–2708 CrossRef CAS.
- G. Haberfehlner, S. F. Hoefler, T. Rath, G. Trimmel, G. Kothleitner and F. Hofer, Benefits of direct electron detection and PCA for EELS investigation of organic photovoltaics materials, Micron, 2021, 140, 102981 CrossRef CAS PubMed.
- K. H. T. Raman, T. R. Penki, N. Munichandraiah and G. M. Rao, Titanium nitride thin film anode: chemical and microstructural evaluation during electrochemical studies, Electrochim. Acta, 2014, 125, 282–287 CrossRef CAS.
- Z. W. Fu, Y. Wang, X. L. Yue, S. L. Zhao and Q. Z. Qin, Electrochemical Reactions of Lithium with Transition Metal Nitride Electrodes, J. Phys. Chem. B, 2004, 108, 2236–2244 CrossRef CAS.
- Y. Wang, Z. W. Fu, X. L. Yue and Q. Z. Qin, Electrochemical Reactivity Mechanism of Ni3N
![[thin space (1/6-em)]](https://www.rsc.org/images/entities/char_2009.gif) with Lithium, J. Electrochem. Soc., 2004, 151, E162 CrossRef CAS.
with Lithium, J. Electrochem. Soc., 2004, 151, E162 CrossRef CAS. - Q. Sun and Z. W. Fu, Mn3N2 as a novel negative electrode material for rechargeable lithium batteries, Appl. Surf. Sci., 2012, 258, 3197–3201 CrossRef CAS.
- Z. Ma, H. Zhang, X. Sun, J. Guo and Z. Li, Preparation and characterization of nanostructured Ni2N thin film as electrode for lithium ion storage, Appl. Surf. Sci., 2017, 420, 196–204 CrossRef CAS.
- H. Buqa, J. Vetter and F. Krumeich, SEI film formation on highly crystalline graphitic materials in lithium-ion batteries, J. Power Sources, 2006, 153, 385–390 CrossRef CAS.
- Y. Wang, H. Zheng, Q. Qu, L. Zhang, V. S. Battaglia and H. Zheng, Enhancing electrochemical properties of graphite anode by using poly(methylmethacryrlate)-poly(vinylidene fluoride) composite binder, Carbon, 2015, 92, 318–326 CrossRef CAS.
- A. Arranz, Synthesis of hafnium nitride films by 0.5–5 keV nitrogen implantation of metallic Hf: an X-ray photoelectron spectroscopy and factor analysis study, Surf. Sci., 2004, 563, 1–12 CrossRef CAS.
- H. Lindström, S. Södergren, A. Solbrand, H. Rensmo, J. Hjelm, A. Hagfeldt and S.-E. Lindquist, Li + Ion Insertion in TiO2 (Anatase). 2. Voltammetry on Nanoporous Films, J. Phys. Chem. B, 1997, 101, 7717–7722 CrossRef.
- T. C. Liu, W. G. Pell, B. E. Conway and S. L. Roberson, Behavior of Molybdenum Nitrides as Materials for Electrochemical Capacitors: Comparison with Ruthenium Oxide, J. Electrochem. Soc., 1998, 145(6), 1882–1888 CrossRef CAS.
- X. Deng, Z. Wei, C. Cui, Q. Liu, C. Wang and J. Ma, Oxygen-deficient anatase TiO2@C nanospindles with pseudocapacitive contribution for enhancing lithium storage, J. Mater. Chem. A, 2018, 6(9), 4013–4022 RSC.
- B. Zhao, Q. Liu, Y. Chen, Q. Liu, Q. Yu and H. B. Wu, Interface-Induced Pseudocapacitance in Nonporous Heterogeneous Particles for High Volumetric Sodium Storage, Adv. Funct. Mater., 2020, 30, 2002019 CrossRef CAS.
Footnote |
| † Electronic supplementary information (ESI) available. See DOI: https://doi.org/10.1039/d4nh00406j |
| This journal is © The Royal Society of Chemistry 2024 |

