Photoluminescence from FRET pairs coupled with Mie-resonant silicon nanospheres†
Keisuke
Ozawa
,
Masato
Adachi
,
Hiroshi
Sugimoto
 * and
Minoru
Fujii

Department of Electrical and Electronic Engineering, Graduate School of Engineering, Kobe University, 1-1 Rokkodai, Nada, Kobe 657-8501, Japan. E-mail: sugimoto@eedept.kobe-u.ac.jp
First published on 26th January 2024
Abstract
Optically resonant nanoparticles decorated with donor–acceptor molecular pairs have been attracting attention for applications as nanoprobes in bioimaging and biosensing. We produced composite nanoparticles composed of donor–acceptor molecular pairs and silicon nanospheres (Si NSs) with diameters of 100–200 nm exhibiting Mie resonances in the visible range and studied the effect of Mie resonances on their photoluminescence properties. We showed that the photoluminescence spectra are strongly modified by Mie resonances and the spectral shape is controlled in a wide range by the Si NS size; by controlling the size, we can achieve the photoluminescence maximum from that of a donor molecule to that of an acceptor molecule almost continuously. From the photoluminescence decay properties in combination with theoretical calculations, we showed that the observed strong modification of the spectral shape is mainly due to the Purcell effect on donor and acceptor molecules, and the effect of Mie resonances on the Förster resonance energy transfer (FRET) rate is relatively small. We also showed that because of the large Purcell effect and the small FRET rate enhancement, Mie resonances decrease the FRET efficiency.
1 Introduction
Fluorescent nanoparticles have widely been used as nanoprobes for biosensing and bioimaging because of their high sensitivity, versatility, and non-invasive nature.1–4 In particular, nanoprobes composed of dyes and plasmonic nanoparticles possessing localized surface plasmon resonances (LSPRs), e.g., dye-decorated gold (Au) and silver nanoparticles, have been attracting attention because of their enhanced fluorescence that guarantees high sensitivity.5–11 These particles have been utilized for in vivo and in vitro imaging,8,9 detection of biomolecules,10 and diagnosis and treatment of diseases.11LSPRs of plasmonic nanoparticles modify the fluorescence of not only an individual molecule, but also a more complicated molecular system composed of different molecules coupled with each other. In particular, a molecular system coupled with Förster resonance energy transfer (FRET) has been attracting attention.9,12–20 FRET is a non-radiative energy transfer process from an excited donor molecule to an acceptor one through dipole–dipole interaction.21–24 Since the FRET rate scales to the inverse of the 6th power of the donor–acceptor distance, the effective distance is very small, typically less than 10 nm. This makes the detection of nanoscale reactions, such as antigen–antibody reactions and protein–protein interactions, possible by monitoring the fluorescence intensity change of a donor and an acceptor.25–27 Because of the importance of FRET in biomedical fields, the control and enhancement by plasmonic nanoparticles have been intensively studied theoretically and experimentally.16–20,28 However, the mechanism of the spectral modification of a donor–acceptor-coupled system using a plasmonic nanoparticle is not fully elucidated. The difficulty arises from the fact that the broad LSPR of noble metals simultaneously affects the FRET rate and the radiative and non-radiative rates of individual molecules through the Purcell effect.
In this paper, we propose a spherical nanoparticle (nanosphere, NS) of crystalline silicon (Si NS) as a new nanoparticle system to control the fluorescence of donor–acceptor FRET pairs. Due to the high refractive index and low extinction coefficient of crystalline Si in the visible range, a Si NS with the diameter range of 100–200 nm has narrow-band Mie resonances in the visible and near infrared ranges.29–34 The narrow optical resonances make selective enhancement35–37 of donor and acceptor fluorescence possible and allow us to investigate the mechanism of spectral modification. Mie-resonant Si NSs also have several advantages as nanoprobes for practical applications compared to plasmonic nanoparticles. Because of their low-loss nature, the local heating during light irradiation is much smaller and the non-radiative relaxation of dye fluorescence via coupling with lossy modes of a nanoparticle is very small.34,38,39
In this work, we develop a Si NS with a diameter of 100–200 nm decorated with donor (fluorescein-4-isothiocyanate (FITC)) and acceptor (rhodamine B-isothiocyanate (RITC)) molecules to study the fluorescence properties of donor–acceptor FRET pairs near a Mie-resonant dielectric nanoantenna. We first investigate the scattering and photoluminescence (PL) spectra of Si NSs decorated solely with donor molecules by single nanoparticle spectroscopy and discuss the Purcell effect on the donor molecules. We then study simultaneously donor- and acceptor-decorated Si NSs. From the PL spectra and the PL decay rates in combination with numerical simulations, we discuss the decisive factors that determine the spectral shape of donor–acceptor FRET pairs coupled with dielectric optical resonators.
2 Results and discussion
2.1 LSPR of a Au NS vs. Mie resonance of a Si NS
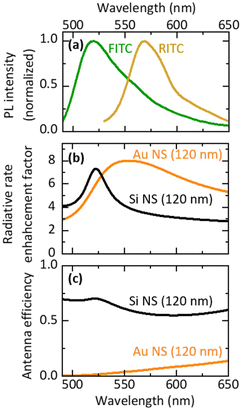
Fig. 1a shows the PL spectra of ethanol solutions of FITC (green curve) and RITC (yellow curve). The absorption spectra are shown in the ESI (Fig. S1†). Fig. 1b shows the radiative rate enhancement factors (EFrad) calculated for an electric dipole placed 5 nm from the surface of a Au NS (orange curve) and a Si NS (black curve) with a diameter of 120 nm. The distance of 5 nm is chosen to imitate actual samples. The data obtained for a dipole oriented parallel and perpendicular to the surface are averaged. The broad peak of a Au NS is due to the LSPR, while the narrow peak of a Si NS is due to the magnetic dipole (MD) Mie resonance. The enhancement factor spectrum of a Au NS spans the PL spectral ranges of FITC and RITC, while the narrow peak of a Si NS overlaps only with the FITC PL. Therefore, the Si NS can selectively enhance the FITC PL and the FRET rate without affecting the RITC PL. The resonance peak of a Si NS can be brought to the desired wavelength by controlling its size. This high tunability of the resonance wavelength is very helpful when investigating the mechanism of spectral modification using an optical resonator. In this work, we changed the diameter of a Si NS from 105 to 193 nm to control the Mie resonance wavelength from the shorter wavelength side of the FITC PL to the longer wavelength side of the RITC PL.In Figure Fig. 1c, the antenna efficiency defined by EFrad/(EFrad + EFnonr), where EFnonr is an enhancement factor of a non-radiative rate, is shown. The antenna efficiency of a Si NS is over 50%, while that of a Au NS is less than 10% at the FITC and RITC PL wavelengths. Therefore, a larger PL enhancement is expected in a Si NS than in a Au NS in the FITC–RITC coupled system.
Note that the antenna efficiency is a function of the distance between an emitting dipole and the surface of a Si NS. It is almost constant when the distance is relatively large and it decreases below ∼5 nm due mainly to the increase of EFnonr (see Fig. S2 in the ESI,† in which distance dependences of EFrad, EFnonr and the antenna efficiency at 522 nm are shown). Since the minimum distance of FITC and RITC molecules from the Si NS surface in the actual samples is ∼5 nm, slight fluctuation of the distance does not strongly affect the antenna efficiency.
2.2 Preparation of FITC- and RITC-decorated Si NSs
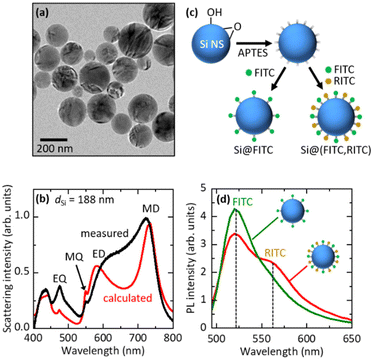
We employed a colloidal dispersion of Si NSs developed in our group40,41 to fabricate FITC- and RITC-decorated Si NSs. Fig. 2a shows the transmission electron microscopy (TEM) image of Si NSs. They have high sphericity and crystallinity.37,40,41 The diameter is distributed in the 50–300 nm range (Fig. S3 in the ESI†). In Figure Fig. 2b, the scattering spectrum (black curve) of a single Si NS with a diameter (dSi) of 188 nm placed on a SiO2 substrate is shown, together with the spectrum calculated using Mie theory (red curve). The MD, electric dipole (ED), magnetic quadrupole (MQ), and electric quadrupole (EQ) Mie modes are seen in the visible range.Fig. 2c shows the schematic illustration of the preparation procedure of a dye-decorated Si NS. First, the surface of a Si NS was functionalized with 3-aminopropyltriethoxysilane (APTES) to obtain NH2 termination. The NH2-functionalized Si NSs were mixed with an FITC solution to prepare FITC-decorated Si NSs (Si@FITC) or mixed with a mixture solution of FITC and RITC to obtain FITC- and RITC-decorated Si NSs (Si@(FITC, RITC)) and stirred (800 rpm) for 20 h at room temperature. The density of dye molecules on the surface of Si NSs was estimated from the absorption spectra. Details of the procedure are shown in the ESI† (“4. Estimation of the number of dye molecules (FITC and RITC) on the Si NS surface”). In this work, we studied Si@(FITC, RITC) with an FITC density of 17.7 molecules per 100 nm2 and an RITC density of 2.08 molecules per 100 nm2. For these densities, efficient FRET from FITC to RITC is expected. In Si@FITC, the FITC density is 20.8 molecules per 100 nm2.
Fig. 2d shows the PL spectra of Si@FITC (green curve) and Si@(FITC, RITC) (red curve) suspensions. The intensities are corrected based on the FITC densities of Si@FITC and Si@(FITC, RITC). The excitation wavelength is 480 nm. At this wavelength, FITC can be efficiently excited, while RITC cannot be directly excited (Fig. S1 in the ESI†). In the PL spectrum of Si@(FITC, RITC), the PL from RITC appears on the tail of the FITC PL, while the intensity of FITC PL decreases compared to that of Si@FITC. These observations provide the evidence of FRET from FITC to RITC.
2.3 PL of Si@FITC
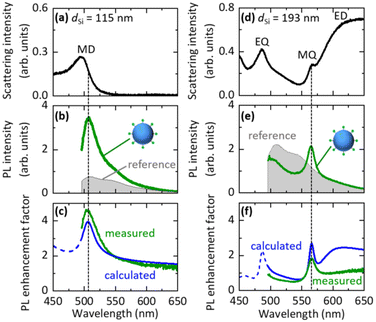
We first studied the PL properties of Si@FITC by single particle spectroscopy. Fig. 3a shows the scattering spectrum of a single Si@FITC with dSi = 115 nm. The MD mode of the Si NS is around the FITC PL. Fig. 3b shows the PL spectrum excited at 488 nm (green curve), together with that of a reference, i.e., a SiO2 NS (200 nm in diameter) decorated with FITC (SiO2@FITC) (grey curve). The SiO2 NS does not have resonances in the wavelength range. In Fig. 3b, the PL intensities are normalized by taking into account the surface areas of a Si NS and a SiO2 NS. The FITC PL is strongly enhanced in Si@FITC compared to that in the reference. Furthermore, the spectral shape is modified. In Figure Fig. 3c, the PL enhancement factors obtained by dividing the Si@FITC PL by the reference PL is shown (green curve). The maximum enhancement factor reaches 4.6.The PL enhancement factor is the product of the electric field intensity enhancement factor at the excitation wavelength and the emission efficiency enhancement factor at the detection wavelength (Purcell effect).42–45 In Fig. 3c, the calculated PL enhancement factor is shown by a blue curve (see the ESI† “5. Calculation of the PL decay rate and intensity enhancement factors for Si@FITC”). The measured and calculated enhancement factor spectra agree very well, and thus the PL is enhanced due to the coupling with the MD mode of the Si NS. Similar data obtained for Si@FITC with dSi = 193 nm are shown in Fig. 3d–f. In this case, the FITC PL couples with the MQ mode of the Si NS. In Fig. 3f, the measured and calculated spectral shapes agree well with the MQ resonance. However, the agreement at the long wavelength side is poor; a broad band appears only in the calculated spectrum. The reason for the discrepancy is not very clear. We discuss the possible causes in the ESI† (“6. Effect of the SiO2 substrate on the PL enhancement factor spectra”).
2.4 PL of Si@(FITC, RITC)
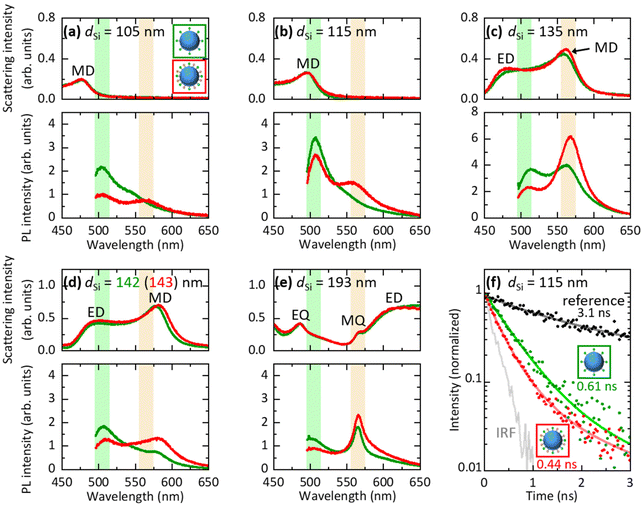
In Fig. 4a–e, we compare PL spectra of Si@(FITC) (green curves) and Si@(FITC, RITC) (red curves) with almost the same sizes (dSi = 105 nm–193 nm from Fig. 4a to e). The intensities are corrected based on the FITC densities of Si@FITC and Si@(FITC, RITC). In Fig. 4a (dSi = 105 nm), the MD resonance of the Si NS is at the shorter wavelength side of the FITC PL, i.e., the radiative rate and the FRET rate of FITC are not affected by the Si NS. In this non-resonant case, RITC PL appears in Si@(FITC, RITC) while its FITC PL is weaker than that in Si@FITC due to FRET. In Fig. 4b (dSi = 115 nm), the MD mode overlaps with the FITC PL. This results in the enhancement of the FITC PL both in Si@(FITC, RITC) and Si@FITC. In Fig. 4c (dSi = 135 nm), the MD resonance is around the peak of the RITC PL. In this case, the RITC PL and the tail of the FITC PL are strongly enhanced. Similar changes of the spectral shape are observed in Fig. 4d and e. In particular, in Fig. 4e (dSi = 193 nm), the PL spectral shape is strongly modified from that in Fig. 4a due to the coupling with the sharp MQ resonance. In the ESI (Fig. S7†), we summarize PL spectra of Si@(FITC, RITC) in a single graph to demonstrate the large modification of the spectral shape by the size of the Si NS. We also show the ratio of the PL intensity at 565 nm (RITC PL peak) and 505 nm (FITC PL peak) (IPL565 nm/IPL505 nm). The ratio changes from 0.53 to 2.8 depending on the Si NS size. The data demonstrate that the combination of Mie resonances and FRET enables the control of the PL spectral shape over a wide range.2.5 FRET rate and FRET efficiency in Si@(FITC, RITC)
Fig. 4f shows the PL decay curves of Si@FITC (green dots) and Si@(FITC, RITC) (red dots) with nearly identical size (dSi = 115 nm) detected at the PL peak of FITC (525 ± 12.5 nm). The decay curve of the reference sample (SiO2@FITC) (black dots) and the instrument response function (IRF) (grey curve) are also shown. The decay curves are strongly modified by the Mie resonances and by FRET. The average PL lifetime obtained by fitting the curves with a double exponential function is shown in the figure. The PL lifetime of the reference (SiO2@FITC) (τref) is 3.1 ns and that of Si@FITC (τD0) is 0.61 ns. Thus, the decay rate enhancement by the Mie resonances is 5.1-fold (= τref/τD0). The PL lifetime of Si@(FITC, RITC) (τDA) is 0.44 ns, which is shorter than that of Si@FITC (0.61 ns). Therefore, it is affected by both the Mie resonances and FRET.In Si@FITC, the PL decay rate is expressed as:
| ΓD0 = EFrad·Γ0rad + EFnonr·Γ0rad + Γ0nonr | (1) |
We now consider how the FRET efficiency (η), defined by η = 1 − IDA/ID0, where ID0 and IDA are the FITC (donor) PL intensities of Si@FITC and Si@(FITC, RITC), respectively, is modified by the Mie resonances. In Table 1, the FRET efficiencies obtained from the PL spectra in Fig. 4 are summarized. For the calculation, ID0 and IDA are assumed to be the peak PL intensity of FITC (505 nm). In Si@(FITC, RITC) with dSi = 105 nm, i.e., in a non-resonant case, the FRET efficiency is 54.4%. This value decreases in Si@(FITC, RITC). It decreases to 21.1% when the FITC PL is coupled with the MD mode (dSi = 115 nm). The observed decrease of η indicates that the relative contribution of FRET in the total decay processes of FITC decreases near a Mie-resonant nanoantenna.
| Diameter (nm) | FRET efficiency (%) |
|---|---|
| 105 | 54.4 |
| 115 | 21.1 |
| 135 | 35.5 |
| 143 | 32.0 |
| 193 | 31.9 |
In Si@(FITC, RITC), the decay rate of the donor is modified from that of Si@FITC to:
 | (2) |
3 Conclusions
We have investigated the effect of Mie resonances of Si NSs on the PL spectral shape of donor–acceptor FRET pairs and the FRET efficiency. We showed in donor- and acceptor-decorated Si NSs that the spectral shape is strongly modified by the size of Si NSs. The results indicate that optimization of the fluorescence spectra for maximizing the sensitivity of FRET-based biosensing/bioimaging devices is possible by using Mie resonances. PL decay measurements in combination with numerical calculations of the FRET rate enhancement factor and the Purcell enhancement factor revealed that the FRET rate enhancement factor is smaller than the Purcell enhancement factor. As a result, Mie resonances decrease the FRET efficiency of donor–acceptor FRET pairs.4 Experimental section
4.1 Preparation of the colloidal dispersion of Si NSs
Si NSs were prepared using a previously reported method40,41 that utilizes thermal disproportionation of silicon monoxide (SiO). SiO lumps (several mm in size) (99%, FUJIFILM Wako) were annealed at 1475 °C under an N2 gas atmosphere for 30 min to grow crystalline Si NSs in silica (SiO2) matrices. Si NSs were liberated by dissolving SiO2 matrices in HF solution (46 wt%) for 1 h. The HF was removed by centrifugation processes. Si NSs were transferred to methanol and subjected to sonication for 1 min with an ultrasonic homogenizer (Violamo SONICSTAR 85). Finally, Si NSs were transferred to ethanol by centrifugation processes.4.2 Preparation of Si@(FITC, RITC), Si@FITC and SiO2@FITC
100 μL of APTES (98 wt%, Tokyo Chemical Industry) and 200 μL of acetic acid (FUJIFILM Wako) were added to 1 mL of ethanol solution of Si NSs (2.2 mg mL−1) and the suspension was stirred (800 rpm) for 4 h at room temperature. NH2-functionalized Si NSs were washed 4 times to remove excess APTES. 200 μM FITC (FUJIFILM Wako) and 50 μM RITC (Cosmo Bio Co.) in ethanol were added into the suspension of NH2-functionalized Si NSs. After stirring (800 rpm) for 20 h at room temperature and washing 6 times to remove unreacted FITC and RITC, Si@(FITC, RITC) was obtained in ethanol. Si@FITC and SiO2@FITC were also synthesized using a similar procedure without RITC. SiO2 nanoparticles were prepared by the Stöber process.464.3 Optical spectroscopy
PL spectra of the colloidal suspensions of Si@FITC and Si@(FITC, RITC) were recorded using a spectrofluorometer (Fluorolog-3, HORIBA). The excitation wavelength was 480 nm. A custom-built inverted optical microscope was used for recording the scattering and PL spectra and PL decay curves of single Si@(FITC, RITC), Si@FITC, and SiO2@FITC. For the measurements, the diluted suspensions were dropped onto a SiO2 substrate and dried in air. For scattering measurements in a reflection configuration, a SiO2 substrate was placed facedown onto the stage and illuminated with a halogen lamp through a dark-field objective lens (100×, NA = 0.9). The scattered light was collected by the same objective lens and transferred to the entrance slit of a monochromator (Kymera 328i, Andor) and detected using a cooled CCD (Newton, Andor). PL was measured using the same setup. The excitation wavelength was 488 nm. For the measurement of PL decay curves, the emitted light was brought to another port of the same optical microscope and detected using a time-correlated single photon counting module (PicoQuant, TimeHarp200) with an avalanche photodiode (PD-100-CTE, MPD). The excitation wavelength was 480 nm (76 ps pulse width, 40 MHz repetition, 6.3 nm bandwidth). To detect only the donor (FITC) PL, a 525 nm band-pass filter (25 nm FWHM, Edmund Optics) was inserted in front of the detector. The average PL lifetime was obtained by fitting the measured decay curves with a double exponential function.4.4 Calculation of the scattering spectrum, electric field enhancement factor, radiative rate enhancement factor, and non-radiative rate enhancement factor
The scattering spectrum, electric field intensity enhancement factor, radiative rate enhancement factor, and non-radiative rate enhancement factor were analytically calculated using MATLAB codes based on Mie theory.47 We assumed that an emitter oriented perpendicular (⊥) or parallel (‖) to the surface of a Si NS was placed at 5 nm from the surface. The enhancement factor of a randomly oriented dipole (EF) was calculated from EF = 1/3EF⊥ + 2/3EF‖. The refractive index of Si was taken from the literature.484.5 Calculation of the FRET rate enhancement factor
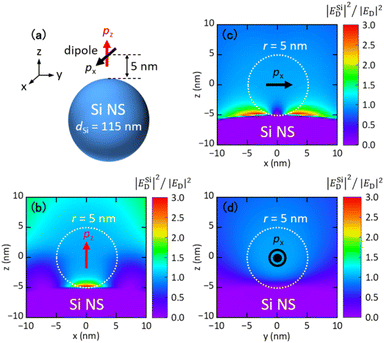
To calculate the FRET rate enhancement factor, commercial FDTD simulation software (Lumerical, Ansys) was used. An electric dipole source (donor) was placed at 5 nm from the surface of a Si NS. The orientation of the dipole was along the z-axis (pz) or x-axis (px). The mesh size was 0.25 nm. The refractive index of Si was taken from the literature.48Author contributions
Keisuke Ozawa: conceptualization (equal); data curation (equal); methodology (equal); writing – original draft (equal). Masato Adachi: data curation (supporting); methodology (supporting). Hiroshi Sugimoto: funding acquisition (equal); conceptualization (equal); investigation (equal); supervision (equal); writing – original draft (equal). Minoru Fujii: funding acquisition (equal); project administration (equal); writing – review and editing (equal).Conflicts of interest
There are no conflicts to declare.Acknowledgements
This work was supported by JSPS KAKENHI grant numbers, 22K18949, 18KK0141, 21H01748 and 21H01782 and the JST FOREST Program, grant number JPMJFR213L.References
- O. S. Wolfbeis, Chem. Soc. Rev., 2015, 44, 4743–4768 RSC.
- B. Hötzer, I. L. Medintz and N. Hildebrandt, Small, 2012, 8, 2297–2326 CrossRef PubMed.
- M. J. Ruedas-Rama, J. D. Walters, A. Orte and E. A. H. Hall, Anal. Chim. Acta, 2012, 751, 1–23 CrossRef CAS PubMed.
- J. Yao, M. Yang and Y. Duan, Chem. Rev., 2014, 114, 6130–6178 CrossRef CAS PubMed.
- M. Bauch, K. Toma, M. Toma, Q. Zhang and J. Dostalek, Plasmonics, 2014, 9, 781–799 CrossRef CAS PubMed.
- Y. Jeong, Y. M. Kook, K. Lee and W. G. Koh, Biosens. Bioelectron., 2018, 111, 102–116 CrossRef CAS PubMed.
- S. Pawar, A. Bhattacharya and A. Nag, ACS Omega, 2019, 4, 5983–5990 CrossRef CAS PubMed.
- S. Tu, D. Rioux, J. Perreault, D. Brouard and M. Meunier, J. Phys. Chem. C, 2017, 121, 8944–8951 CrossRef CAS.
- X. He, Z. Zhao, L. H. Xiong, P. F. Gao, C. Peng, R. S. Li, Y. Xiong, Z. Li, H. H. Y. Sung, I. D. Williams, R. T. K. Kwok, J. W. Y. Lam, C. Z. Huang, N. Ma and B. Z. Tang, J. Am. Chem. Soc., 2018, 140, 6904–6911 CrossRef CAS PubMed.
- J. H. Choi, J. Lim, M. Shin, S. H. Paek and J. W. Choi, Nano Lett., 2021, 21, 693–699 CrossRef CAS PubMed.
- J. Wang, Y. X. Liu, X. L. Li, H. Y. Chen and J. J. Xu, Anal. Chem., 2021, 93, 10317–10325 CrossRef CAS PubMed.
- N. Ibrayev, E. Seliverstova, N. Zhumabay and D. Temirbayeva, J. Lumin., 2019, 214, 116594 CrossRef CAS.
- S. Hou, Y. Chen, D. Lu, Q. Xiong, Y. Lim and H. Duan, Adv. Mater., 2020, 32, 1906475 CrossRef CAS PubMed.
- H. Li, Y. Zhao, Z. Chen and D. Xu, Biosens. Bioelectron., 2017, 87, 428–432 CrossRef CAS PubMed.
- K. V. Serebrennikova, A. V. Samokhvalov, A. V. Zherdev and B. B. Dzantiev, J. Food Compos. Anal., 2022, 114, 104806 CrossRef CAS.
- R. Collison, J. B. Pérez-Sánchez, M. Du, J. Trevino, J. Yuen-Zhou, S. O'Brien and V. M. Menon, ACS Photonics, 2021, 8, 2211–2219 CrossRef CAS.
- S. Bidault, A. Devilez, P. Ghenuche, B. Stout, N. Bonod and J. Wenger, ACS Photonics, 2016, 3, 895–903 CrossRef CAS.
- J. De Torres, M. Mivelle, S. B. Moparthi, H. Rigneault, N. F. Van Hulst, M. F. García-Parajó, E. Margeat and J. Wenger, Nano Lett., 2016, 16, 6222–6230 CrossRef CAS PubMed.
- A. O. Hamza, F. N. Viscomi, J. S. G. Bouillard and A. M. Adawi, J. Phys. Chem. Lett., 2021, 12, 1507–1513 CrossRef CAS PubMed.
- Y. Jeong and G. C. Schatz, J. Phys. Chem. C, 2020, 124, 20589–20597 CrossRef CAS.
- T. Forster, Naturwissenschaften, 1946, 33, 166–175 CrossRef CAS.
- B. R. Masters, Eur. Phys. J. H, 2014, 39, 87–139 CrossRef.
- G. A. Jones and D. S. Bradshaw, Front. Phys., 2019, 7, 100 CrossRef.
- L. Yuan, W. Lin, K. Zheng and S. Zhu, Acc. Chem. Res., 2013, 46, 1462–1473 CrossRef CAS PubMed.
- E. A. Jares-Erijman and T. M. Jovin, Nat. Biotechnol., 2003, 21, 1387–1395 CrossRef CAS PubMed.
- X. Zhang, Y. Hu, X. Yang, Y. Tang, S. Han, A. Kang, H. Deng, Y. Chi, D. Zhu and Y. Lu, Biosens. Bioelectron., 2019, 138, 111314 CrossRef CAS PubMed.
- M. Imani, N. Mohajeri, M. Rastegar and N. Zarghami, Anal. Biochem., 2021, 630, 114323 CrossRef CAS PubMed.
- C. L. Cortes and Z. Jacob, Opt. Express, 2018, 26, 19371–19387 CrossRef CAS PubMed.
- A. I. Kuznetsov, A. E. Miroshnichenko, M. L. Brongersma, Y. S. Kivshar and B. Luk'yanchuk, Science, 2016, 354, 2472 CrossRef PubMed.
- J. Fang, M. Wang, K. Yao, T. Zhang, A. Krasnok, T. Jiang, J. Choi, E. Kahn, B. A. Korgel, M. Terrones, X. Li, A. Alù and Y. Zheng, Adv. Mater., 2021, 33, 2007236 CrossRef CAS PubMed.
- A. I. Kuznetsov, A. E. Miroshnichenko, Y. H. Fu, J. Zhang and B. Luk'yanchuk, Sci. Rep., 2012, 2, 492 CrossRef PubMed.
- A. Vaskin, J. Bohn, K. E. Chong, T. Bucher, M. Zilk, D. Y. Choi, D. N. Neshev, Y. S. Kivshar, T. Pertsch and I. Staude, ACS Photonics, 2018, 5, 1359–1364 CrossRef CAS.
- M. L. Tseng, Y. Jahani, A. Leitis and H. Altug, ACS Photonics, 2021, 8, 47–60 CrossRef CAS.
- Y. Kivshar, Nano Lett., 2022, 22, 3513–3515 CrossRef CAS PubMed.
- H. Shinomiya, H. Sugimoto, T. Hinamoto, Y. J. Lee, M. L. Brongersma and M. Fujii, ACS Photonics, 2022, 9, 1741–1747 CrossRef CAS.
- M. Adachi, H. Sugimoto, Y. Nishimura, K. Morita, C. Ogino and M. Fujii, Small, 2023, 19, 2207318 CrossRef CAS PubMed.
- H. Kasai, H. Sugimoto and M. Fujii, Adv. Opt. Mater., 2023, 2301204 Search PubMed.
- L. Jauffred, A. Samadi, H. Klingberg, P. M. Bendix and L. B. Oddershede, Chem. Rev., 2019, 119, 8087–8130 CrossRef CAS PubMed.
- M. Caldarola, P. Albella, E. Cortés, M. Rahmani, T. Roschuk, G. Grinblat, R. F. Oulton, A. V. Bragas and S. A. Maier, Nat. Commun., 2015, 6, 7915 CrossRef CAS PubMed.
- H. Sugimoto and M. Fujii, Nanotechnology, 2021, 32, 452001 CrossRef CAS PubMed.
- H. Sugimoto, T. Okazaki and M. Fujii, Adv. Opt. Mater., 2020, 8, 2000033 CrossRef CAS.
- R. Ruppin, J. Chem. Phys., 1982, 76, 1681–1684 CrossRef CAS.
- M. K. Schmidt, R. Esteban, J. J. Sáenz, I. Suárez-Lacalle, S. Mackowski and J. Aizpurua, Opt. Express, 2012, 20, 18609 CrossRef.
- P. Bharadwaj and L. Novotny, Opt. Express, 2007, 15, 14266 CrossRef CAS PubMed.
- M. Ringler, A. Schwemer, M. Wunderlich, A. Nichtl, K. Kürzinger, T. A. Klar and J. Feldmann, Phys. Rev. Lett., 2008, 100, 203002 CrossRef CAS PubMed.
- S. L. Greasley, S. J. Page, S. Sirovica, S. Chen, R. A. Martin, A. Riveiro, J. V. Hanna, A. E. Porter and J. R. Jones, J. Colloid Interface Sci., 2016, 469, 213–223 CrossRef CAS PubMed.
- E. C. Le Ru and P. G. Etchegoin, Principles of Surface-Enhanced Raman Spectroscopy and Related Plasmonic Effects, Elsevier, Amsterdam., 2009 Search PubMed.
- G. E. Jellison, Opt. Mater., 1992, 1, 151–160 CrossRef CAS.
Footnote |
| † Electronic supplementary information (ESI) available. See DOI: https://doi.org/10.1039/d3nr06290b |
| This journal is © The Royal Society of Chemistry 2024 |

