 Open Access Article
Machine-learning-guided quantitative delineation of cell morphological features and responses to nanomaterials†
Kenry
 abc
abc
aDepartment of Pharmacology and Toxicology, R. Ken Coit College of Pharmacy, University of Arizona, Tucson, AZ 85721, USA. E-mail: kenry@arizona.edu
bUniversity of Arizona Cancer Center, University of Arizona, Tucson, AZ 85721, USA
cBIO5 Institute, University of Arizona, Tucson, AZ 85721, USA
First published on 7th October 2024
Abstract
Delineation of cell morphological features is essential to decipher cell responses to external stimuli like theranostic nanomaterials. Conventional methods rely on labeled approaches, such as fluorescence imaging and flow cytometry, to assess cell responses. Besides potentially perturbing cell structure and morphology, these approaches are relatively complex, time-consuming, expensive, and may not be compatible with downstream analysis involving live cells. Herein, leveraging label-free phase-contrast or brightfield microscopy imaging and machine learning, the delineation of different cell types, phenotypes, and states for monitoring live cell responses is reported. Notably, pixel classification based on a supervised random forest classifier is used to distinguish between cells and backgrounds from the microscopy images, followed by cell segmentation and morphological feature extraction. Quantitative analysis shows that most of the compared cell groups have distinguishable size and shape features. Principal component analysis and unsupervised k-means clustering of morphological features reveal the possible existence of heterogenous cell subpopulations and treatment responses among the seemingly homogenous cell groups. This shows the merit of the reported approach in complementing conventional techniques for cell analysis. It is anticipated that the demonstrated method will further aid the implementation of machine learning to streamline the analysis of cell morphology and responses for early disease diagnosis and treatment response monitoring.
1. Introduction
Discrimination of cell types, phenotypes, and states (e.g., healthy vs. diseased cells) is important for assessing cell responses to external stimuli, such as bacterial invasions, viral infections, and nanotherapeutic treatments.1–5 For example, an ability to distinguish diseased cells from their healthy counterparts is useful for evaluating disease progression or treatment efficacy.6–10 To date, to examine cell responses and activities, conventional strategies rely predominantly on labeled approaches, notably flow cytometry and fluorescence microscopy imaging, to monitor biomarker expression and cell morphology, respectively.11–18 These methods require elaborate sample preparation and are time-consuming and costly. The use of these techniques may also introduce substantial disruptions to cell structure, morphology, and functions, which may compromise the accuracy and reproducibility of subsequent analysis. Furthermore, some of the labeled approaches may require cell fixation,19–21 which may then render these methods incompatible with downstream analysis involving live cells. As such, there is a need for simpler and more cost-effective strategies capable of label-free visualization of cell states and responses with minimal cell manipulation. To this end, various label-free techniques, such as scanning probe microscopy imaging, Raman spectroscopy imaging, and electrochemical sensing, have been developed in recent years to characterize cell responses.22–27 Unfortunately, many of these techniques suffer from one or a combination of shortcomings, such as unintended cell perturbation, limited spatial information, and relatively low throughput.28–30To streamline the interrogation of cell responses, increasing efforts have been focused on the development and use of computational approaches, notably machine learning.31–34 Machine learning, in general, leverages a range of mathematical algorithms and models to facilitate computers to learn and augment their performance in tasks, including image recognition, object classification, and feature prediction, over time without being programmed specifically to do so.35–40 With its automated and higher throughput characteristics, machine learning can significantly reduce manual trial-and-error processes along with their associated shortcomings, particularly in cell screening, identification, and classification. Consequently, this computational technique has been increasingly combined with established labeled and label-free techniques to enable more rapid and reliable analysis of cell states and responses.41–46
Herein, by integrating phase-contrast or brightfield microscopy imaging with machine learning, a label-free, high-throughput, and quantitative approach to delineate cell types, phenotypes, states, and responses based on differences in cell morphological features is reported. Through the demonstrated computational pipeline, cells of interest and backgrounds were accurately classified from either phase-contrast or brightfield microscopy images using a supervised random forest classifier, followed by cell segmentation and feature extraction. Size and shape features essential for distinguishing between different cell groups were then identified, and unsupervised clustering was employed to reveal possible cell subpopulations from the seemingly homogenous cell groups. Altogether, this reported approach is foreseen to further stimulate the implementation of machine learning to complement existing methods to improve the throughput and reliability of cell state and response analysis for disease diagnosis and treatment response evaluation.
2. Results and discussion
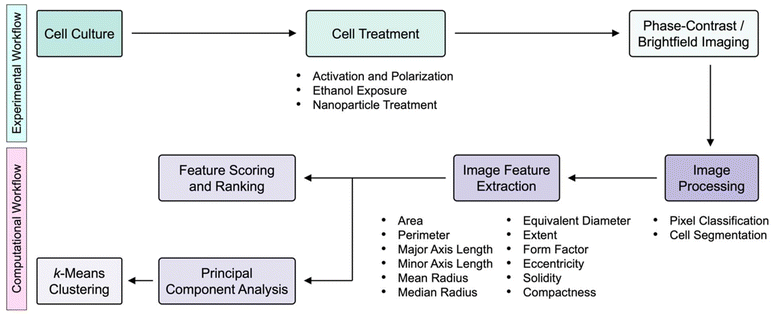
The experimental and computational workflows of this study are illustrated in Fig. 1. To start with, cells of interest were imaged using either phase-contrast or brightfield microscopy. The acquired microscopy images were then processed through user-annotated pixel classification to generate image probability maps. Next, these maps were converted into their corresponding image masks containing segmented cells, from which the cell morphological features were extracted. The different morphological features were scored and ranked quantitatively to determine the importance of certain cell morphological attributes in distinguishing specific cell groups. In parallel, principal component analysis (PCA) was employed to transform the high-dimensional datasets into their low-dimensional counterparts, followed by unsupervised clustering to identify different cell subpopulations from specific cell groups to further elucidate the heterogeneity of cell morphology and responses.2.1. Delineation of macrophages and epithelial cells
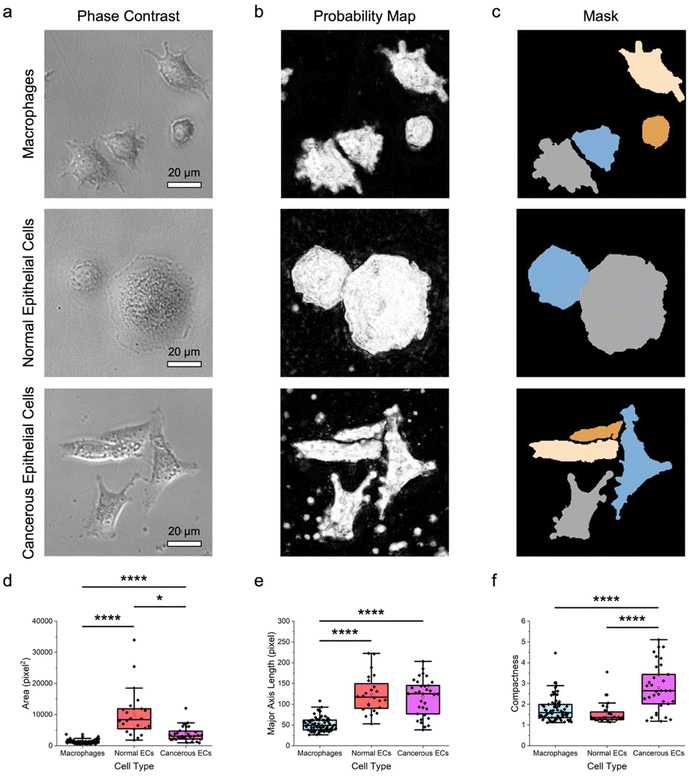
To assess the feasibility of an approach combining label-free microscopy imaging and machine learning in delineating different cell types, the morphological features of macrophages and both normal and cancerous breast epithelial cells were obtained and characterized quantitatively (Fig. 2). Here, RAW 264.7 macrophages, MCF-10A normal breast epithelial cells, and MDA-MB-231 cancerous breast epithelial cells were used as these cells possess unique morphology, which would facilitate their differentiation from each other. Indeed, the acquired phase-contrast microscopy images showed that RAW 264.7, MCF-10A, and MDA-MB-231 cells have distinct size and shape (Fig. 2a). Notably, RAW 264.7 macrophages appeared to be smaller than MCF-10A normal and MDA-MB-231 cancerous breast epithelial cells. In addition, RAW 264.7 macrophages had irregular boundary and shape, where some of them had a slightly elongated shape, while the rest had a more circular shape. MCF-10A cells, on the other hand, had a predominantly round shape with less discernible protrusions. In contrast to RAW 264.7 macrophages and MCF-10A cells, MDA-MB-231 cells displayed a highly spindle-like or an irregular shape with visible protrusions.Next, using pixel classification based on a supervised random forest classifier, the phase-contrast microscopy images were processed to produce the corresponding probability maps (Fig. 2b). Through iterative supervised annotations, the maps were generated such that they consisted of probable regions of two classes, notably cells of interest and backgrounds. The obtained probability maps were subsequently processed to yield image masks containing segmented individual cells (Fig. 2c), which were used to extract cell shape and size features. It is important to highlight that, to date, segmentation of cells from label-free phase-contrast or brightfield microscopy images, rather than fluorescence microscopy images, remains a nontrivial challenge. Unfortunately, most of the conventional cell segmentation methods, particularly those relying on intensity thresholding, contrast filters, and watershed algorithms, have not been able to segment cells from phase-contrast microscopy images with sufficient accuracy due to numerous characteristics associated with these microscopy images, including shade-off effect, halo artifacts, and illumination patterns. Interestingly, by assigning labels to pixels based on their intensity and features, the pixel classification approach adopted in this work could augment the segmentation accuracy considerably, which would have otherwise been challenging to realize.
Quantitative analysis of the derived cell morphological features revealed that the different cell types could be distinguished from each other with relative ease (Fig. 2d–f; Fig. S1 ESI†). Specifically, quantitative assessments of the size features, including area, perimeter, major and minor axis lengths, mean radius, median radius, and equivalent diameter showed that the median values of those of normal epithelial cells were at least two to three times higher than those of macrophages (p < 0.0001) (Fig. 2d, e; Fig. S1 ESI†). This trend was also largely observed for comparison between MCF-10A and MDA-MD-231 cells, although there was no statistically significant difference in their perimeters and major axis lengths. Quantitative evaluations of the shape parameters of the cells, including form factor, eccentricity, solidity, and compactness, confirmed the qualitative morphological observations of the differences between macrophages and breast epithelial cells. Form factor analysis illustrated that the cancerous epithelial cells had a lower median form factor value than the normal epithelial cells (p < 0.0001) and macrophages (p < 0.0001) (Fig. S1 ESI†). This suggests that MDA-MB-231 cells had a higher shape irregularity than MCF-10A and RAW 264.7 cells. Assessment of cellular eccentricity, which is the ratio of the minor axis length to the major axis length, or otherwise known as ellipticity, showed that the median eccentricity value of MDA-MB-231 cells, which was close to 1.0, was significantly higher than those of MCF-10A cells (p < 0.0001) and RAW 264.7 macrophages (p < 0.001) (Fig. S1 ESI†). This verified the predominantly spindle-like shape of the cancerous epithelial cells. Separately, RAW 264.7 macrophages had a much wider eccentricity distribution and a significantly higher median eccentricity value than MCF-10A cells (p < 0.05), indicating a larger shape variation of macrophages. The more irregular shape of RAW 264.7 macrophages was also reflected from quantitative evaluation of cellular solidity, which is a measure of cell density. In fact, macrophages had a wide solidity distribution with a median cellular solidity of slightly above 0.85, while the median solidity of MCF-10A cells was close to 1.0, suggesting that the normal epithelial cells were more solid and had an almost circular boundary (Fig. S1 ESI†). Quantitative analysis of the solidity of MDA-MB-231 cells revealed that the cancerous epithelial cells had a wide solidity distribution and a median solidity value which was lower than those of normal epithelial cells (p < 0.0001) and macrophages (p < 0.01). This further confirmed the elongated shape and irregular boundary of MDA-MB-231 cells. Compactness, which is the ratio of cell area to the area of a circle with the same perimeter, can also be used to examine cell shape. A complex and irregular cell boundary is typically reflected by a higher compactness, which is that displayed by MDA-MB-231 cells (Fig. 2f). Again, the higher median value (p < 0.0001) and wider distribution of the compactness of the cancerous epithelial cells suggests their highly irregular shape.
2.2. Delineation of macrophages of different phenotypes
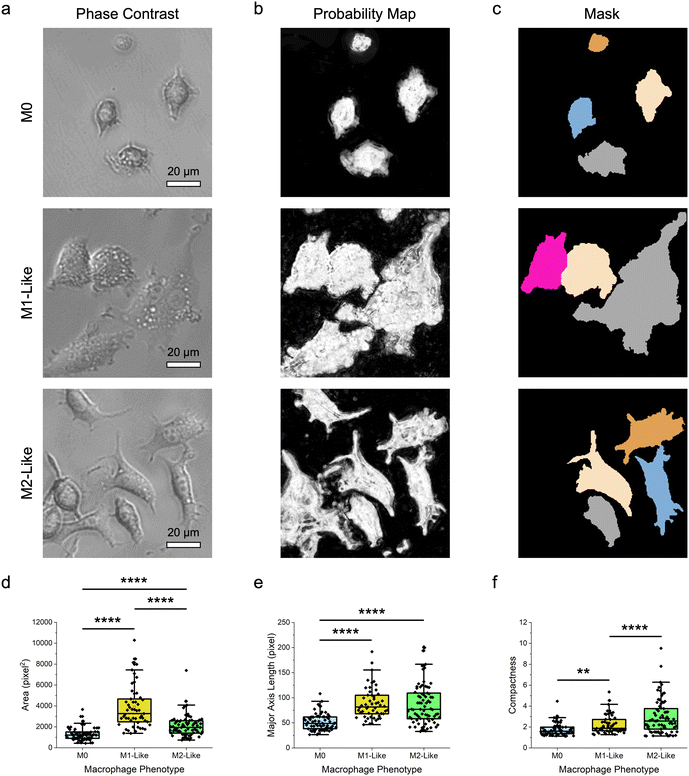
After delineation of different cell types, the same approach was leveraged to discriminate cells with more similar morphological features, particularly macrophages of different phenotypes. Specifically, the demonstrated method was used to distinguish the polarized M1- and M2-like macrophages from their naïve M0 counterpart (Fig. 3). Herein, M1-like macrophage phenotype was obtained by treating the naïve RAW 264.7 macrophages with lipopolysaccharide (LPS) and interferon gamma (IFN-γ) cytokine cocktail over 24 h.47 Separately, M2-like phenotype was acquired by treating the naïve macrophages with interleukin-4 (IL-4) and IL-10 cytokine cocktail. The morphology as well as the pro-inflammatory and anti-inflammatory biomarkers produced by the different macrophage phenotypes were then verified, as described in this author's previous study,47 to ensure that the naïve macrophages were successfully polarized. Qualitative observations of the obtained phase-contrast microscopy images revealed that the difference in the morphological features of these macrophage phenotypes was relatively smaller as compared to that between macrophages and epithelial cells (Fig. 3a). Specifically, while M1-like macrophages appeared to have a bigger size than their naïve counterpart, the size of M2-like macrophages was fairly similar to that of M0 macrophages. In addition, like the naïve macrophages, M1-like macrophages displayed a highly irregular shape. M2-like macrophages, on the other hand, had a predominantly spindle-like shape. Next, through pixel classification (Fig. 3b) coupled with cell segmentation (Fig. 3c) and feature extraction, quantitative assessments of the size and shape features of the different macrophage phenotypes were performed (Fig. 3d–f; Fig. S2 ESI†).Quantitative examinations of the numerous size features of macrophage phenotypes, notably their area, perimeter, major and minor axis lengths, mean and median radius, and equivalent diameter, showed that the median values of those of M1-like phenotype were consistently higher than those of M0 macrophages (p < 0.0001) (Fig. 3d, e; Fig. S2 ESI†). Comparisons between the size features of M1-like and M2-like macrophages revealed a similar trend, particularly for area, minor axis length, mean and median radius, and equivalent diameter (p < 0.0001). This suggests that M1-like macrophages were substantially larger than both M2-like and M0 macrophages, verifying the qualitative observations from phase-contrast microscopy images. The median values of area, perimeter, major axis length, and equivalent diameter of M2-like macrophages were higher than those of M0 macrophages (p < 0.0001), while the values of the remaining size features were similar for these macrophage phenotypes, indicating that M2-like macrophages were slightly bigger than the naïve macrophages. Analyzing shape parameters like form factor, eccentricity, solidity, and compactness quantitatively provided further insights into the morphology of the different macrophage phenotypes. All macrophages had broad distributions of form factor and eccentricity, which are indicative of their high shape variations (Fig. S2 ESI†). In particular, both measurements showed that among the macrophage phenotypes, M2-like macrophages had the most elongated shape, followed by M1-like and M0 macrophages. In addition, compactness and solidity examinations revealed that M2-like macrophages had the broadest distribution of these two shape features, illustrating the highly irregular and complex shape of this macrophage phenotype (Fig. 3f and Fig. S2 ESI†). M0 macrophages, on the other hand, had a higher median solidity value than M2-like macrophages (p < 0.0001), but a lower median value and a narrower distribution of compactness than M1-like macrophages (p < 0.01). These collectively indicate that, among all macrophage phenotypes, the naïve macrophages possessed the highest density and shape regularity.
2.3. Delineation of macrophage responses to external stimuli
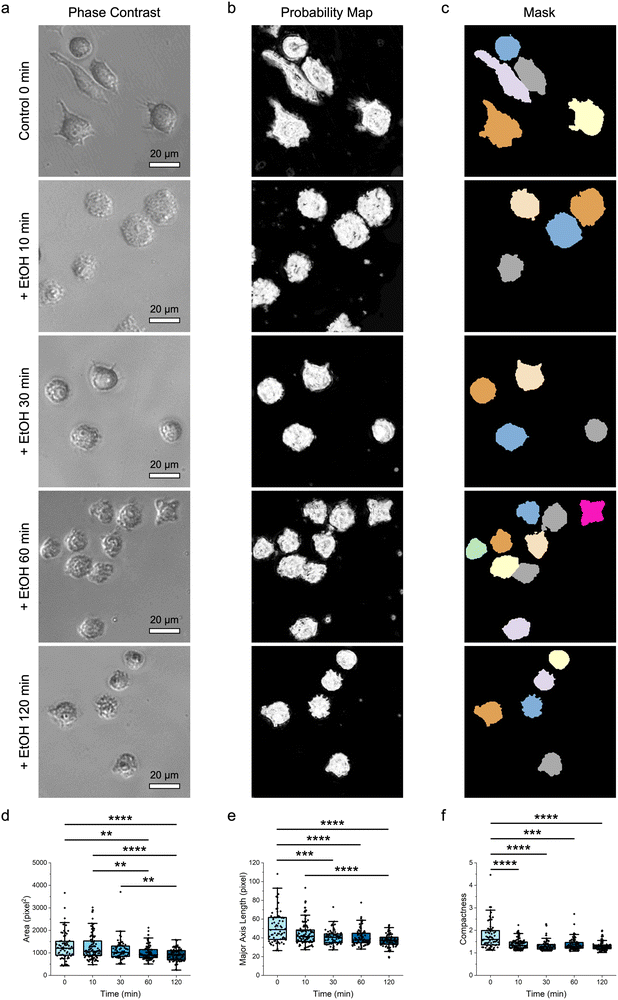
After establishing the capacity of the label-free machine-learning-guided strategy to differentiate multiple cell types and phenotypes, the demonstrated approach was extended to distinguish cell responses and states, particularly cell viability (Fig. 4). Here, the naïve RAW 264.7 macrophages were first treated with ethanol over time (i.e., 10, 30, 60, and 120 min) and their morphological changes were monitored using phase-contrast microscopy (Fig. 4a). At the same time, the viability of these macrophages was characterized using the (3-(4,5-dimethylthiazol-2-yl)-2,5-diphenyltetrazolium bromide) tetrazolium (MTT) colorimetric assay (Fig. S3 ESI†).Interestingly, phase-contrast microscopy imaging revealed substantial changes in the shape and size of macrophages after their exposure to ethanol. As early as 10 min after an ethanol treatment, most macrophages assumed a less irregular shape with less visible protrusions. As the exposure time increased from 10 min to 120 min, these protrusions gradually disappeared, and all macrophages displayed a more circular boundary. Changes in the shape of macrophages were accompanied by a gradual shrinkage in their overall size, indicating a loss of structural integrity. After qualitative analysis of the macrophage shape and size from the phase-contrast microscopy images, different probability maps (Fig. 4b) and image masks (Fig. 4c) were next acquired for quantitative assessments (Fig. 4d–f; Fig. S4 ESI†). Quantitative analysis of different size parameters, particularly area, perimeter, major axis length, and equivalent diameter, verified the observed shrinkage of the size of macrophages with an increase in ethanol treatment time (Fig. 4d, e; Fig. S4 ESI†). At the same time, quantitative analysis of various shape parameters confirmed that, as the ethanol exposure duration increased, macrophages gradually assumed more rounded and denser shape with less irregular boundary (Fig. 4f; Fig. S4 ESI†).
It is noteworthy that, while conventional colorimetric assays can reveal changes in the responses of cells after an exposure to external stimuli, these assays may not be sufficiently sensitive to elucidate fine variations in cell responses. In fact, although the MTT colorimetric assay employed in this study revealed a decrease in macrophage viability after an ethanol treatment, this viability reduction reached a plateau after 30 min (Fig. S3 ESI†). However, as observed and quantified through the machine-learning-guided approach demonstrated in this study, macrophages still experienced continuous morphological changes after 30 min of ethanol treatment. Indeed, this suggests that the standard colorimetric assay might lack the sensitivity to detect fine variations in macrophage responses. Furthermore, as the extent of morphological changes corresponded largely to the duration of ethanol treatment, the morphological features of macrophages could be potentially employed as biomarkers to assess macrophage responses.
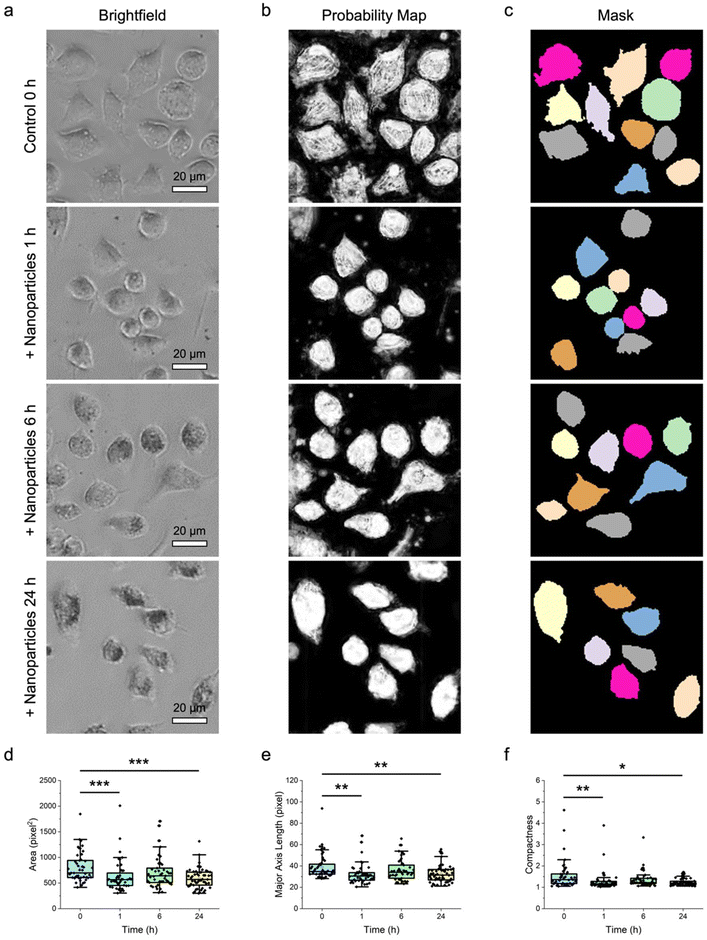
Next, using a similar approach, the endocytic activity of macrophages along with any changes in their morphological features was assessed. The endocytosis of inorganic metallic nanomaterials, such as gold (Au) nanoparticles, has been reported to potentially induce certain stresses to cells,48,49 which may then lead to alterations to their morphological features. In a recent work, it was demonstrated that the uptake of Au nanoparticles at certain concentrations did not induce any significant cytotoxicity to macrophages over 24 h.47 Nonetheless, it was still unclear if any changes to the morphological features of the treated cells would be triggered. As such, in this part of the study, the effect of Au nanoparticle uptake on the size and shape features of macrophages was probed (Fig. 5). Here, the naïve RAW 264.7 macrophages were treated with Au nanoparticles at a concentration of 0.05 nM over time (i.e., 1, 6, and 24 h) and then imaged with brightfield microscopy (Fig. 5a). Brightfield microscopy imaging showed that the nanoparticles could be taken up well by the macrophages over 24 h, based on the gradual formation of darker spots within the cells, especially in the cytoplasm. Intriguingly, the nanoparticle-treated macrophages appeared to experience certain changes to their shape and size.
To verify qualitative observations, the corresponding probability maps (Fig. 5b) and image masks (Fig. 5c) were generated for subsequent quantitative analysis (Fig. 5d–f; Fig. S5 ESI†). Examinations of size features, especially area, perimeter, major and minor axis lengths, and equivalent diameter elucidated that both the macrophages treated with nanoparticles for 1 and 24 h experienced significant variations in these features (p < 0.01) (Fig. 5d, e and Fig. S5 ESI†). Evaluation of other size features like median radius showed no significant difference between the control untreated and nanoparticle-treated macrophages (Fig. S5 ESI†). A closer look at the shape features, notably compactness and form factor, revealed that these two attributes of macrophages treated with nanoparticles for 1 and 24 h changed substantially (p < 0.05), while other shape features like eccentricity, solidity, and extent were negligibly altered across all nanoparticle-treated macrophages (Fig. 5f and Fig. S5 ESI†). Altogether, in light of the obtained data, it appears that the endocytosis of Au nanoparticles by macrophages did elicit certain morphological feature alterations over 24 h.
2.4. Feature scoring and ranking and identification of macrophage subpopulations
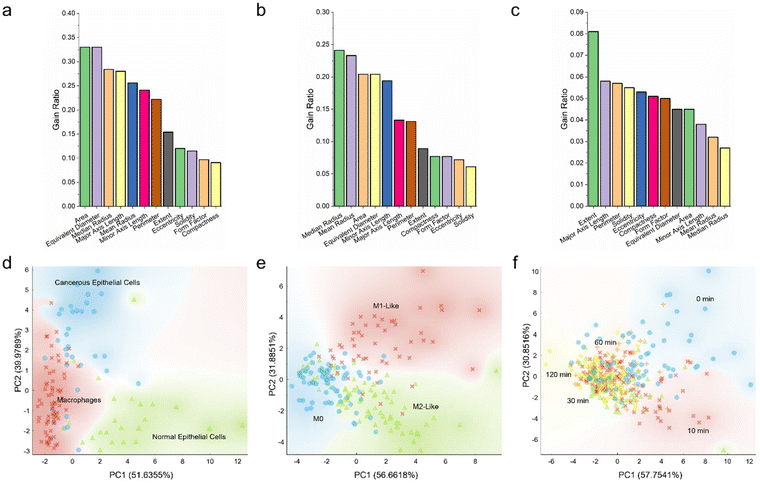
As depicted in this study, so far, different cell types, phenotypes, and responses could be distinguished through various cell size and shape features, such as area, perimeter, equivalent diameter, eccentricity, solidity, and so on. Nevertheless, it remained unclear if all morphological parameters held equal importance and if a smaller number of parameters could be used to delineate the cells more effectively. To this end, the 12 morphological features explored in this work were quantitatively scored and ranked, and PCA was performed to transform the high-dimensional datasets into their low-dimensional counterparts (Fig. 6).Herein, all morphological features were quantitatively analyzed based on gain ratio and Gini index (Fig. 6a–c; Fig. S6 ESI†). Analysis of the size and shape features of macrophages, normal breast epithelial cells, and cancerous breast epithelial cells revealed that, with a gain ratio of 0.33, area and equivalent diameter were the top two distinguishing features correlating to these three cell types (Fig. 6a). Compactness and form factor, on the other hand, were the least important distinguishing features having a low gain ratio of 0.091 and 0.097, respectively. Analysis of the morphological variables of different macrophage phenotypes revealed that median radius was the most important distinguishing variable, with a high gain ratio of 0.241 (Fig. 6b). This was followed by mean radius, area, equivalent diameter, and minor axis length. Solidity with a low gain ratio of 0.061, in contrast, was the least significant variable correlating to the macrophage phenotypes. It is intriguing to note that the top five distinguishing variables of the group of macrophages and epithelial cells and the group of macrophage phenotypes were the same, albeit in a slightly different order of importance. Nevertheless, analysis of the morphological variables of the ethanol-treated macrophages revealed a different trend. With a gain ratio of 0.081, extent ranked the highest among all morphological variables (Fig. 6c). This was followed by major axis length, perimeter, solidity, and eccentricity. Mean radius and median radius were the two least important variables, with gain ratios of 0.032 and 0.027, respectively. Separately, scoring and ranking of the morphological variables based on Gini index showed a trend closely similar to that obtained using gain ratio (Fig. S6 ESI†). Altogether, it appeared that different cell types and phenotypes could be distinguished predominantly through size variables, while variations in cell responses could be largely delineated using shape variables.
Next, to assess if low-dimensional variables could be used to describe the differences between cell types, phenotypes, and responses, data transformation from the parameter space to the principal component space through PCA was carried out. For all cell groups, two principal components accounting for more than 85% variance in the datasets were selected. The normal epithelial cells could be generally clustered into a distinct group, although there was a slightly noticeable overlap between the macrophage and cancerous epithelial cell clusters (Fig. 6d). Similarly, for the macrophage phenotype groups, while M1-like macrophages could be grouped into a distinct cluster, there was an evident overlap between the M0 and M2-like macrophage clusters (Fig. 6e). Analysis of the ethanol-treated macrophages in the principal component space revealed a similar trend, where both control untreated macrophages and those treated with ethanol for 10 min could be clustered into two distinct groups, while the three clusters of macrophages treated with ethanol for 30, 60, and 120 min overlapped substantially (Fig. 6f). All these suggest that there might be similar and overlapping morphological variables between the different macrophage populations and that heterogenous macrophage subpopulations might exist within individual macrophage groups.
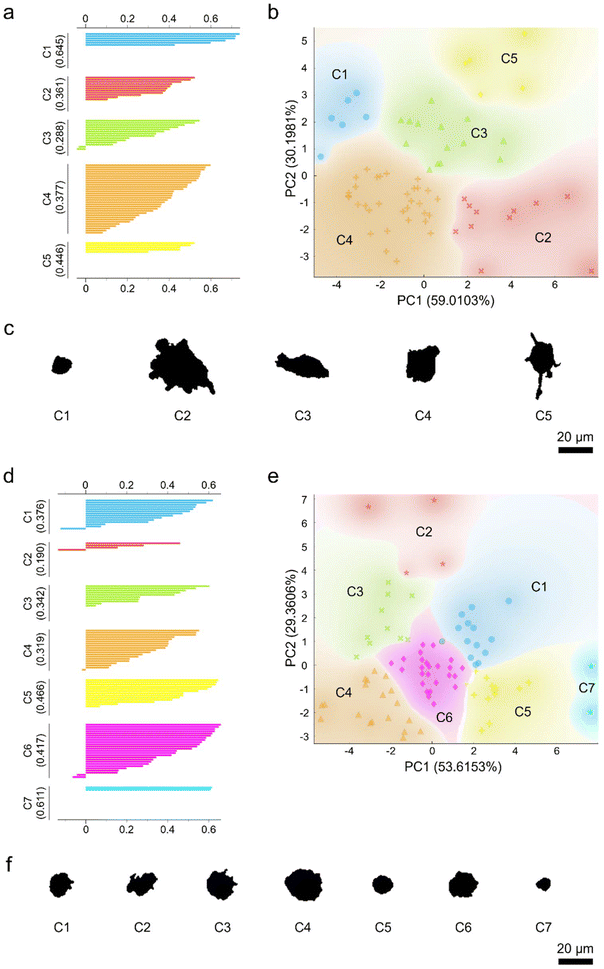
To examine the heterogeneity of the morphology and responses of the seemingly homogenous macrophage populations, PCA coupled with unsupervised k-means clustering was performed (Fig. 7). As a proof-of-principle, the different macrophage phenotypes and ethanol-exposed macrophages were included for further analysis. Again, two principal components accounting for more than 80% variance were selected and the high-dimensional datasets were transformed from the parameter space to the principal component space. The transformed datasets were then subjected to unsupervised k-means clustering to yield distinct macrophage clusters. The number of clusters was determined based on the highest silhouette scores. Unsupervised k-means clustering of M1- and M2-like macrophages generated five and three clusters, respectively (Fig. S7 ESI†). Similarly, subjecting the ethanol-treated macrophage groups to k-means clustering yielded several distinct macrophage subpopulations. In particular, k-means clustering produced five non-overlapping subpopulations of the control untreated macrophages (Fig. 7a–c), while the macrophages treated with ethanol for 120 min were clustered into seven non-overlapping subpopulations (Fig. 7d–f). Both silhouette and scattering plots revealed that the clustered macrophage subpopulations were not equal in size. Analysis of the representative morphological patterns of the clustered macrophage groups revealed their unique shape and size features (Fig. 7c and f). Collectively, these results indicate that, indeed, macrophages appeared to be a highly heterogenous group of cells in terms of their morphology and responses.
3. Conclusion
Herein, the integrated use of phase-contrast or brightfield microscopy imaging with machine learning to realize a label-free quantitative delineation of cell types, phenotypes, and responses to external stimuli was demonstrated. Pixel classification based on a supervised random forest classifier was employed to distinguish cells of interest from backgrounds from phase-contrast or brightfield microscopy images, producing probability maps consisting of probable regions of cells and backgrounds. These maps were then used to generate image masks containing segmented cells, from which their morphological features were derived. Quantitative analysis of numerous cell morphological features revealed that most of the compared cell groups had distinct characteristics. For example, macrophages could be distinguished from normal breast epithelial cells based on cell area, minor and major axis lengths, radius, and so on. Most of the same features could also be used to distinguish macrophage phenotypes, notably the naïve M0, pro-inflammatory M1-like, and anti-inflammatory M2-like macrophages, as well as macrophage responses to external stimuli. Specifically, the demonstrated method could delineate fine changes in the morphology of the ethanol-exposed macrophages with decreasing viability. This suggests a strong relationship between changes in the morphological features of cells and their viability, and that cell morphology may be leveraged as a potential biomarker of cell responses. In fact, the approach reported in this study has the capacity to complement the commonly used assays in assessing cell viability. Furthermore, even for macrophages experiencing minimal changes in viability, notably the nanoparticle-treated macrophages, the reported method could still uncover substantial variations in the size and shape attributes of these cells. Intriguingly, feature scoring and ranking elucidated that not all morphological features held equal importance in delineating different cell groups. For instance, size variables ranked higher as distinguishing features correlating to different cell types and phenotypes, while shape variables appeared to have a higher importance in describing changes in cell responses. Further analysis of the individual cell populations using PCA and unsupervised k-means clustering revealed that the seemingly homogenous cell groups might consist of numerous distinct cell subpopulations, suggesting their heterogenous morphology and responses.It is noteworthy that, while useful observations may be inferred directly from the microscopy images, these qualitative information may be subjective and suffer from intra- and interobserver variations. In contrast, quantitative insights afforded by the method demonstrated in this work can enable more objective and reliable evaluations of cell morphological features. Altogether, it is foreseen that the demonstrated strategy can further encourage the implementation of machine learning to improve the assessment of cell morphology and states for biomedical and healthcare applications, including early diagnosis of diseases and monitoring of treatment responses.
4. Methods
Cell cultures
Three distinct cell lines, notably RAW 264.7 macrophages, MCF-10A normal breast epithelial cells, and MDA-MB-231 cancerous breast epithelial cells, were purchased from American Type Culture Collection (ATCC), and cultured in T75 flasks in Dulbecco's modified Eagle's medium (Corning Inc., USA) supplemented with 10% fetal bovine serum (Gibco, Thermo Fisher Scientific Inc., USA) and 1% antibiotic–antimycotic (Gibco, Thermo Fisher Scientific Inc., USA). These cells were maintained in a 37 °C incubator supplemented with 5% CO2. They were then plated in 96-well plates (Falcon, Corning Inc., USA) at a density of 10![[thin space (1/6-em)]](https://www.rsc.org/images/entities/char_2009.gif) 000 cells per 100 µL and grown overnight for subsequent studies.
000 cells per 100 µL and grown overnight for subsequent studies.
Macrophage polarization
The naïve RAW 264.7 macrophages were polarized into their pro-inflammatory M1-like and anti-inflammatory M2-like phenotypes using specialized cytokine cocktails, as described in this author's previous study.47 In particular, M1-like phenotypes were obtained after treating the naïve macrophages with 1 μg mL−1 LPS (MilliporeSigma, USA) and 50 ng mL−1 IFN-γ (StemCell Technologies Inc., Canada) cocktail for 24 h. M2-like phenotypes, in contrast, were acquired after treating the naïve macrophages with 50 ng mL−1 IL-4 (StemCell Technologies Inc., Canada) and 50 ng mL−1 IL-10 (StemCell Technologies Inc., Canada) cocktail for 24 h.Phase-contrast and brightfield microscopy imaging, image processing, and feature extraction
All cells, unless stated otherwise, were imaged using phase-contrast microscopy (Nikon Eclipse Ti-S, Nikon Instruments Inc., USA). Macrophages treated with Au nanoparticles were imaged using brightfield microscopy (Olympus CKX41, Olympus Corp., Japan). All obtained microscopy images were first processed through user-annotated pixel classification using ilastik 1.4.0 (The ilastik Developers)50 to generate the image probability maps. Briefly, after a raw image was loaded, a total of 37 features describing color/intensity, edge, and texture information were selected. Next, in the training stage, two distinct classes, notably cells and backgrounds, were assigned. A supervised random forest classifier was trained by manually labeling the pixels corresponding to the cells and backgrounds iteratively. Simultaneously, the predicted output classes on the unlabeled parts of an image were visualized and validated through live update. To further tune the prediction accuracy, additional labels were added accordingly to the regions where the predictions were less accurate. Following this, the predicted outputs were exported as probability maps, which describe the probabilities of pixels belonging to specific classes. The image probability maps were next converted to image masks containing segmented cells using CellProfiler 4.2.1 (Broad Institute of MIT and Harvard, USA).51 Briefly, cells were identified as the primary objects. Objects with diameters outside of the specified ranges and those touching the borders of an image were not considered. A global thresholding strategy, Otsu thresholding method, and two-class thresholding were selected. Either object shape or intensity was used as a metric to distinguish clumped or overlapping objects. After cell segmentation, a total of 12 specific cell size and shape features were obtained and measured, including cell area, perimeter, major axis length, minor axis length, mean radius, median radius, equivalent diameter, extent, form factor, eccentricity, solidity, and compactness.Feature scoring and ranking, principal component analysis, and k-means clustering
The feature scoring and ranking, PCA, and unsupervised k-means clustering were performed using Orange Data Mining software (University of Ljubljana, Slovenia). Information gain ratio and Gini index were selected as the feature scoring methods. For all PCA, two principal components were selected to achieve explained variance of higher than 80%. For unsupervised k-means clustering, the number of clusters was considered from two to eight and decided based on the highest silhouette score. The re-runs and maximum iterations were set at 10 and 300, respectively. All silhouette plots were generated based on Euclidean distance.Ethanol exposure and cell viability assay
RAW 264.7 macrophages cultured in 96-well plates were exposed to 10% ethanol for different duration (i.e., 10, 30, 60, and 120 min) and imaged using phase-contrast microscopy at each time point. Their viability was characterized using the MTT assay (MilliporeSigma, USA) based on the protocol depicted in this author's previous studies.24,47Nanomaterial treatment
Au nanoparticles were prepared and characterized, as described in this author's previous studies.47,52 RAW 264.7 macrophages cultured in 96-well plates were then treated with Au nanoparticles diluted in culture medium to a concentration of 0.05 nM. The cellular uptake of Au nanoparticles by the macrophages was next imaged with brightfield microscopy over time (i.e., 1, 6, and 24 h).Statistical analysis
Quantitative data were analyzed statistically using GraphPad Prism 10.1 (GraphPad Software Inc., USA). All data were initially subjected to Shapiro–Wilk test for normality. Brown-Forsythe and Welch ANOVA test coupled with Dunnett's T3 multiple comparisons test were employed to analyze parametric data. On the other hand, nonparametric data were analyzed using Kruskal–Wallis test coupled with Dunn's multiple comparisons test. * p < 0.05, ** p < 0.01, *** p < 0.001, and **** p < 0.0001 indicate statistically significant difference.Data availability
The data supporting this article have been included as part of the ESI.†Conflicts of interest
There are no conflicts of interest to declare.Acknowledgements
Kenry would like to acknowledge the supports of Dana-Farber Cancer Institute and his departmental start-up fund from the Department of Pharmacology and Toxicology, R. Ken Coit College of Pharmacy, University of Arizona.References
- D. Toomre and J. Bewersdorf, Annu. Rev. Cell Dev. Biol., 2010, 26, 285–314 CrossRef CAS.
- C. Trapnell, Genome Res., 2015, 25, 1491–1498 CrossRef CAS PubMed.
- L. Jiang and I. K. H. Poon, Apoptosis, 2019, 24, 208–220 CrossRef CAS PubMed.
- N. Toepfner, C. Herold, O. Otto, P. Rosendahl, A. Jacobi, M. Kräter, J. Stächele, L. Menschner, M. Herbig, L. Ciuffreda, L. Ranford-Cartwright, M. Grzybek, Ü. Coskun, E. Reithuber, G. Garriss, P. Mellroth, B. Henriques-Normark, N. Tregay, M. Suttorp, M. Bornhäuser, E. R. Chilvers, R. Berner and J. Guck, eLife, 2018, 7, e29213 CrossRef.
- W. Wang, D. Douglas, J. Zhang, S. Kumari, M. S. Enuameh, Y. Dai, C. T. Wallace, S. C. Watkins, W. Shu and J. Xing, Sci. Adv., 2020, 6, eaba9319 CrossRef CAS PubMed.
- T. M. Clay, A. C. Hobeika, P. J. Mosca, H. K. Lyerly and M. A. Morse, Clin. Cancer Res., 2001, 7, 1127–1135 CAS.
- A. Bajaj, O. R. Miranda, I.-B. Kim, R. L. Phillips, D. J. Jerry, U. H. F. Bunz and V. M. Rotello, Proc. Natl. Acad. Sci. U. S. A., 2009, 106, 10912–10916 CrossRef CAS.
- Kenry, Y. Duan and B. Liu, Adv. Mater., 2018, 30, 1802394 CrossRef.
- O. Martinez, J. Sosabowski, J. Maher and S. Papa, J. Nucl. Med., 2019, 60, 730–735 CrossRef CAS.
- Kenry and B. Liu, Acc. Mater. Res., 2022, 3, 721–734 CrossRef CAS.
- E. A. Specht, E. Braselmann and A. E. Palmer, Annu. Rev. Physiol., 2017, 79, 93–117 CrossRef CAS.
- Y. Dou, Kenry, J. Liu, F. Zhang, C. Cai and Q. Zhu, J. Mater. Chem. B, 2019, 7, 7771–7775 RSC.
- G. Qi, F. Hu, Kenry, K. C. Chong, M. Wu, Y. H. Gan and B. Liu, Adv. Funct. Mater., 2020, 30, 2001338 CrossRef CAS.
- M. Fu, Y. Sun, Kenry, M. Zhang, H. Zhou, W. Shen, Y. Hu and Q. Zhu, Chem. Commun., 2021, 57, 3508–3511 RSC.
- Kenry, T. Yeo, P. N. Manghnani, E. Middha, Y. Pan, H. Chen, C. T. Lim and B. Liu, ACS Nano, 2020, 14, 4509–4522 CrossRef CAS.
- Kenry, T. Yeo, D. T. She, M. H. Nai, V. L. Marcelo Valerio, Y. Pan, E. Middha, C. T. Lim and B. Liu, ACS Nano, 2021, 15, 17412–17425 CrossRef CAS.
- Kenry and B. Liu, Chem, 2023, 9, 2078–2094 CAS.
- K. M. McKinnon, Curr. Protoc. Immunol., 2018, 120, 5.1.1–5.1.11 Search PubMed.
- L. Joosen, M. A. Hink, T. W. Gadella Jr. and J. Goedhart, J. Microsc., 2014, 256, 166–176 CrossRef CAS.
- J. Alles, N. Karaiskos, S. D. Praktiknjo, S. Grosswendt, P. Wahle, P.-L. Ruffault, S. Ayoub, L. Schreyer, A. Boltengagen, C. Birchmeier, R. Zinzen, C. Kocks and N. Rajewsky, BMC Biol., 2017, 15, 44 CrossRef PubMed.
- L. Zhu, M. Rajendram and K. C. Huang, iScience, 2021, 24, 102348 CrossRef CAS PubMed.
- K. Haase and A. E. Pelling, J. R. Soc., Interface, 2015, 12, 20140970 CrossRef PubMed.
- Y. F. Dufrêne, T. Ando, R. Garcia, D. Alsteens, D. Martinez-Martin, A. Engel, C. Gerber and D. J. Müller, Nat. Nanotechnol., 2017, 12, 295–307 CrossRef.
- Kenry, L. Sun, T. Yeo, E. Middha, Y. Gao, C. T. Lim, S. Watanabe and B. Liu, Small, 2022, 18, 2203285 CrossRef CAS PubMed.
- S. F. El-Mashtoly, H. K. Yosef, D. Petersen, L. Mavarani, A. Maghnouj, S. Hahn, C. Kötting and K. Gerwert, Anal. Chem., 2015, 87, 7297–7304 CrossRef CAS.
- G. Pettinato, M. F. Coughlan, X. Zhang, L. Chen, U. Khan, M. Glyavina, C. J. Sheil, P. K. Upputuri, Y. N. Zakharov, E. Vitkin, A. B. D'Assoro, R. A. Fisher, I. Itzkan, L. Zhang, L. Qiu and L. T. Perelman, Sci. Adv., 2021, 7, eabj2800 CrossRef CAS.
- X. Du, Z. Zhang, X. Zheng, H. Zhang, D. Dong, Z. Zhang, M. Liu and J. Zhou, Nat. Commun., 2020, 11, 192 CrossRef CAS.
- P. Eaton and K. Batziou, Methods Mol. Biol., 2019, 1886, 3–28 CrossRef CAS.
- K. Eberhardt, C. Stiebing, C. Matthäus, M. Schmitt and J. Popp, Expert Rev. Mol. Diagn., 2015, 15, 773–787 CrossRef CAS PubMed.
- J. Monzó, I. Insua, F. Fernandez-Trillo and P. Rodriguez, Analyst, 2015, 140, 7116–7128 RSC.
- A. Maslova, R. N. Ramirez, K. Ma, H. Schmutz, C. Wang, C. Fox, B. Ng, C. Benoist, S. Mostafavi and I. G. Project, Proc. Natl. Acad. Sci. U. S. A., 2020, 117, 25655–25666 CrossRef CAS.
- M. S. Shoukat, A. D. Foers, S. Woodmansey, S. C. Evans, A. Fowler and E. J. Soilleux, Cell Rep. Med., 2021, 2, 100192 CrossRef CAS.
- S. M. Barone, A. G. A. Paul, L. M. Muehling, J. A. Lannigan, W. W. Kwok, R. B. Turner, J. A. Woodfolk and J. M. Irish, eLife, 2021, 10, e64653 CrossRef CAS.
- B. Sargent, M. Jafari, G. Marquez, A. S. Mehta, Y.-H. Sun, H.-y. Yang, K. Zhu, R. R. Isseroff, M. Zhao and M. Gomez, Sci. Rep., 2022, 12, 9912 CrossRef CAS PubMed.
- I. H. Sarker, SN Comput. Sci., 2021, 2, 160 CrossRef.
- L. Alzubaidi, J. Zhang, A. J. Humaidi, A. Al-Dujaili, Y. Duan, O. Al-Shamma, J. Santamaría, M. A. Fadhel, M. Al-Amidie and L. Farhan, J. Big Data, 2021, 8, 53 CrossRef.
- D. M. Camacho, K. M. Collins, R. K. Powers, J. C. Costello and J. J. Collins, Cell, 2018, 173, 1581–1592 CrossRef CAS.
- J. G. Greener, S. M. Kandathil, L. Moffat and D. T. Jones, Nat. Rev. Mol. Cell Biol., 2022, 23, 40–55 CrossRef CAS PubMed.
- Kenry, Adv. Theor. Simul., 2023, 6, 2300122 CrossRef CAS.
- S. Dhoble, T.-H. Wu and Kenry, Angew. Chem., Int. Ed., 2024, 63, e202318380 CrossRef CAS.
- H. Kobayashi, C. Lei, Y. Wu, A. Mao, Y. Jiang, B. Guo, Y. Ozeki and K. Goda, Sci. Rep., 2017, 7, 12454 CrossRef.
- A. Krull, P. Hirsch, C. Rother, A. Schiffrin and C. Krull, Commun. Phys., 2020, 3, 54 CrossRef.
- Y. Belotti, D. S. Jokhun, J. S. Ponnambalam, V. L. M. Valerio and C. T. Lim, APL Bioeng., 2021, 5, 016105 CrossRef CAS PubMed.
- D. N. H. Kim, A. A. Lim and M. A. Teitell, Sci. Rep., 2021, 11, 19448 CrossRef CAS PubMed.
- S. Mota, R. Rogers, A. Haskell, E. McNeill, R. Kaunas, C. Gregory, M. Giger and K. C. Maitland, J. Med. Imaging, 2021, 8, 014503 Search PubMed.
- E. Hallström, V. Kandavalli, P. Ranefall, J. Elf and C. Wählby, PLoS Comput. Biol., 2023, 19, e1011181 CrossRef.
- Kenry, B. K. Eschle, B. Andreiuk, P. C. Gokhale and S. Mitragotri, Adv. Ther., 2022, 5, 2100198 CrossRef CAS.
- P. Falagan-Lotsch, E. M. Grzincic and C. J. Murphy, Proc. Natl. Acad. Sci. U. S. A., 2016, 113, 13318–13323 CrossRef CAS PubMed.
- P. Jawaid, M. U. Rehman, Q.-L. Zhao, M. Misawa, K. Ishikawa, M. Hori, T. Shimizu, J.-i. Saitoh, K. Noguchi and T. Kondo, Cell Death Discovery, 2020, 6, 83 CrossRef CAS PubMed.
- S. Berg, D. Kutra, T. Kroeger, C. N. Straehle, B. X. Kausler, C. Haubold, M. Schiegg, J. Ales, T. Beier, M. Rudy, K. Eren, J. I. Cervantes, B. Xu, F. Beuttenmueller, A. Wolny, C. Zhang, U. Koethe, F. A. Hamprecht and A. Kreshuk, Nat. Methods, 2019, 16, 1226–1232 CrossRef CAS PubMed.
- A. E. Carpenter, T. R. Jones, M. R. Lamprecht, C. Clarke, I. H. Kang, O. Friman, D. A. Guertin, J. H. Chang, R. A. Lindquist, J. Moffat, P. Golland and D. M. Sabatini, Genome Biol., 2006, 7, R100 CrossRef PubMed.
- Kenry, Nanoscale, 2024, 16, 7874–7883 RSC.
Footnote |
| † Electronic supplementary information (ESI) available. See DOI: https://doi.org/10.1039/d4nr02466d |
| This journal is © The Royal Society of Chemistry 2024 |

