 Open Access Article
Evaluation of the dispersion properties of graphene oxide/cetyltrimethylammonium bromide for application in nanocomposite materials†
Angela Sánchez-Cepeda *a,
E. Cedeño
 b,
E. Marín
 b,
M. Carolina Pazos
 c,
Silva-Cote Ingrid
 d,
Efrén de Jesús Muñoz‡
a and
Ricardo Vera-Graziano
 e
e
aFacultad de Ciencias Básicas, Escuela de Posgrados, Universidad Pedagógica y Tecnológica de Colombia UPTC, Avda. Central del Norte, Vía Paipa, 150001 Tunja, Boyacá, Colombia. E-mail: angelapatricia.sanchez@uptc.edu.co
bInstituto Politécnico Nacional, Centro de Investigación en Ciencia Aplicada y Tecnología Avanzada, Av. Legaria # 694, Col. Irrigación, Del. Miguel Hidalgo, 11500 Ciudad de México, Mexico
cEscuela de Ciencias Química, Facultad de Ciencias, Universidad Pedagógica y Tecnológica de Colombia UPTC, Avda. Central del Norte, Vía Paipa, Tunja, Boyacá, Colombia
dUnidad de Terapia Celular, Instituto Distrital de Ciencia, Biotecnología e Innovación en salud. IDCBIS, Cra 32 #12-81, 0571 Bogotá, Colombia
eInstituto de Investigaciones en Materiales, Universidad Nacional Autónoma de México UNAM, Avda Universidad, C.U., Coyoacán, 04510 Ciudad de México, Mexico
First published on 19th January 2024
Abstract
The properties of thermal diffusivity and Z potential of the GONPs/CTAB nanofluid were studied as a function of GO concentration (in the range between 4 and 12% w/v), temperature (35 and 50 °C) and time (30 and 60 min) under ultrasound. In turn, the structural properties of GONPs/CTAB were measured by XRD, Raman, SEM and TEM. The GO previously modified with CTAB was used to obtain a PLA/GO nanocomposite. It was found that the behavior of thermal diffusivity provides information in situ on the dispersion properties of the nanofluid, finding values from 0.0013 to 0.0024 cm2 s−1. The hydrodynamic diameter of the GONP dispersions was also determined to range from 75.83 to 360.3 nm with an increase in Z potential from 17 to 30 mV. The most stable GONPs/CTAB dispersion conditions were 6% w/v GO, 50 °C and 30 min. Under these conditions, the GONPs/CTAB materials present an increase in the spacing between GO layers, associated with a greater multilayer stacking of the GO and CTAB layers. The Raman spectrum allowed us to demonstrate that the modification with CTAB did not affect the crystallinity of GO, which was verified by the intensity ratio of the D band and the G band (ID/IG) for the GO/CTAB samples, with the exception of the GO 6% sample, where an increase in the ID/IG ratio (0.9) was observed compared to GO (0.82), associated with greater intercalation of CTAB between the GO sheets. Finally, an SEM analysis of the PLA/GO nanocomposite was carried out and the homogeneous distribution of GO in PLA was demonstrated when it is used as a filler in proportions of 0.1%. This treatment, in turn, contributed to improving the mechanical flexural properties of the nanocomposite materials.
Introduction
The use of GO is gaining popularity primarily as a result of its chemical stability during functionalization with nanocomposites, its high surface area, and hydrophilicity.1 These characteristics are partly due to the presence of oxygen-containing functional groups, such as epoxy, hydroxyl, and carboxylic groups between the sheets which improve the formation of homogeneous suspensions. This structure produces high hydrophilicity and the ability to be dispersed in organic solvents, as well as water, showing greater solubility than graphene2,3 and the ability to functionalize the surface for use in nanocomposite materials.4The presence of polar groups in GO promotes biocompatibility and bioactivity with the host in biomedical applications. It also allows an improved reduction in the thermal stability of the nanomaterial, improved mechanical properties,5 and strongly impacts its electronic and electrochemical properties. Similarly, there is an increased interaction between the matrix and the reinforcement material for the development of a new generation of composites based on multifunctional polymers, ceramics and metals.6,7
Carbon-based materials [graphene (G), graphene oxide (GO), reduced graphene oxide (rGO), and graphene quantum dots (GQD)]4 add binding spaces in biomaterials that allow biofunctionalization with biological molecules. These include the promotion of the regeneration of specific tissues with the regulation of cellular behaviors such as cell proliferation and differentiation. It also provides biocompatibility properties such as hydrophilicity and the degree of functionalization.6,8,9
In this context, poly(lactic acid) (PLA) is a biodegradable synthetic polymer, which is also important for biomedical applications, however, it has some limitations such as its low thermal and electrical properties, low impact resistance, and brittleness.10 Therefore, the use of fillers nanomaterials such as G, GO, and rGO is an important line of research focused on improving the properties of PLA11 and of different types of polymeric matrix.12–14
PLA/GO is being used in biomedical applications related to bone tissue engineering and obtaining techniques such as 3D printing,15 where the porosity and geometry of the scaffolds are precisely controlled to facilitate union, growth, differentiation cellular formation and the formation of new bone tissue.16
GO is being applied in several areas such as drug delivery,17 biosensors,18 cell imaging,19 nanoprobes20 and organic contaminant adsorbents21 with adsorption properties greater than graphene thanks to its high surface area and its chemical functionalization potential.22 When the GO layers are stacked, it hinders uniform dispersion (nanofluid). On the other hand, when stacking is avoided the interfacial interaction between the reinforcing nanoparticles and the matrix produces a high reactivity within the nanocomposite,23,24 due to the groups of hard ligands (oxygen atom in the carboxyl group),25 which is why new GO dispersal alternatives being studied.
One of the methods to avoid GO agglomerations in dispersions is to use the ultrasonic irradiation technique, which involves heat transfer at surfaces and interfaces. These phenomena can be evaluated by means of thermal diffusivity property through the photopyroelectric technique, allowing to determine the conditions of concentration, temperature and time for its potential use in the formulation of nanocomposite materials. Thermal diffusivity is one of the most sensitive thermal transport parameters to characterize the effect of electrostatic interactions in liquids and the back photopyroelectric technique (BPPE) is one of the most widely used methods for this purpose.26–30
The BPPE technique has some advantages when compared with other existing methods such as the minimal sample volume required, the easy sample loading and removing, the relatively simple experimental set-up and measurement methodology, the maxim thermal contact that is achieved between the liquid sample and the pyroelectric sensor, and the short measurement times provided the concentration of the sample remains stable.31
Modification of GO through self-assembly with the cationic surfactant cetyltrimethylammonium bromide (CTAB) depends on the hydrophobic interaction of the alkyl chains of the CTAB molecules and their functionalization on the surface of GO to prevent re-stacking and agglomeration of the exfoliated flakes by a variety of conditions such as: the size of GO nanoparticles (GONPs) and CTAB, the mixing ratio, the state of dispersion/aggregation, the effect of salt concentration, and osmotic stress.32–34 The role of surfactant is to increase the dispersibility of GO sheets in suspensions due to van der Waals forces such as electrostatic or carbon–π interactions which can also contribute to binding.35 Furthermore, CTAB is used to positively charge GO, which is negatively charged and allows it to be easily assembled due to its strong non-covalent interaction with oxygen groups and the energy of the system by mixing with ultrasound.1,35–37
In this study, the thermal diffusivity of the GO/CTAB nanofluid was measurement using the BPPE technique, varying GO concentration, temperature and time of the system under ultrasonic irradiation. The zeta potential and hydrodynamic diameter of the dispersions were also measured. Furthermore, the GONP/CTAB solids were characterized by Raman, XRD, SEM and TEM. Finally, PLA/GO nanocomposite was obtained in order to evaluate the distribution in the matrix using GO previously modified with CTAB. Additionally, 3D PLA and PLA/GO scaffolds were obtained and the mechanical bending properties were evaluated.
Experimental
Materials
Graphene oxide (reference 796034 powder, 15–20 sheets, 4–10% rusted edge) and cetyltrimethylammonium bromide (CH3(CH2)15N(Br)(CH3)3, CAS No. 57-09-0, 98% purity), were purchased from Sigma-Aldrich. The nanocomposites were obtained from commercial grade polylactic acid (NatureWorks LLC, grade: Ingeo™ Biopolymer 2003D, USA), dichloromethane from Alvi (CAS No. 75-09-2) and poly(vinyl alcohol) from Sigma-Aldrich (CAS No. 9002-89-5, Mw 31![[thin space (1/6-em)]](https://www.rsc.org/images/entities/char_2009.gif) 000–50
000–50![[thin space (1/6-em)]](https://www.rsc.org/images/entities/char_2009.gif) 000 g mol−1, 98.99% hydrolyzed).
000 g mol−1, 98.99% hydrolyzed).
Preparation of GO suspensions in CTAB
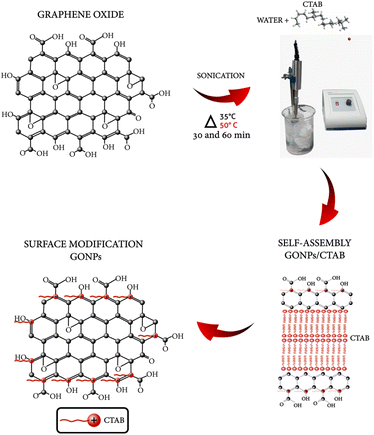
GO/CTAB suspensions were prepared according to the following procedure: graphene oxide (0.4, 0.6, 0.8, 1, 1.2 g),22 was dispersed in a solution of 10 mL of water–CTAB, at a concentration of 0.2 M,3 under ultrasonic stirring for 30 and 60 min. The sonication was maintained in an ice bath to keep the temperature at 35 °C and 50 °C. GO nanosheets were ultrasonically irradiated with a Fisherbrand ™ Model 50 Sonic Dismembrator. In Fig. 1, the possible functionalization route of the GO compound is represented, where the distribution and microstructures are influenced by the amounts and types of oxygenated groups in the layers of GO and the uniform dispersion of GO in a nanofluid.Preparation of the PLA/GO nanocomposite
CTAB was removed from the GONPs through Schlenk line at temperature of 500 °C for 1 hour.38 A cryogenic trap was used (nitrogen, −196.15 °C; dry ice, −78.15 °C and antifreeze gel at −5 °C) and a vacuum manifold connection. After the CTAB degradation, the GO was ground in a Mini Mill Pulverisette 23 Fritsch-Germany for 5 minutes and dispersed with ultrasound in dichloromethane for 15 minutes. Then, the PLA [PLA![[thin space (1/6-em)]](https://www.rsc.org/images/entities/char_2009.gif) :
:![[thin space (1/6-em)]](https://www.rsc.org/images/entities/char_2009.gif) GO, 99.9
GO, 99.9![[thin space (1/6-em)]](https://www.rsc.org/images/entities/char_2009.gif) :
:![[thin space (1/6-em)]](https://www.rsc.org/images/entities/char_2009.gif) 0.1% w/w] was added, it was left under magnetic stirring until it dissolved. For the preparation of PLA 16% w/v and PLA/GO nanocomposites, 0.5% w/v PVA solution was prepared in distilled water at 70 °C under ultrasound agitation at an amplitude of 50 dB, where the polymer solution is slowly added, left in stirring until the solidification of the polymer and evaporation of the dichloromethane in approximately 4 to 5 min.39 Subsequently, each shaped was washed with plenty of distilled water at 70 °C to remove the PVA.
0.1% w/w] was added, it was left under magnetic stirring until it dissolved. For the preparation of PLA 16% w/v and PLA/GO nanocomposites, 0.5% w/v PVA solution was prepared in distilled water at 70 °C under ultrasound agitation at an amplitude of 50 dB, where the polymer solution is slowly added, left in stirring until the solidification of the polymer and evaporation of the dichloromethane in approximately 4 to 5 min.39 Subsequently, each shaped was washed with plenty of distilled water at 70 °C to remove the PVA.
3D printing method
The PLA and PLA/GO nanocomposites were prepared by using mini-extruder Filastruder brand, the filaments had a diameter of 1.75 mm, they were printed with fused deposition modeling, commonly known as 3D printing technology. The geometric structure used was a cube with a cell scale of L = 2 mm and a wall thickness of 0.05 mm, the grid was rotating 30° with respect to the transverse axis of rotation.Techniques or characterization
The photopyroelectric signal as a function of the thickness, l, of the sample can be expressed as:40
δP(l) = H![[thin space (1/6-em)]](https://www.rsc.org/images/entities/char_2009.gif) e−σml e−σml |
| σm = (1 + i)(πf/αm)1/2 |
| αm = πf/m2 |
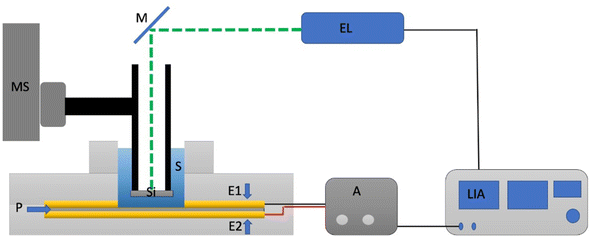
A simplified scheme of the experimental setup is shown in Fig. 2. The intensity of a beam of light from a laser (Coherent Obis Model, 640 nm, 100 mW) is electronically periodically modulated at the frequency of f = 10 Hz (50% duty cycle) and is focused on a 350 μm thick silicon (Si) plate that can be moved through the sample using a micrometer positioner. The Si plate absorbs part of the incident radiation and heats up periodically becoming a generator of thermal waves on its unlit surface that propagate through the sample towards a pyroelectric polyvinylidene chloride (PVDF) sensor (52 μm thick and 20 mm in diameter) that is metallized on both surfaces to access the pyroelectric signal. This sensor is located at the variable distance l from the Si sheet that was varied between 300 and 600 μm in steps of 10 μm. The periodical heating of the sensor generates a voltage signal between the metallizations that is measured in amplitude and phase with a Lock-in amplifier (Model SR830 Stanford Research) synchronized to the modulation light frequency. Measurements are performed automatically, taking an average from 100 measurements at each thickness. To characterize the GONPs in CTAB, the suspensions were dried in a Scorpion Scientific vacuum oven at a temperature of 50 °C for 18 hours to eliminate the water present in the dispersion and characterize them later.
Zeta potential measurements
The particle size and the zeta potential measurements of the GO/CTAB suspensions were measured in a Malvern Zetasizer nanostation, Nan-ZS, using samples diluted to a very low concentration (12 μL), using dynamic light scattering with Optics “NIBS”. To measure the distribution of the Z potential and the electrophoretic mobility, a disposable capillary cell was used to detect that there is no cross contamination between the samples.Raman and FTIR spectroscopy measurements
Raman spectra were obtained using a DXR Raman spectrometer, model DXR2 Smart Raman, Thermo Scientific brand, with a 633 nm excitation laser, at a laser excitation wavelength of 785 nm. Spectra were analyzed using OMNIC software. The chemical analysis was performed by means of Fourier transform infrared spectroscopy (FTIR) in a FTIR-Thermo Scientific Nicolet 6700 equipment and an ATR-Smart Orbit attenuated total reflection (ATR) system at a wavenumber range between 500 and 4000 cm−1.X-ray diffraction
X-ray diffraction (XRD) analysis was used to analyze the structural changes before and after CTAB modification. The analysis was carried out at room temperature in a SIEMENS D-500 diffractometer, using Cu Kα radiation (λ = 0.1542 nm) in the range of 2.0–70° (2θ), a step size of 0.02° and a scanning step of 1.2 s.Scanning electron microscopy and transmission electron microscopy
The morphological analysis of the CTAB-modified graphene oxide particles, as well as the PLA and PLA/GO polymer matrix, was performed using a JEOL model JSM-7600F Schottky field emission scanning electron microscope (FE-SEM). It has an energy-dispersive X-ray spectroscopy (EDS) elemental analysis system that offers a resolution of 1.0 nm at 133 eV. The samples were coated with gold using a sputter coating device, ensuring detailed and accurate observations of the samples.The analysis of the electron diffraction pattern and the measurement of the interplanar distance were performed using a JEOL ARM200F transmission electron microscope (TEM) with high angle annular dark-field (HAADF) STEM imaging and Digital Micrograph Software. These NPs in suspension were deposited dropwise on a TEM grid until their evaporation at room temperature for 6 hours.
Mechanical tests
The flexural properties of both PLA and PLA/GO 3D scaffolds were evaluated in accordance with ASTM D790 standards. The assessments were conducted utilizing a Shimadzu AGS-X universal machine, applying a strain rate of 1.07 mm min−1. Four specimens, each possessing dimensions of thickness (t) = 10 mm, length (l) = 100 mm, and width (w) = 10 mm, were subjected to the flexural testing.Results and discussion
Analysis of thermal diffusivity of GO in dispersion with CTAB
In the study of the colloidal stability of the dispersion of GO in CTAB 0.2 M, GO concentration was evaluated as well as the influence of ultrasonic irradiation on the thermal diffusivity of GONPs.The results obtained from the study of thermal diffusivity at different times and sonication temperatures are shown in Fig. 3. A linear increase in thermal diffusivity in nanofluids is exhibited when the concentration of GONPs in the dispersion increases to 35 °C after 30 minutes of stirring with the ultrasonic dispersion technique, Fig. 3a. This is mainly due to the fact that the effective thermal conductivity of nanofluids is higher than the value of base fluids (CTAB 0.2 M) and increases with the volume fraction of GONPs.41
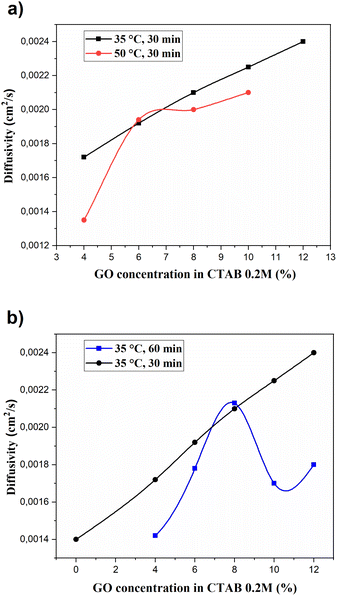 | ||
| Fig. 3 Thermal diffusivity of GO as a function of the GO concentration and sonication time: (a) after 30 minutes of sonication at 35 and 50 °C and (b) after 30 and 60 minutes of sonication at 35 °C. | ||
This also occurs due to an increase in electrostatic interactions of the nanofluid due to a diffusion process caused by the existence of a concentration gradient of the CTAB in aqueous medium, followed by a process of adsorption of the surfactant on the colloidal surface of the GONPs. When the temperature is increased to 50 °C, there is a maximum adsorption of the nanofluid at the concentration of GO 6% with the ultrasonic irradiation. This increases the stability of the nanofluid and reduces the agglomeration between particles by reducing the surface tension of the base fluids.42,43
According to Fick's law, diffusive flow that crosses a surface is directly proportional to the concentration gradient and the temperature which can be used to measure the thermal diffusivity.44
By increasing the sonication time to 60 minutes at the same temperature of 35 °C Fig. 3b, a linear increase does not occur when it reaches the maximum concentration of GO in the dispersion. Thermal diffusivity decreases due to the decrease of electrostatic interactions in the adsorption of the surfactant CTAB on the colloidal surface.
Lian et al.,35 observed that the stacking of surfactants increases the spacing between the layers of GO laminates. This facilitates the dispersibility of GO in the suspension and allows a linear increase in thermal diffusivity as the concentration of GO increases while sonication time and temperature are controlled, Fig. 3. Adding salt in the suspensions produces an increase in the space between the layers of GO when intercalating CTAB which can be expelled by a high osmotic stress. This interaction would be dominated by electrostatic forces and osmotic stress studies have indicated an absence of layers in the continuous hydration of GONPs/CTAB assemblies.45
Thermal transport in 2D materials is attributed to oxygen groups covalently attached to the particle surface due to their mixture of sp2 and sp3 hybridized carbon atoms,46 present in COOH and OH groups, which attract surfactants to the GO by chemical conjugation or physisorption.47,48
Analysis of the diameter and Z potential of the GONPs/CTAB
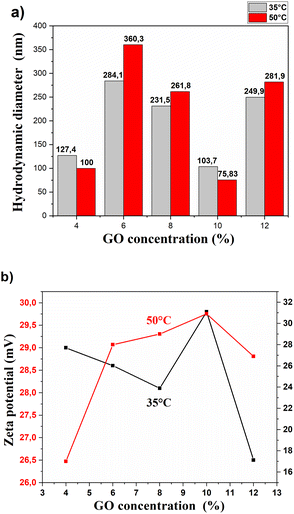
The analysis of the hydrodynamic diameter and Z potential for the GONPs/CTAB was carried out as a function of the concentration and temperature, using 30 min of dispersion and sonication. The results are presented in Fig. 4.In order to determine the size of the nanoparticles, a measurement was carried out using scattered laser light that made it possible to determine the relationship between the Z potential and the GO concentration for two temperatures, 35 and 50 °C.
These results are shown in Fig. 4a, where GO concentrations of 6 and 12% are associated with larger diameters; however, for the 6% concentration, a greater dispersion is achieved as shown in Table 1, where also shows that 100% of the GONPs have the same diameter of 360 nm at 50 °C which is associated that a greater homogeneity is achieved at higher temperatures. It can also be seen that the hydrodynamic diameters of the GONPs decrease when the sonication temperature increases due to a greater electrostatic force between particles.
| Concentration GO (%) | Temperature (°C) | Size (d, nm) | Number (%) | St Dev (d, nm) | Z-Average (d, nm) |
|---|---|---|---|---|---|
| 4 | 35 | 127.4 | 66.7 | 26.79 | 388.1 |
| 391.6 | 33.3 | 36.79 | |||
| 50 | 257.9 | 100.0 | 100.3 | 326.7 | |
| 6 | 35 | 284.1 | 99,9 | 181.2 | 469.1 |
| 4918 | 0.1 | 828.7 | |||
| 50 | 360.3 | 100.0 | 100.3 | 444.5 | |
| 8 | 35 | 746.5 | 18.4 | 336.6 | 557.8 |
| 231.5 | 81.6 | 81.84 | |||
| 50 | 261.8 | 100.0 | 150.1 | 367.2 | |
| 10 | 35 | 103.7 | 58.4 | 32.94 | 687.0 |
| 453.0 | 41.5 | 232.4 | |||
| 50 | 75.83 | 73.6 | 13.21 | 338.2 | |
| 298.6 | 26.4 | 115.9 | |||
| 12 | 35 | 249.9 | 100 | 126.3 | 368.8 |
| 50 | 281.9 | 100.0 | 128.1 | 364.9 |
In relation to Fig. 4b, low concentrations of GO have a great difference in the level of Z potential, where low temperatures are associated with the highest levels of this potential. Suspensions at a lower temperature require higher electrostatic forces of repulsion between the GONPs to avoid their agglomeration.
This behavior is similar for concentrations of 8 and 12% of GO; where a drop in Z potential occurs because there is a decrease in the distance and repulsive forces between the colloids. This allows a decrease in the Z potential when concentrations of GO are high. GO agglomeration in the presence of CTAB can occur due to increased viscosity, which increases with particle concentration. The effect of surfactants manages to improve dispersion, but they can also cause an increase in viscosity.49
The dispersion of the cationic CTAB and the negatively charged GONPs produces a relative electric potential in the solution. This repulsion occurs in order to achieve equilibrium between the opposing forces of electrostatic repulsion and van der Waals-type attraction; requiring more energy to overcome this repulsion and force the particles to bond. This energy increases dramatically as the particles get closer.50
Fan et al.,51 found that the temperature in the dispersion modifies the speed of the vibration of the GONPs which improves the electrostatic repulsion since the surfactant is adsorbed on the surface of the GONPs displacing the counterions and expanding the electrical double layer.
In turn, these repulsions favor the dispersion of the nanoparticles.52 This action inhibited agglomerations which caused an increase in particle size. The ionizing effect that prevents aggregation is formed by a charge on the surface during the deprotonation of the carboxyl groups that form a barrier at the edge of the GO nanosheets.51,53,54
Raman spectroscopy analysis of GONPs/CTAB
The relative positions, widths, and intensities of the D and G bands of Raman Spectroscopy were used to determine the degree of disorder in the structure of carbon materials. The D band is attributed to the extremes, defects, disordered carbon, and disorders of graphene oxide sheets and utilizing a symmetry vibration mode A1g involving phonons near the limit of zone K (Fig. 5a). Band G corresponds to sp2 carbon atoms with a well-ordered structure in a two-dimensional hexagonal lattice corresponding to the mode E2g from the center of the doubly degenerate zone (Fig. 5b). The D mode is dispersive and varies with photon excitation energy, even when the G band is not dispersive.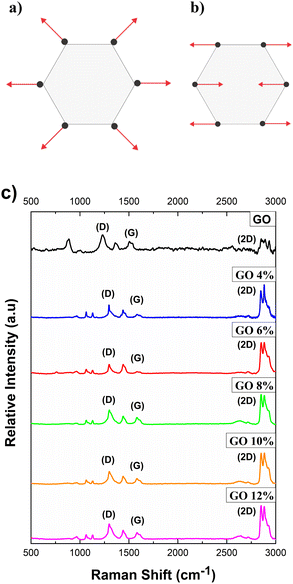 | ||
| Fig. 5 Carbon vibration motions: (a) D-mode, (b) G-mode and (c) comparison of Raman spectra of pure GO and GO/CTAB suspensions in the range of 500 to 3000 cm−1. | ||
In Fig. 5c, the Raman spectra of pure GO is compared with the GONPs/CTAB studied previously. Three main bands can be observed in each spectrum. The GO spectrum presented a weak G band and a strong, well-defined D band. The D band was located at approximately 1308 cm−1 and is associated with the vibration of aromatic rings with free bonds at the ends of the planes and with defects in the crystal structure.
The G band widens and is shifted to a higher frequency number located at 1583 cm−1. This phenomenon is attributed to the presence of isolated double bonds on the graphene oxide sheet, which resonate at higher frequencies because of the double bonds between the GO sheets which are dependent on the isolation of the sp2 carbon atoms. The D band, characteristic of defects in the structure both at the edge and in the plane, presents high intensity. GONPs/CTAB presented a shifting of the bands to the low wave number a decrease in the intensity of D,G-band in the Raman spectra compared to the graphene oxide.
In Fig. 6, the GO presents the typical spectrum of a material that is not very crystalline, in which the G band is not very intense and wide. This is characteristic of the presence of sp2 domains of carbon atoms.
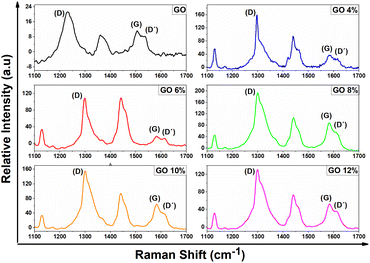 | ||
| Fig. 6 Raman spectra of bands D and G of pure GO and GO/CTAB suspensions in the range of 1100 to 1700 cm−1. | ||
D band is associated with the presence of defects in the structure (both on the edge and in the plane) and presents a high intensity. In the second order spectrum (2300–3300 cm−1), the overtones of the first order spectrum bands appear.55,56 The band located at a higher frequency (2550 cm−1 and 2634 cm−1, respectively, Fig. 7a, band 2D), is associated with an overtone of the D band. It can be suggested that the overtone is a response to the stacking order of the graphene oxide sheets along the c axis while taking shape and width into account.
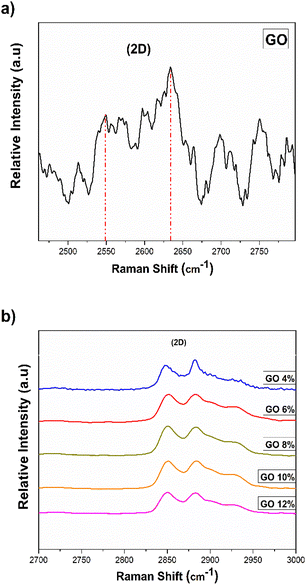 | ||
| Fig. 7 Raman spectra of the 2D bands: (a) pure GO and (b) the GO/CTAB suspensions in the range of 2500 to 3000 cm−1. | ||
These results suggest the presence of defects in the material. For the GONPs/CTAB dispersions, the shift towards higher frequencies is observed in comparison to the starting GO (Table 2 and Fig. 7b).57,58
| Sample (%) | Raman shift D (cm−1) | Relative intensity | Raman shift G (cm−1) | Relative intensity | Band (I(D)/I(G)) | Raman shift 2D (cm−1) | Relative intensity | 2D band (I(2D)/I(G)) |
|---|---|---|---|---|---|---|---|---|
| GO | 1308.41 | 21.320 | 1583.37 | 11.176 | 0.82 | 2550.00 | 1.579 | 1.61 |
| 2634.75 | 4.294 | 1.66 | ||||||
| 2698.43 | 0.267 | 1.70 | ||||||
| 2751.15 | 1.262 | 1.73 | ||||||
| 4 | 1296.51 | 158.701 | 1586.69 | 36.878 | 0.81 | 2846.92 | 345.787 | 1.79 |
| 2881.99 | 420.556 | 1.81 | ||||||
| 6 | 1299.68 | 109.364 | 1440.38 | 109.364 | 0.90 | 2850.93 | 389.034 | 1.97 |
| 2882.86 | 390.809 | 2.00 | ||||||
| 8 | 1300.31 | 193.936 | 1581.90 | 88.690 | 0.82 | 2850.68 | 411.984 | 1.80 |
| 2883.72 | 398.816 | 1.82 | ||||||
| 10 | 1297.50 | 171.239 | 1583.74 | 64.227 | 0.81 | 2850.83 | 405.087 | 1.80 |
| 2883.55 | 436.903 | 1.82 | ||||||
| 12 | 1298.18 | 130.996 | 1584.68 | 52.470 | 0.81 | 2849.68 | 294.607 | 1.79 |
| 2882.79 | 286.714 | 1.81 |
When the adsorption of CTAB on GO occurs, the modification of the oxidized functional groups is reflected in the increase in the intensity of the D and G bands of the Raman spectrum. There is a decrease in the width of the D and G bands compared to the starting GO, indicating greater crystallinity defined by a higher signal and increased clutter in the graphitic layers that make up the starting material. Also, it is observed that the G band decreases in intensity with respect to the D band which moves to higher frequencies and is indicative of an overlap with the D′ band than corresponds to an intravalley resonance with the G band, according to Claramunt, et al.59 and Lee, et al.,60 this band has been attributed to GO crystalline defects and is used as a measure of the quality of this material. The values occur as the result of defects that appear in the basal plane of the GO when oxygenated functional groups are present or when there is an increase in these oxygenated groups at the edges of the GO.61,62
One of the most used parameters to determine the degree of order and crystallinity is the relative intensity of the D band with respect to the G band (ID/IG), expressed as the ratio between their areas.55 The ratio of intensities of bands D and G (ID/IG), expressed as the quotient between its areas,3 of the functionalized GO in CTAB, represents the proportion of amorphous or disordered carbon (sp3) with respect to graphitic carbon (sp2), thus, the GO presents an ID/IG ratio of 0.82. The proportion of intensities of bands D and G (ID/IG) for GO 4% was 0.81, GO 6% was 0.90, GO 8% was 0.82, GO 10% was 0.81, and GO 12% was 0.81 (Table 2).
Changes are observed in the D band with greater intensity in the GO 8% sample, which are generated by defects and disorders due to the intercalation of the CTAB, by the presence of heteroatoms in the plane, grain boundaries, and aliphatic chains, among others.63 It also presents a minimal increase in the D band of the GO 4 and 6% dispersion, which indicates that the intercalation with the CTAB greatly influences the sp2 domains of the GO with defects.
The change in the G band increases as the concentration of GO in the dispersion increases. This increase is attributed to the increase in sp3 carbons according to the oxidation level during sonication. The area of the Raman spectrum at higher frequencies also reflects the changes that originated with the adsorption of the CTAB. This includes the 2D band that demonstrates the crystallinity of the sample since it is a Raman mode of the sp2.
The G band changes at higher frequencies during GO amorphization due to the presence of significant unmodified graphitic areas and double bonds. As a result, the graphitic carbons essentially generate an increase in the ID/IG ratio when intercalation ocurred.
Similarly, there is a reduction in the amorphization of highly defective, but essentially graphitic carbons, by decreasing the ID/IG, ratio. This is offset by the decrease associated with the restoration of the aromaticity of the network effect. This attributed to a large distortion that removed the rings and returned the carbon network to an essentially graphite state, but with major defects.64,65
The decrease in the 2D band in pure GO is characteristic of the changes in oxidation levels in the reaction. It was observed that as the concentration of GO in the dispersion increases, it corresponds to the breakdown of the stacking order due to the intercalation process which primarily caused structural changes and the formation of different types of oxygenated functional groups in the basal plane as well as on the edges.63,66
These oxygenated groups allow this type of material to be used in most in vivo applications due to its excellent dispersibility in most biological media. Its high surface area improves colloidal dispersion, gives greater stability, and decreases the aggregation of GO sheets, thus avoiding collateral impurities during dispersion that can be harmful to biological systems.67
Analysis FTIR of GONPs/CTAB
The FTIR analysis performed in this study provides information on the interaction between the oxygenated functional groups of graphene oxide (GO) and cetyltrimethylammonium bromide (CTAB). Analysis of the GO spectrum shows different absorption bands, each of which corresponds to specific functional groups. The absorption band at 1718 cm−1 is indicative of the stretching vibration associated with the C![[double bond, length as m-dash]](https://www.rsc.org/images/entities/char_e001.gif) O carbonyl group, while the band located at 1618 cm−1 is attributed to the C
O carbonyl group, while the band located at 1618 cm−1 is attributed to the C![[double bond, length as m-dash]](https://www.rsc.org/images/entities/char_e001.gif) C vibration within the remaining graphitic domains unoxidized. Furthermore, the presence of the C–O–C epoxy group is associated with the absorption band at 1212 cm−1, while the C–O carboxyl group is distinguished by the band around 1046 cm−1.68
C vibration within the remaining graphitic domains unoxidized. Furthermore, the presence of the C–O–C epoxy group is associated with the absorption band at 1212 cm−1, while the C–O carboxyl group is distinguished by the band around 1046 cm−1.68
Compared to GO, the FTIR spectra of the GONPs/CTAB samples exhibit remarkable similarity between them, with the absorption bands of CTAB appearing prominently and overlapping with those of GO. Fig. S1† illustrates the FTIR spectrum of the GONPs/CTAB sample containing GO 6%. In particular, absorption bands are observed at 3608 cm−1 and 1431 cm−1, corresponding to the stretching and bending vibrations of the hydroxyl group.68 Furthermore, characteristic absorption bands associated with the oxygenated groups identified in GO are also present.
Distinctive features in the FTIR spectrum of the GONPs/CTAB sample with GO 6% include absorption bands at bands at 2915 and 2849 cm−1 attributed to the C–H vibrations of the alkyl chain of CTAB. Furthermore, the band at 1458 cm−1 is assigned to the N–H bending vibration, indicative of the amide bond formed between the amino groups in CTAB and the carboxy groups in GO. This FTIR analysis is an indication of the molecular interactions and bonds within the GONPs/CTAB composite system, similar to what has been reported by other authors.69,70
Analysis XRD of GONPs/CTAB
In Fig. 8, the XRD of the GONPs/CTAB are shown in comparison to pure GO and CTAB surfactant. In the GO X-ray diffraction pattern, an intense signal is observed with a diffraction angle 2θ of 26.48°, which indicates that there is a separation between the planes of 3.36311 Å, which is characteristic of this material, the main signals of the GO.71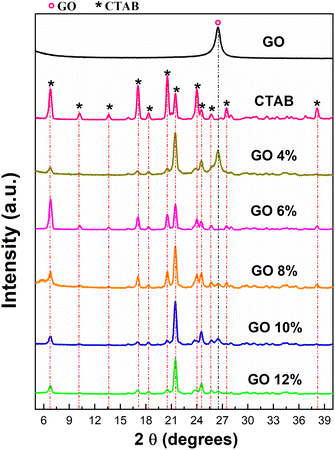 | ||
| Fig. 8 XRD analysis of pure GO and GONPs/CTAB, after ultrasonic irradiation treatment for 30 minutes at 50 °C. | ||
GO 4% presents an intense signal greater than the other NPs at a diffraction angle 2θ of 21.41 with a separation between the planes of 4.13924 Å (see Table 3). A peak at a diffraction angle 2θ of 21.1 has been associated with the intercalation of CTAB into the interlayers of GO.72 The interaction between CTAB and GO constitutes an equilibrium process. Under the specific experimental conditions delineated in this study, a modification the X-ray diffraction pattern was observed. Notably, the characteristic peak at 26.4°, attributed to unmodified GO, exhibited a reduction in intensity. This diminution can be attributed to the partial nature of the CTAB intercalation process, possibly due to kinetic factors that require further analysis.
| Sample (%) | Angle 2-theta (°) | d value, Angstrom (Å) | Intensity count | Intensity (%) |
|---|---|---|---|---|
| GO | 26.48 | 3.36311 | 4949 | 100.0 |
| CTAB | 17.07 | 5.18938 | 2787 | 78.0 |
| 18.32 | 4.83802 | 623 | 17.4 | |
| 20.53 | 4.32214 | 3.571 | 100.0 | |
| 21.47 | 4.13528 | 2172 | 60.8 | |
| 23.99 | 3.70540 | 2492 | 69.8 | |
| 27.49 | 3.24186 | 985 | 27.6 | |
| GO 4 | 17.01 | 5.20580 | 339 | 13.8 |
| 20.50 | 4.32773 | 490 | 20.0 | |
| 21.45 | 4.13924 | 2451 | 100.0 | |
| 23.87 | 3.72337 | 481 | 19.6 | |
| 24.52 | 3.62706 | 924 | 37.7 | |
| 26.48 | 3.36273 | 1502 | 61.3 | |
| GO 6 | 17.06 | 5.19155 | 1687 | 20.7 |
| 20.52 | 4.32360 | 2018 | 24.7 | |
| 21.47 | 4.13537 | 3298 | 40.4 | |
| 23.99 | 3.70605 | 1432 | 17.6 | |
| 24.50 | 3.62997 | 1164 | 14.3 | |
| 25.69 | 3.46450 | 588 | 7.2 | |
| 27.48 | 3.24248 | 598 | 7.3 | |
| GO 8 | 17.06 | 5.19308 | 570 | 30.7 |
| 20.51 | 4.32534 | 783 | 42.1 | |
| 21.45 | 4.13810 | 1859 | 100.0 | |
| 23.99 | 3.70610 | 660 | 35.5 | |
| 24.51 | 3.62785 | 720 | 38.7 | |
| 26.46 | 3.36553 | 262 | 14.1 | |
| 27.49 | 3.24151 | 322 | 17.3 | |
| GO 10 | 17.04 | 5.19712 | 391 | 9.9 |
| 20.51 | 4.32622 | 521 | 13.2 | |
| 21.45 | 4.13737 | 3.936 | 100.0 | |
| 23.93 | 3.71524 | 521 | 13.2 | |
| 24.52 | 3.62720 | 1309 | 33.3 | |
| 26.48 | 3.36319 | 657 | 16.7 | |
| 27.43 | 3.24856 | 251 | 6.4 | |
| GO 12 | 17.02 | 5.20380 | 506 | 13.6 |
| 20.51 | 4.32678 | 575 | 15.4 | |
| 21.46 | 4.13605 | 3732 | 100.0 | |
| 23.95 | 3.71189 | 510 | 13.7 | |
| 24.53 | 3.62588 | 1255 | 33.6 | |
| 26.50 | 3.36039 | 382 | 10.2 | |
| 27.43 | 3.24809 | 224 | 6.0 |
The GO 6% present several signals with greater intensity and greater interlaminar distance compared to the other GONPs/CTAB which allow for greater flaking of the GO sheets in the dispersion due to the loss of their crystallographic order after the treatment of dispersion by sonication in addition to the chemical interaction during the functionalization with the CTAB.73
The dispersions show that they have fewer graphitic domains and more oxidized domains because the graphitic signals become narrower as the GO concentration in the dispersion increases and new signals with less intensity are formed.63 The provision of the CTAB 0.2 M surfactant in high concentrations improved the space between the layers of the GO laminate when an increase in the separation between the planes of the GONPs/CTAB with respect to pure GO is observed.35
The supply of CTAB 0.2 M surfactant at a concentration higher than the critical micellar concentration led to the CTAB molecules being positioned perpendicularly and face to face on the GO surface, causing the lamellar separation and self-assembly of the GONPs/CTAB with compared to pure GO.74
It was also observed that the GO 6% dispersion had a slight decrease in the spacing between layers. This was due to a greater inclination of the tails and the presence of CTAB monolayers instead of bilayers between the GO sheets. GONPs/CTAB also show much broader bands that can be attributed to the smaller dimensions of GO resulting from marked “structural defects” in the GO shell, as well as its carbon structure that may contain fewer oxygen groups.
This was determined from the strong interactions with the CTAB indicating robust multilaminar stacking which formed multiple layers that assemble and quantify the relevant structural parameters with broad signals from the GONPs/CTAB, such as the band at ∼21.46° that can be attributed to the ordering in the plane of the CTAB bilayers with a Bragg space of 4.32214 Å.
These ordered multilayer structures allow the molecular interactions of the GONPs/CTABs from self-assembly by hydrophobic forces between the hydrocarbon tails of the CTAB and electrostatic attractions between the oxygen groups of the GO.
There may also be non-electrostatic contributions from the hydrophobic interactions between the tails of the CTAB and the graphitic patches of the GO because the surface of the GO mixes with the negative charge of the CTAB (thanks to the carboxyl groups, polar hydroxyls, and hydrophobic graphitic patches) is mixed with the positively charged CTAB.75
For the scattering intensity I(Q) of the GONPs/CTAB as a function of the scattering vector Q = 4π![[thin space (1/6-em)]](https://www.rsc.org/images/entities/char_2009.gif) sin(θ)/λ, where 2θ is the scattering angle and λ is the wavelength of the X-rays, the following dispersions are observed: for the GO with a Bragg space of 3.36311 Å and a Q = 3.6435 Å−1. The dispersions presented a dispersion intensity I(Q) according to the highest diffraction angle 2θ: GO 4% with a Bragg space of 4.13924 Å and a Q = 1.563861 Å−1; GO 6% with a Bragg space of 4.13537 Å and a Q = 1.512924 Å−1; GO 8% with a Bragg space of 4.13810 Å and a Q = 1.564292 Å−1; GO 10% with a Bragg space of 4.13737 Å presented a Q = 1.564568 Å−1; GO 12% with a Bragg space of 4.13605 Å and a Q = 1.538948 Å−1.
sin(θ)/λ, where 2θ is the scattering angle and λ is the wavelength of the X-rays, the following dispersions are observed: for the GO with a Bragg space of 3.36311 Å and a Q = 3.6435 Å−1. The dispersions presented a dispersion intensity I(Q) according to the highest diffraction angle 2θ: GO 4% with a Bragg space of 4.13924 Å and a Q = 1.563861 Å−1; GO 6% with a Bragg space of 4.13537 Å and a Q = 1.512924 Å−1; GO 8% with a Bragg space of 4.13810 Å and a Q = 1.564292 Å−1; GO 10% with a Bragg space of 4.13737 Å presented a Q = 1.564568 Å−1; GO 12% with a Bragg space of 4.13605 Å and a Q = 1.538948 Å−1.
Scanning electron microscopy and transmission electron microscopy analysis of GONPs/CTAB
Micrographs obtained by scanning electron microscopy (SEM) of graphene oxide particles (GONPs) modified with CTAB are depicted in Fig. 9. In Fig. 9a, graphene oxide powder (GO), occurs as aggregates with sheet sizes ranging between 0.216 and 0.440 μm. In Fig. 9b, the GONPs/CTABs in the 4% GO sample exhibit surfaces with lamellar contours, in contrast to the flaky surface observed in the GO 12% sample (Fig. 9d).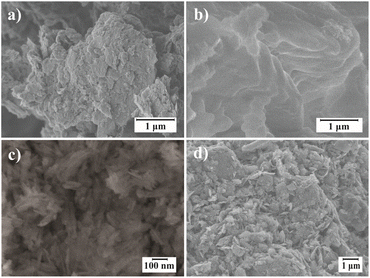 | ||
| Fig. 9 SEM micrographs: (a) pure GO; functionalization of GONPs/CTAB, (b) GO 4%, (c) GO 6%, (d) GO 12%. | ||
Fig. 9c, in the GO 6% sample, lamellar morphologies and a decrease in the sizes of the sheets were observed, which range between 76.9 and 123.5 nm.
The morphological differences between the different treatments are attributed to a more effective intercalation for the concentration of the 6% GO sample. Detailed particle size distribution profiles for each sample are provided in Fig. S2.†
In the case of the particle size analyzed by SEM, the GO/CTAB samples have been previously dried and therefore aggregation is observed due to their hydrophobic nature. Some authors,70 have found values of particle aggregates on the order of microns similar to those reported in this article.
These aggregated scaly structures are observed at lower GO concentrations because sp3-hybridized carbons attached to oxygen functional groups aid in the disorder and folding of monolayers, favoring this change. The intercalation of the CTAB between the nanosheets of the GO allowed the increase of the interlaminar space in the GO nanosheets as described in section Analysis XRD.70,76
In Fig. 10a and b, high-resolution TEM images of GONPs without CTAB and GONPs/CTAB are shown. In Fig. 10a, images of GONPs (GO 6% heat-treated to remove CTAB), shows regularly arranged layered structures obtained during treatment with ultrasonic waves that represented an flaking of the GO, dark regions are observed that are related to several GO nanosheets staked on top of each other's.61
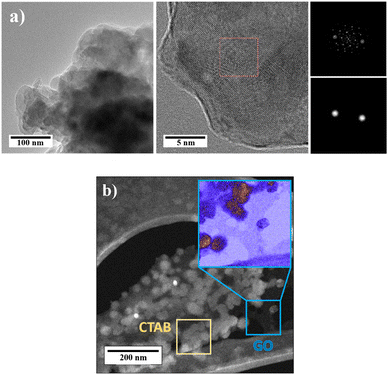 | ||
| Fig. 10 High-resolution transmission electron microscopy (HRTEM) image of GO 6%: (a) without CTAB (heat treated to remove CTAB) and (b) with CTAB 0.2 M. | ||
Also, the fast Fourier transform of the GO was observed where some stripes are shown that constitute a series of points that represent the atomic columns of the GO. The interplanar distance of the planes was 1.077 Å which corresponds to the (201) plane, taken over an average of 10 planes. In Fig. 10b, the GONPs/CTAB are observed between the carbon coated copper grids, where the CTAB surfactant with rounded morphologies can be seen dispersed how clear regions on the surface of the GONPs. The GO sheet exhibits a thin structure and is observed in a darker region.52
Scanning electron microscopy of PLA/GO nanocomposites
In Fig. 11, the external morphology of PLA and PLA/GO nanocomposites is shown. In Fig. 11a, a highly porous surface caused by the constant and efficient agitation of the emulsion with the mechanical stimuli caused by ultrasonic waves during the solidification of PLA in the PVA solution is observed.5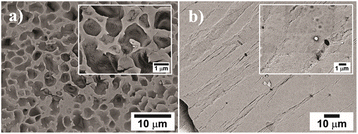 | ||
Fig. 11 SEM images of the surface morphology of nanocomposites: (a) PLA (2500× and 10![[thin space (1/6-em)]](https://www.rsc.org/images/entities/char_2009.gif) 000×) and (b) PLA/GO (1000× and 5000×). 000×) and (b) PLA/GO (1000× and 5000×). | ||
In Fig. 11b, the dispersion and adhesion of the reinforcement nanocomposites (GO) in the polymeric matrix can be seen, where the surface appears rough, characteristic of a homogeneous dispersion of the GONPs and of the strong interactions between the GO and the matrix polymeric by hydrogen bonding and attractive van der Waals forces.3 In addition, the modified GO could have more affinity with the hydrophobic properties of the polymer matrix for a more homogeneous distribution.77
The previous results show that the treatment of GO with CTAB is successful for a good distribution of the reinforcement in the polymeric matrix, which will allow an increase in the mechanical properties of the nanocomposite and, in the context of biomedical applications, the GO distributed in the PLA. It will facilitate cell adhesion and viability.
Flexural test
The mechanical characteristics of the scaffolds were evaluated by bending tests and the results are summarized in Table 4. The incorporation of graphene oxide (GO) nanoparticles in the polymer matrix exerted a noticeable influence on its stiffness, leading to a increase in both Young's moduli and maximum tensile stress. The latter is a crucial parameter for the scaffolds, to guarantee the integrity of the macroporous network.78 In particular, the inclusion of 0.1 wt% GO resulted in a 5% improvement in ultimate strength during this evaluation. The 3D biodegradable scaffolds made of graphene oxide/polylactic acid (PLA/GO), developed in this study, hold significant potential for use as supports in bone tissue regeneration. The unique combination of graphene oxide's properties and PLA's biodegradability creates a scaffold that promotes cellular adhesion, proliferation, and differentiation in a porous environment. These scaffolds, with controlled degradation over time, offer a promising solution for enhancing bone regeneration procedures in tissue engineering and regenerative medicine.11| Sample 3D scaffolds | Young's modulus (MPa) | Maximum resistance (MPa) |
|---|---|---|
| PLA | 2602.6 ± 286.1 | 71.7 ± 17.1 |
| PLA/GO | 2665.7 ± 290.3 | 75.3 ± 20.5 |
Conclusions
The photopyroelectric technique (PPE) determined the thermal behavior of GO, thanks to the transfer of heat from thermal diffusivity. The concentration of GO at 6% with a treatment by thermal irradiation of 30 min at 50 °C achieved homogeneous hydrodynamic diameters of the GONPs in a dispersant system where this concentration of NPs was better compared to the other concentrations studied. The presence of the surfactant CTAB was shown to form a bundle of colloids monolayers or NPs and surfaces through hydrogen bonding between the carboxyl (COOH) and hydroxyl (OH) groups of GO in order to produce hydrophobic interactions.This hydrophobic interaction significantly impacts the adsorption of the surfactant, allowing the non-agglomeration of NPs in the dispersion. It was also noted that the increase in the volume fraction of GONPs in the dispersion allowed for an increase in thermal diffusivity at 35 °C for 30 min in addition to the Z potential. This was due to the increase in electrostatic forces that overcome the interaction forces between the GO sheets which maintain the stability of the dispersion.
All GONPs/CTAB showed multilaminar stacking of GO and CTAB layers between the 5 and 40 Å ranges, and the spacing between layers could vary with the concentration of GO that was generated during mixing using ultrasonic irradiation. The morphological analyzes of the PLA/GO nanocomposites in comparison with the PLA matrix show that the previous treatment of GO with CTAB allowed a homogeneous distribution in the polymeric matrix, which improve the mechanical properties of the materials.
Author contributions
All authors contributed to the investigation, methodology, writing-original draft, writing – review & editing. The conceptualization were performed by Angela Sánchez-Cepeda, M. Carolina Pazos, Silva-Cote Ingrid, Efrén de Jesús Muñoz, and Ricardo Vera-Graziano.Conflicts of interest
There are no conflicts to declare, the authors declare that they have no known financial interests or personal relationships that could have in the work reported in this paper.Acknowledgements
We would like to thank the Pedagogical and Technological University of Colombia-UPTC for funding the project under grant MINCIENCIAS Acuerdo 757 – 2016, the collaboration of the Materials Research Institute of the National Autonomous University of Mexico and the academic technicians Adriana Tejeda, Omar Novelo, Josue Romero, Lourdes Bazan, Eliezer Hernandez and Miguel Ángel Canseco. PhD María de Lourdes Chávez and Ana Belén Reyes from the Ceramics Laboratory of the Faculty of Chemistry. The Photothermal Laboratory, the PhD Eduardo San Martín Martínez and PhD Rocio Casañas of the Center for Research in Applied Science and Advanced Technology of the National Polytechnic Institute CICATA-IPN of the City of Mexico.References
- W. Chananchana, P. Nuengmatcha and S. Chanthai, Role of Cetyltrimethyl Ammonium Bromide on Enhanced Adsorption and Removal of Alizarin Red S using Amino-Functionalized Graphene Oxide, 2017 Search PubMed.
- Y. Yang and W. Li, Russ. J. Electrochem., 2015, 51, 218–226 CrossRef CAS.
- M. Gong, Q. Zhao, L. Dai, Y. Li and T. Jiang, J. Asian Ceram. Soc., 2017, 5, 160–168 CrossRef.
- A. T. Smith, A. M. LaChance, S. Zeng, B. Liu and L. Sun, Nano Mater. Sci., 2019, 1, 31–47 CrossRef.
- A. M. Pinto, S. Moreira, I. C. Gonçalves, F. M. Gama, A. M. Mendes and F. D. Magalhães, Colloids Surf., B, 2013, 104, 229–238 CrossRef CAS PubMed.
- Ö. Güler and N. Bağcı, J. Mater. Res. Technol., 2020, 9, 6808–6833 CrossRef.
- F. Mindivan and M. Göktaş, Polym. Bull., 2020, 77, 1929–1949 CrossRef CAS.
- K. Tadyszak, J. K. Wychowaniec and J. Litowczenko, Nanomaterials, 2018, 8, 944 CrossRef PubMed.
- A. F. Verre, A. Faroni, M. Iliut, C. Silva, C. Muryn, A. Reid and A. Vijayaraghavan, Interface Focus, 2017, 8, 20180002 CrossRef PubMed.
- N. F. Zaaba and M. Jaafar, Polym. Eng. Sci., 2020, 60, 2061–2075 CrossRef CAS.
- L. González-Rodríguez, S. Pérez-Davila, R. Lama, M. López-Álvarez, J. Serra, B. Novoa, A. Figueras and P. González, RSC Adv., 2023, 13, 15947–15959 RSC.
- F. Mindivan and A. Çolak, J. Appl. Polym. Sci., 2021, 50768 CrossRef CAS.
- F. Mindivan, M. Göktaş and A. Dike, Polym. Compos., 2020, 41, 3707–3716 CrossRef CAS.
- F. Mindivan and M. Göktaş, Mater. Today: Proc., 2020, 27, 3119–3123 CAS.
- W. Guo, Y. Yang, C. Liu, W. Bu, F. Guo, J. Li, E. Wang, Z. Peng, H. Mai, H. You and Y. Long, J. Mech. Behav. Biomed. Mater., 2023, 142, 105848 CrossRef CAS PubMed.
- Y. Li, C. Liao and S. C. Tjong, Nanomaterials, 2019, 9, 590 CrossRef CAS PubMed.
- R. Li, Y. Wang, J. Du, X. Wang, A. Duan, R. Gao, J. Liu and B. Li, Sci. Rep., 2021, 11, 1725 CrossRef CAS PubMed.
- A. Popov, R. Aukstakojyte, J. Gaidukevic, V. Lisyte, A. Kausaite-Minkstimiene, J. Barkauskas and A. Ramanaviciene, Sensors, 2021, 21, 948 CrossRef CAS PubMed.
- A. Ferrer-Ugalde, S. Sandoval, K. R. Pulagam, A. Muñoz-Juan, A. Laromaine, J. Llop, G. Tobias and R. Núñez, ACS Appl. Nano Mater., 2021, 4, 1613–1625 CrossRef CAS.
- Z. Lv, Q. Wang and M. Yang, Microchim. Acta, 2021, 188, 7 CrossRef CAS PubMed.
- F. Mindivan, Ü. D. Gül and M. Göktaş, J. Vinyl Addit. Technol., 2021, 27, 485–496 CrossRef CAS.
- M. Li, Q. Liu, Z. Jia, X. Xu, Y. Cheng, Y. Zheng, T. Xi and S. Wei, Carbon, 2014, 67, 185–197 CrossRef CAS.
- Q. Liu, W. Luo, Y. Chen, H. Zou and M. Liang, Enhanced Mechanical and Thermal Properties of CTAB-Functionalized Graphene Oxide-Polyphenylene Sulfide Composites, 2016 Search PubMed.
- D. Chen, H. Feng and J. Li, Graphene Oxide: Preparation, Functionalization, and Electrochemical Applications, 2012 Search PubMed.
- L. Cui, X. Guo, Q. Wei, Y. Wang, L. Gao, L. Yan, T. Yan and B. Du, J. Colloid Interface Sci., 2015, 439, 112–120 CrossRef CAS PubMed.
- A. Bedoya, S. Alvarado, A. Calderón and E. Marín, Thermochim. Acta, 2018, 666, 190–196 CrossRef CAS.
- C. Neamtu, D. Dadarlat, M. Chirtoc, A. H. Sahraoui, S. Longuemart and D. Bicanic, Instrum. Sci. Technol., 2006, 34, 225–234 CrossRef CAS.
- E. M. Moares, in Transworld Research, Kerala, India, 2009, vol. 3, pp. 1–27 Search PubMed.
- E. M. Moares, in Transworld Research, Kerala, India, 2009, vol. 4, ch. Recent developments in thermal wave interferometry for gas analysis, pp. 99–123 Search PubMed.
- A. M. A. Mandelis, Research Signpost, Kerala, India, 2007, p. 61 Search PubMed.
- M. Noroozi and A. Zakaria, Nanofluid Heat Mass Transfer Eng. Probl., 2017, 65–93, DOI:10.5772/65789.
- W. Meng, E. Gall, F. Ke, Z. Zeng, B. Kopchick, R. Timsina and X. Qiu, J. Phys. Chem. C, 2015, 119, 21135–21140 CrossRef CAS.
- D. G. Papageorgiou, I. A. Kinloch and R. J. Young, Carbon, 2015, 95, 460–484 CrossRef CAS.
- K. Kakaei and K. Hasanpour, J. Mater. Chem. A, 2014, 2, 15428–15436 RSC.
- B. Lian, J. Deng, G. Leslie, H. Bustamante, V. Sahajwalla, Y. Nishina and R. K. Joshi, Carbon, 2017, 116, 240–245 CrossRef CAS.
- Y. Nisina, A. Saito and S.-i. Yamamoto, Fine Tuning of Sheet Distance of Graphene Oxide that Affect the Substrate Selectivity of Pd/Graphene Oxide Catalyst in Heck Reaction, 2014 Search PubMed.
- J. Li, D. Miao, R. Yang, L. Qu and P. d. B. Harrington, Electrochim. Acta, 2014, 125, 1–8 CrossRef CAS.
- Y. Zhao, K.-N. Sun, W.-L. Wang, Y.-X. Wang, X.-L. Sun, Y.-J. Liang, X.-N. Sun and P.-F. Chui, Ceram. Int., 2013, 39, 7627–7634 CrossRef CAS.
- A. M. Díez-Pascual and A. L. Díez-Vicente, ACS Appl. Mater. Interfaces, 2016, 8, 17902–17914 CrossRef PubMed.
- J. A. Balderas-López, M. R. Jaime-Fonseca, G. Gálvez Coyt, A. Muñoz-Diosdado, J. A. Pescador, J. Díaz-Reyes and B. E. Chávez-Sandoval, Int. J. Thermophys., 2018, 39, 111 CrossRef.
- S. M. S. Murshed, K. C. Leong and C. Yang, J. Phys. D: Appl. Phys., 2006, 39, 5316–5322 CrossRef CAS.
- A. Ali and B. Salam, SN Appl. Sci., 2020, 2, 1636 CrossRef CAS.
- A. Ghadimi, R. Saidur and H. S. C. Metselaar, Int. J. Heat Mass Transfer, 2011, 54, 4051–4068 CrossRef CAS.
- J. William and D. Callister, Editorial Reverté, S.A., 2007, Tercera Edición, pp. 99–105 Search PubMed.
- K. Das, S. Maiti, M. Ghosh, D. Mandal and P. K. Das, J. Colloid Interface Sci., 2013, 395, 111–118 CrossRef CAS PubMed.
- X. Mu, X. Wu, T. Zhang, D. B. Go and T. Luo, Sci. Rep., 2014, 4, 3909 CrossRef PubMed.
- K. Tadyszak, J. K. Wychowaniec and J. Litowczenko, Nanomaterials, 2018, 8(11), 944 CrossRef PubMed.
- H. Shen, L. Zhang, M. Liu and Z. Zhang, Theranostics, 2012, 2, 283–294 CrossRef CAS PubMed.
- L. Yang, J. Xu, K. Du and X. Zhang, Powder Technol., 2017, 317, 348–369 CrossRef CAS.
- B.-B. Feng, Z.-H. Wang, W.-H. Suo, Y. Wang, J.-C. Wen, Y.-F. Li, H.-L. Suo, M. Liu and L. Ma, Mater. Res. Express, 2020, 7, 095009 CrossRef CAS.
- W. Fan, X. Jiang, Y. Lu, M. Huo, S. Lin and Z. Geng, J. Environ. Sci., 2015, 35, 12–19 CrossRef CAS PubMed.
- E. Vaghri, D. Dorranian and M. Ghoranneviss, Mater. Chem. Phys., 2017, 203, 235–242 CrossRef.
- H. Zhang, S. Wang, Y. Lin, M. Feng and Q. Wu, Appl. Therm. Eng., 2017, 119, 132–139 CrossRef CAS.
- M. Hadadian, E. Goharshadi and A. Youssefi, Electrical Conductivity, Thermal Conductivity, and Rheological Properties of Graphene Oxide-Based Nanofluids, 2014 Search PubMed.
- A. C. Ferrari, Solid State Commun., 2007, 143, 47–57 CrossRef CAS.
- A. C. Ferrari, J. C. Meyer, V. Scardaci, C. Casiraghi, M. Lazzeri, F. Mauri, S. Piscanec, D. Jiang, K. S. Novoselov, S. Roth and A. K. Geim, Phys. Rev. Lett., 2006, 97, 187401 CrossRef CAS PubMed.
- N. Dubey, R. Bentini, I. Islam, T. Cao, A. H. Castro Neto and V. Rosa, Stem Cells Int., 2015, 2015, 804213 Search PubMed.
- T. Kuila, S. Bose, A. K. Mishra, P. Khanra, N. H. Kim and J. H. Lee, Prog. Mater. Sci., 2012, 57, 1061–1105 CrossRef CAS.
- S. Claramunt, A. Varea, D. López-Díaz, M. M. Velázquez, A. Cornet and A. Cirera, J. Phys. Chem. C, 2015, 119, 10123–10129 CrossRef CAS.
- A. Lee, K. Yang, D. A. Nguyen, C. Park, S. Lee, T. Lee and M. S. Jeong, Appl. Surf. Sci., 2021, 536, 147990 CrossRef CAS.
- H.-K. Jeong, Y. P. Lee, R. J. W. E. Lahaye, M.-H. Park, K. H. An, I. J. Kim, C.-W. Yang, C. Y. Park, R. S. Ruoff and Y. H. Lee, J. Am. Chem. Soc., 2008, 130, 1362–1366 CrossRef CAS PubMed.
- K. N. Kudin, B. Ozbas, H. C. Schniepp, R. K. Prud'homme, I. A. Aksay and R. Car, Nano Lett., 2008, 8, 36–41 CrossRef CAS PubMed.
- K. Krishnamoorthy, M. Veerapandian, K. Yun and S. J. Kim, Carbon, 2013, 53, 38–49 CrossRef CAS.
- J. I. Paredes, S. Villar-Rodil, P. Solís-Fernández, A. Martínez-Alonso and J. M. D. Tascón, Langmuir, 2009, 25, 5957–5968 CrossRef CAS PubMed.
- M. S. Dresselhaus, A. Jorio, M. Hofmann, G. Dresselhaus and R. Saito, Nano Lett., 2010, 10, 751–758 CrossRef CAS PubMed.
- A. C. Ferrari and J. Robertson, Phys. Rev. B: Condens. Matter Mater. Phys., 2000, 61, 14095–14107 CrossRef CAS.
- G. Lalwani, X. Cai, L. Nie, L. V. Wang and B. Sitharaman, Photoacoustics, 2013, 1, 62–67 CrossRef PubMed.
- A. Romero, M. P. Lavin-Lopez, L. Sanchez-Silva, J. L. Valverde and A. Paton-Carrero, Mater. Chem. Phys., 2018, 203, 284–292 CrossRef CAS.
- F. Mindivan, Mater. Test., 2017, 59, 729–734 CrossRef CAS.
- E. Vaghri, D. Dorranian and M. Ghoranneviss, Mater. Chem. Phys., 2018, 203, 235–242 CrossRef CAS.
- O. Cech, O. Klvac, P. Benesova, J. Maca, P. Cudek and P. Vanýsek, J. Energy Storage, 2019, 22, 373–377 CrossRef.
- F. Mindivan, Mater. Test., 2017, 59, 729–734 CrossRef CAS.
- M. Li, Y. Wang, Q. Liu, Q. Li, Y. Cheng, Y. Zheng, T. Xi and S. Wei, J. Mater. Chem. B, 2013, 1, 475–484 RSC.
- N. Rezazadeh, S. Danesh, M. Eftekhari and M. Farahmandzadeh, J. Mol. Liq., 2022, 368, 120720 CrossRef CAS.
- W. Meng, E. Gall, F. Ke, Z. Zeng, B. Kopchick, R. Timsina and X. Qiu, J. Phys. Chem. C, 2015, 119, 21135–21140 CrossRef CAS.
- K. Zhang, L. Mao, L. L. Zhang, H. S. On Chan, X. S. Zhao and J. Wu, J. Mater. Chem., 2011, 21, 7302–7307 RSC.
- S. Park and R. S. Ruoff, Nat. Nanotechnol., 2009, 4, 217–224 CrossRef CAS PubMed.
- M. Navarro, C. Aparicio, M. Charles-Harris, M. P. Ginebra, E. Engel and J. A. Planell, in Ordered Polymeric Nanostructures at Surfaces, ed. G. J. Vancso, Springer Berlin Heidelberg, Berlin, Heidelberg, 2006, pp. 209–231, DOI:10.1007/12_068.
Footnotes |
| † Electronic supplementary information (ESI) available. See DOI: https://doi.org/10.1039/d3ra04689c |
| ‡ Deceased 25 June 2019. |
| This journal is © The Royal Society of Chemistry 2024 |

