 Open Access Article
Synthesis of CuSe/PVP/GO and CuSe/MWCNTs for their applications as nonenzymatic electrochemical glucose biosensors†
Junaid Yaseena,
Farhat Saira *b,
Muhammad Imran
 c,
Mehwish Fatimad,
Hafiz Ejaz Ahmeda,
Muhammad Zeewaqar Manzoora,
Momna Rasheeda,
Iqbal Nisab,
Khalid Mehmoode and
Zahida Batool
 *a
*a
aInstitute of Physics, The Islamia University of Bahawalpur, Pakistan. E-mail: zahida.batool@iub.edu.pk
bNanoscience and Technology Development, National Center for Physics (NCP), Pakistan. E-mail: farhat.saira@ncp.edu.pk
cChemistry Department, Faculty of Science, King Khalid University, P.O. Box 9004, Abha 6141, Saudi Arabia
dDepartment of Physics, Science Unit, Deanship of Educational Services, Qassim University, Saudi Arabia
eDepartment of Physics, Government College University, Faisalabad, Pakistan
First published on 26th February 2024
Abstract
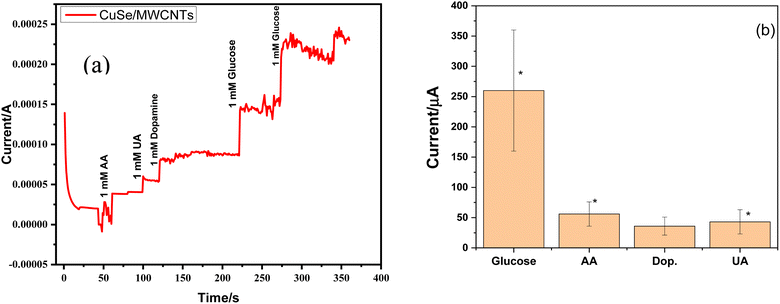
Copper selenide (CuSe) is an inorganic binary compound which exhibits metallic behavior with zero band gap. CuSe has multiple applications in electrocatalysis, photothermal therapy, flexible electronic and solar cells. In the current study, copper selenide based nanocomposites CuSe/PVP/GO and CuSe/MWCNTs were synthesized by using the sol–gel method for application as a non-enzymatic glucose biosensor. Different characterization methods were employed, such as X-ray diffraction (XRD), photoluminescence (PL), Fourier transform infrared spectroscopy (FTIR), ultraviolet-visible (UV-Vis) spectroscopy, and photoluminescence for determining various aspects of CuSe/PVP/GO and CuSe/MWCNTs nanocomposites including phase formation, functional group analysis, band gaps and morphology. Electrochemical impedance spectroscopy (EIS) showed that the resistances of modified electrode/bare electrode were 12.3 kΩ/17.3 kΩ and 6.3 kΩ/17.3 kΩ for CuSe/PVP/GO and CuSe/MWCNTs nanocomposites, respectively. Cyclic voltammetry showed that both CuSe/PVP/GO and CuSe/MWCNTs nanocomposites are promising biosensors for detection and monitoring of the glucose level in an analyte. The sensitivity and limit of detection are 2328 μA mM−1 cm−2/0.2 μM and 4157 μA mM−1 cm−2/0.3 μM for CuSe/PVP/GO and CuSe/MWCNTs, respectively. Chronoamperometry confirmed that our nanocomposite was the best sensor for glucose even in the presence of other interferents like ascorbic acid (AA), uric acid (UA) and dopamine (DA).
1. Introduction
Nanomaterials exhibit remarkable electrical, mechanical, optical, and chemical properties. Nanotechnology has vast potential applications in various applied fields.1–15 Among these applications, nanomedicine stands out as a rapidly advancing field, holding promise for revolutionary developments in medical treatments. Notably, nanomaterials find significant application in manufacturing sensors for detecting biomolecules, drugs, heavy metals, facilitating early diagnosis of medical conditions, and enabling bioimaging.16–35Diabetes, being a prevalent chronic disease affecting 1.5 million individuals globally, poses significant health challenges, leading to complications like blindness, renal failure, and nerve degeneration. Predicted data indicates that diabetes may surpass heart disease as the seventh leading cause of death by 2030. Continuous blood glucose monitoring is crucial for early diabetes diagnosis and effective treatment.29 Biosensors play a critical role as analytical devices, which detect and measure glucose levels in vitro. These devices find application in industrial control, clinical diagnostics, drug development, food analysis, and biochip studies.17–20 Commonly used enzymatic glucose biosensors, applied for measuring glucose in blood, suffer from drawbacks such as low sensitivity, non-reusability and instability because of the presence of enzyme glucose oxidase. As the enzymes are sensitive to pH and temperature change, their performance can vary according to conditions. In this regard third generation biosensors based on nanomaterials as non-enzymatic sensing element are under extensive investigation. These non-enzymatic glucose sensors based on various materials like metal nanoparticles and carbon compounds, has gained prominence due to its advantages, including sensitivity, rapid detection, low cost, and long-term stability. Graphene, a carbon-based nanomaterial with a high surface area of approximately 2600 m2 g−1, has shown significant progress in detecting biomolecules. Composites with graphene, such as graphene-based polymer nanocomposites and graphene oxide nanocomposites decorated with various nanoparticles, have been employed by many researchers for glucose sensing.22–24 Another carbon-based nano-material i.e., carbon nanotubes (CNTs), known for their excellent conductivity and high surface area, have garnered attention, especially in non-enzymatic glucose sensing when combined with metal nanoparticles.29,31–33 Copper-based nanomaterials, valued for their electrocatalytic performance, stability, and cost-effectiveness, have seen application in various composites. Literature reports are available for CuS, CuO, CuO–ZnO, CuO/polymer, CuSe and their alloys for biosensing applications.1,2,12,14–16,19,21,25,26 Transition metal chalcogenides (TMC) are recently gaining interest because of their advantage of less anion electronegativity and high degree of covalency which in turn enhances the capability of electrocatalytic activity.10 Current study is a novel and inclusive investigation of CuSe, graphene oxide, MWCNTs and PVP nanocomposites for glucose biosensing. Recent studies indicate that CuSe exhibits superior electrocatalytic performance compared to oxides, with the potential to enhance catalytic activity through variations in shapes, phases, and combining ratios of CuSe precursors. TMC of Ni were recently tested for their electrocatalytic activity and it was found that oxides to telluride catalytic activity is enhanced.10 Current study focuses on synthesis and application of CuSe-based nanocomposites i.e., CuSe/PVP/GO and CuSe/MWCNTs for evaluating electroactivity, performance as glucose biosensors. Characterization of the nanocomposites involves various techniques, including XRD, FTIR, UV-visible spectroscopy, PL, SEM, and EDX analysis. The developed biosensors undergo was analyzed for its stability, sensitivity, linear range, limit of detection (LOD), and electrochemical impedance spectroscopy (EIS). Nanocomposite provided high sensitivity of 4157 μA mM−1 cm−2 and wide linear range.
2. Methodology
2.1 Materials and chemicals
Copper selenide, polyvinyl propylene (PVP) and graphene oxide (GO) composite was synthesized by sol gel method in which copper sulphate pentahydrate, selenium powder, PVP and graphite powder were utilized. Selenium powder (99.9% purity), copper sulphate pentahydrate (99.9%) and graphite powder, PVP were obtained from Sigma-Aldrich. All these constituents were used as elementary components to prepare copper selenide, PVP and GO composite. The composite was synthesized in dimethylformamide (DMF), having purity >99% was acquired from Sigma-Aldrich. Ammonia (NH3) was used for monitoring the pH, obtained from Sigma-Aldrich.2.2 Instrumentation
The crystal phases of the produced nanocomposites were examined using a powder X-ray diffractometer (Bruker the D-8 Advanced Laboratory Diffractometer) with Cu–K radiations [=1.5406 Å] in the range of 2θ = 10° to 75°. FT-IR spectra recorded surface functional groups on a Bruker Tensor-27 FT-IR spectrophotometer in the spectral range 500–4000 cm−1 by using KBr pellets. The functional groups were identified by the study of FTIR. Optical measurements were studied in the range of wavelength as 200–800 nm by Cecil-7400 UV-Vis spectrophotometer. Therefore, optical properties of CuSe/PVP/GO were studied by this technique. In order to examine the outcome of photogenerated holes and electrons in a semiconductor, photoluminescence emission spectra were initially developed. The SEM technique is used to examine the prepared sample's micro structure image. ZEISS Sigma 500VP, equipped with EDX unit was utilized to get images of nanocomposite along with elemental composition.2.3 Synthesis of CuSe/PVP/GO and CuSe/MWCNTs nanocomposite
For synthesis of CuSe/PVP, 50 ml of DMF and 0.125 g of copper sulphate pentahydrate [CuSO4·5H2O] were added to a beaker. The beaker was place on hot plate and then started stirring with a magnetic stirrer for around 1 hour while removing the beaker from the heat. Aluminum foil was used to keep the pressure on the beaker. The solution was kept on continuous stirring until CuSO4·5H2O completely dissolved in the solvent. After that, 0.05 g of selenium powder was added to above solution and stirred for an hour. A moderate aqua coloured solution obtained. Added 0.05 g of PVP to this solution and stirred for 20 minutes at 90 °C. This temperature was maintained for three hours, and the selenium liquefied into a combination. Finally, a dark-colored precipitate obtained. Now, 0.05 g of GO was added in 100 ml beaker containing 20 ml water. In above solution dimethylformamide (DMF) was added along with mixing 0.1 g of CuSe/PVP. Then, solution kept on stirring for 60 minutes. pH was maintained with of help of ammonia (NH3). Then, 100 °C temperature was applied until precipitates were obtained. Then precipitates were ground and dried in oven at 200 °C for 3 h to obtain final product.For synthesis of CuSe/MWCNTs, 0.15 g of copper sulphate penta hydrate was added in 10 ml distilled water and dissolved thoroughly. Then 2.5 ml of the ammonium hydroxide added in above solution and heated at 80 °C. Further 0.15 g of selenium powder was added in above solution and pH was sustained at 9 as moderate basic media is required for reaction to proceed. After this, the solution was diluted till 20 ml. Then, 0.05 g of carbon nanotubes dispersed in the 50 ml water and added in above solution by stirring. Then transferred this mixture suspension into beaker and placed the beaker on hotplate at temperature 80 °C for about 60 minutes. When precipitates formed the solution was cooled down and precipitates were washed and dried in heating oven at 200 °C for 3 hours.
3. Results and discussion
3.1 XRD analysis
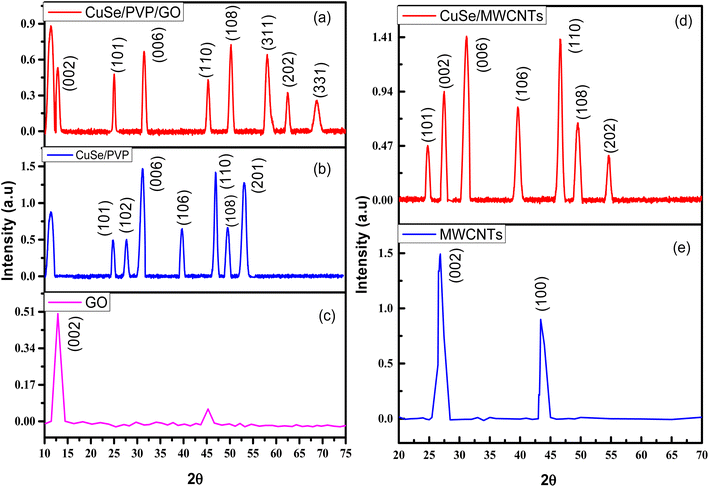
The phases and crystal structures of CuSe/PVP and CuSe/PVP/GO nanocomposite were carried out by the XRD analysis. The XRD peaks of CuSe were at 24.88°, 27.76°, 31.18°, 39.08°, 46.01°, 49.65° and 53.68° and planes relevant to them were (101), (102), (006), (106), (110), (108) and (201) respectively and all these peaks were related to the JCPD card number 34-0171(ref. 1 and 2) and peak at 11.31 was due to the presence of PVP as shown in Fig. 1(b). The XRD pattern of CuSe/PVP/GO nanocomposite in Fig. 1(a) exhibited diffraction peaks at Bragg's angles (2θ) of 25.03°, 31.50°, 45.32°, 50.21°, 58.11°, 62.49° and 68.75° were related to the JCPDS card number 34-0171 of CuSe and planes related to these peaks were (101), (006), (110), (108), (311), (202) and (331) and structure is hexagonal1 as shown in Fig. 1(a). The peaks of CuSe that were seen in the XRD pattern of the nanocomposite showed that it still maintained crystallinity in the nanocomposite and its main peak at 31.50° and plane (101) gives the evidence of presence of CuSe in composite.2 The diffracted peak at 11.31° is due to PVP and peak at 12.85 is due to GO and its plane is (002).The peaks of CuSe/MWCNTs nanocomposite that diffracted at angles of 24.79°, 27.40°, 31.10°, 39.64°, 46.63°, 49.51° and 54.63° and the planes relevant to them were (101), (002), (006), (106), (110), (108) and (202) respectively as shown in Fig. 1(d). All the peaks of CuSe were according to the JCPDS 34-0171(ref. 1) except at 27.40° which was due to the MWCNTs and its plane is (002) which was confirmed in Fig. 1(e). Structure of sample according to this card number is hexagonal.
The lattice parameters of CuSe/PVP/GO were a = b= 5.481 (Å) and c = 15.81 (Å) which were related to the literature1 and cell volume of CuSe/PVP/GO nanocomposite was 411.5 (Å3). Similarly, the lattice parameters of CuSe/MWCNTs a = b= 3.981 (Å) and c = 15.81 (Å) and cell volume was 226.5 (Å3). The average crystallite size and interplanar spacing of Cuse/PVP/GO and CuSe/MWCNTs nanocomposite was calculated by the Scherrer formula
 | (1) |
3.2 FTIR analysis
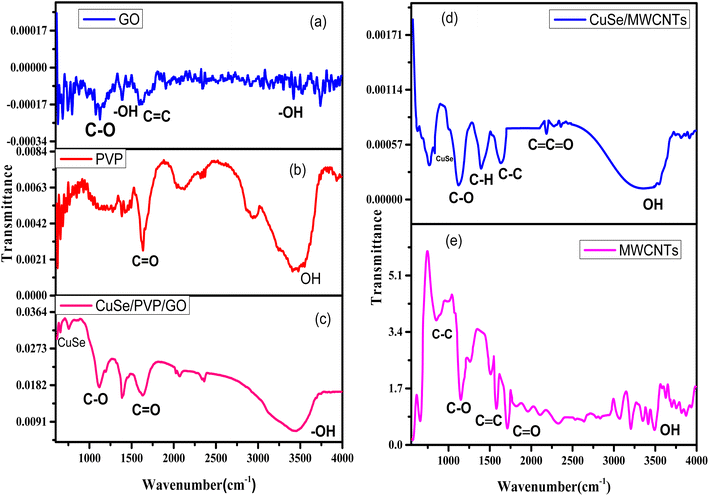
FTIR spectra of composite CuSe/PVP/GO is shown in following Fig. 2(c). For GO, there was a characteristics absorption band at 3435 cm−1 due to OH vibration (stretching) of C–OH group which was in the range given in the literature.1 This functional group make sure that GO is dispersed in the water.3 A band was observed at 1638–1639 cm−1 due to C![[double bond, length as m-dash]](https://www.rsc.org/images/entities/char_e001.gif) C bonding showing aromatic vibration.1 There is OH stretching present in the PVP as shown in Fig. 2(b) and also gives the evidence of its presence in nanocomposite CuSe/PVP/GO as shown in Fig. 2(c) and C
C bonding showing aromatic vibration.1 There is OH stretching present in the PVP as shown in Fig. 2(b) and also gives the evidence of its presence in nanocomposite CuSe/PVP/GO as shown in Fig. 2(c) and C![[double bond, length as m-dash]](https://www.rsc.org/images/entities/char_e001.gif) O bond in the range 1640–1660 cm−1 in Fig. 2(b) and (c) which confirm the presence of PVP. A peak at 704 cm−1 in Fig. 2(c) the spectrum shows the nitrate group. A band at 1109 cm−1 was also observed due to the vibration of C–O bond and this peak also confirm the formation of composite CuSe/GO.1 The presence of CuSe can be attributed to the absorption peak at 617 cm−1 which is near to the value given in the literature.1
O bond in the range 1640–1660 cm−1 in Fig. 2(b) and (c) which confirm the presence of PVP. A peak at 704 cm−1 in Fig. 2(c) the spectrum shows the nitrate group. A band at 1109 cm−1 was also observed due to the vibration of C–O bond and this peak also confirm the formation of composite CuSe/GO.1 The presence of CuSe can be attributed to the absorption peak at 617 cm−1 which is near to the value given in the literature.1
In Fig. 2(d), the peak at 1390 cm−1 showed the C–H bending bonds of nanotubes.9 The peak at 2160 cm−1 is due to the C![[double bond, length as m-dash]](https://www.rsc.org/images/entities/char_e001.gif) O stretching of carboxyl group C
O stretching of carboxyl group C![[double bond, length as m-dash]](https://www.rsc.org/images/entities/char_e001.gif) C
C![[double bond, length as m-dash]](https://www.rsc.org/images/entities/char_e001.gif) O.10 There is a band at 823 cm−1 which represented the presence of CuSe.11 The peak of absorption at 620 cm−1 is due to the presence of CuSe.1 All the CuSe composites show C
O.10 There is a band at 823 cm−1 which represented the presence of CuSe.11 The peak of absorption at 620 cm−1 is due to the presence of CuSe.1 All the CuSe composites show C![[triple bond, length as m-dash]](https://www.rsc.org/images/entities/char_e002.gif) N stretching of nitrates in the range 2435–2280 cm−1. There is free OH stretching at 3435 cm−1.12 There is peak at 1145 cm−1 which is due to C–O.13
N stretching of nitrates in the range 2435–2280 cm−1. There is free OH stretching at 3435 cm−1.12 There is peak at 1145 cm−1 which is due to C–O.13
In Fig. 2(e), OH stretching shown in the FTIR of MWCNTs.12 The absorption peak at 1735 cm−1 is relating to C![[double bond, length as m-dash]](https://www.rsc.org/images/entities/char_e001.gif) O stretching of COOH, peak at 1569 cm−1 is due to C
O stretching of COOH, peak at 1569 cm−1 is due to C![[double bond, length as m-dash]](https://www.rsc.org/images/entities/char_e001.gif) C, peak at 1159 cm−1 is due to C–O.13
C, peak at 1159 cm−1 is due to C–O.13
3.3 UV visible spectroscopy
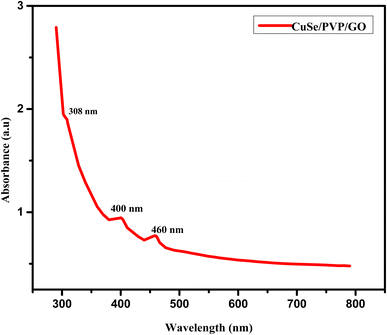
For GO spectra, in Fig. 3, there is a peak at 308 nm which is due to C![[double bond, length as m-dash]](https://www.rsc.org/images/entities/char_e001.gif) O bond that is ascribed to n–π* transitions.14 Another absorption peak at 400 nm was observed in spectra which shows that CuSe is also present in this composite and absorption peak at 460 nm shown in Fig. 3 gives the evidence of CuSe/GO nanocomposite.
O bond that is ascribed to n–π* transitions.14 Another absorption peak at 400 nm was observed in spectra which shows that CuSe is also present in this composite and absorption peak at 460 nm shown in Fig. 3 gives the evidence of CuSe/GO nanocomposite.
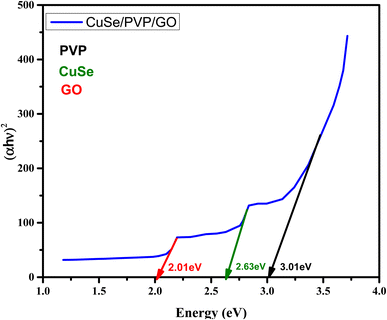
Using the relationship between ‘hν’ and ‘αhν’ value of bandgap ‘Eg’ is estimated.
| A(hν − Eg)n = αhν | (2) |
3.4 Photoluminescence spectra
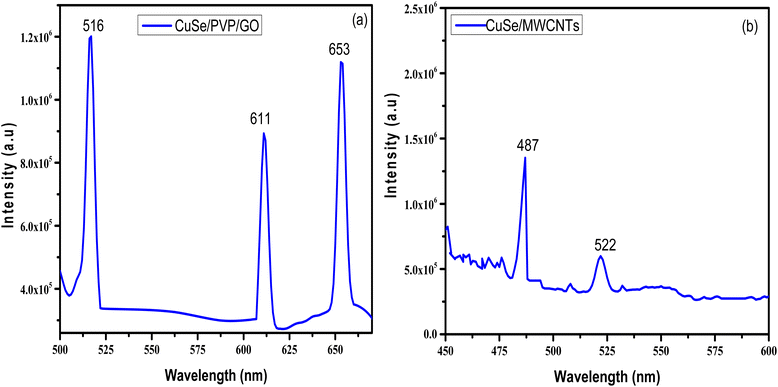
PL emission results from recombination of the free charge carriers. At the excitation of 420 nm, the presence of intrinsic point defects of such copper vacancies, the interstitials, and the antistites which are typically located near the surface of the CuSe NPs is indicated by the relatively faint green emission that was recorded at 516 nm. There is another emission observed at 611 nm is due to the relaxation of electrons from conduction band to valence band of CuSe NPs as they were generated.4,13 Around 650 nm, the PL of GO occurs and is fixed. The PL emission may be caused by localized states brought on by structural disturbance.The PL spectrum at the excitation wavelength of 300 nm gives a structured band at near about 487 nm which is due to multi-walled carbon nanotubes13 as shown in Fig. 5(b). The emission that was detected at 522 nm points to the presence of intrinsic point defects, such as the interstitials, copper vacancies, and antistites, which are normally found close to the surface of the CuSe NPs.
3.5 SEM and EDX analysis
The Fig. 6(a) showed SEM of CuSe/PVP/GO nanocomposite in which sheets confirmed the presence of GO. For CuSe, Fig. 6(a) showed the crystals with different geometries and the shapes.14,15 Morphology is effected by the presence of polymer. Also, in Fig. 6(b) EDX of CuSe/PVP/GO nanocomposite, the carbon and nitrogen confirmed the presence of GO and PVP respectively. Representation of copper and selenium gives the evidence of presence of copper selenide.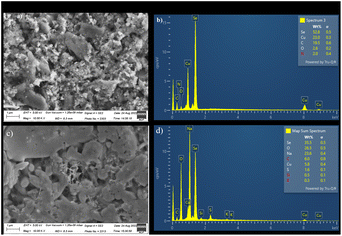 | ||
| Fig. 6 (a) and (b): SEM (a) EDX (b) of CuSe/PVP/GO. (c) and (d): SEM (c) and EDX (d) of CuSe/MWCNTs. | ||
SEM image of CuSe/MWCNTs showed multi-walled carbon nanotubes in the form of tangled tubes at magnification of 10.00k in Fig. 6(c). For CuSe, Fig. 6(c) showed the crystals and spheres with different geometries and the shapes.14,15 And their presences is also confirmed by the EDX as shown in Fig. 6(d).
3.6 Electrochemical glucose oxidation
Electrochemical measurements were conducted in a three-electrode cell with a reference electrode of Ag/AgCl, a counter electrode of platinum wire, and a working electrode of glassy carbon (GCE). A 0.1 M NaOH solution served as the electrolyte, and the potential was scanned within the range of 0.5 to 1.5 V for various experiments.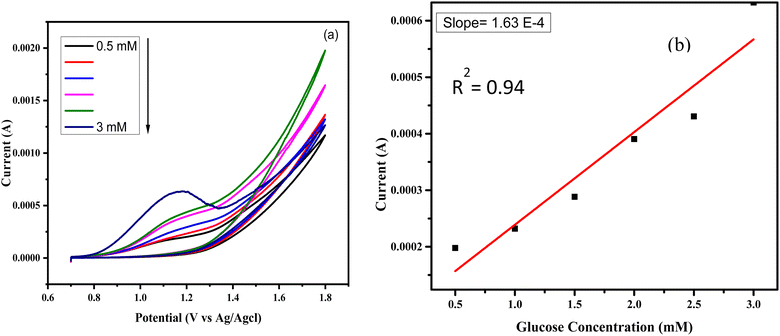 | ||
| Fig. 7 (a) CuSe/PVP/GO responses against different concentration of glucose (b) calibration plot of anodic maximum current vs. the concentration of glucose. | ||
The Fig. 7(b) showed the calibration plot which is constructed between the anodic peak current and the glucose concentrations. The value of sensitivity shown in Fig. 7 obtained a 2328 μA mM−1 cm−2 which is very close and higher to CuSe/PVP nanocomposite for glucose sensing. The limit of detection obtained as 0.2 μM and can be calculated by using the formula as LOD = 3σ/s. Where, σ is the standard deviation obtained from blank signals and s is the value of slope obtained from the calibrated plot.26 The limit of quantification for sensitivity at lower glucose concentrations was 0.8 μM. From literature as in Table 1, it was clear that our nanocomposite gives better value of sensitivity even at lower concentrations of glucose. Hence, our material was more sensitive.
| Modified electrode | Sensitivity | Limit of detection | Linear range | References |
|---|---|---|---|---|
| CuSe/GCE | 15![[thin space (1/6-em)]](https://www.rsc.org/images/entities/char_2009.gif) 341 μA mM−1 cm−2 341 μA mM−1 cm−2 |
0.26 μM | — | 16 |
| AuNP/PVP/PANI/GCE | 9620 μA mM−1 cm−2 | 1.0 × 10⁻⁵ M | 0.05–2.5 mM | 18 |
| CuSe/GCE | 19![[thin space (1/6-em)]](https://www.rsc.org/images/entities/char_2009.gif) 419 μA mM−1 cm−2 419 μA mM−1 cm−2 |
0.196 μM | 100 nM to 40 μM | 19 |
| GO/AuNP/GCE | 42 μA mM−1 cm−2 | — | 0.3–20 mM | 20 |
| CuSe/rGO | 536 μA mM−1 cm−2 | 0.05 mM | 3.375 mM | 21 |
| CS–Fc/GO/Gox/GCE | 10 μA mM−1 cm−2 | 7.6 μM | 0.02–6.78 mM | 22 |
| GO–COOAu/GCE | 20.218 μA mM−1 cm−2 | 6 μM | 0.02–4.48 mM | 23 |
| CoMn2O4 NSs/rGO | 6830.5 μA mM−1 cm−2 | — | 0.1–30 mM | 24 |
| Cu2O/Au/GO | 2886 μA mM−1 cm−2 | 2.47 μM | 16.65 mM | 26 |
| Cu/rGO | 172 μA mM−1 cm−2 | 65 μM | 0.1–12.5 mM | 27 |
| Au/CNTs | 2.28 μA mM−1 cm−2 | 0.19 μM | 0.1–3 mM | 28 |
| fGO/Fe3O4/PANI | — | 0.01 μM | 0.05 μM to 5 mM | 29 |
| CuSe/PVP/GO | 2328 μA mM−1 cm−2 | 0.2 μM | 0.5–3 mM | This work |
Similarly, the electrochemical study of another sample named as CuSe/MWCNTs was done for glucose sensing by the cyclic voltammetry. All the parameters were same but here potential window was changed and oxidation of current was studied at different concentrations of glucose at once. Behavior of anodic current at various concentrations of glucose is shown in Fig. 8(a), and Fig. 8(b) shows the calibration curve which is constructed by plotting between the anodic peak current and the glucose concentrations. The sensitivity of CuSe/MWCNTs nanocomposite obtained as 4157 μA mM−1 cm−2. The value of LOD by using formula34,35 and LOQ obtained as 0.13 μM and 0.45 μM respectively. The sensitivity and limit of detection of CuSe/MWCNTs nanocomposite has been shown in Table 2 in comparison with other MWCNTs based nanocomposites.
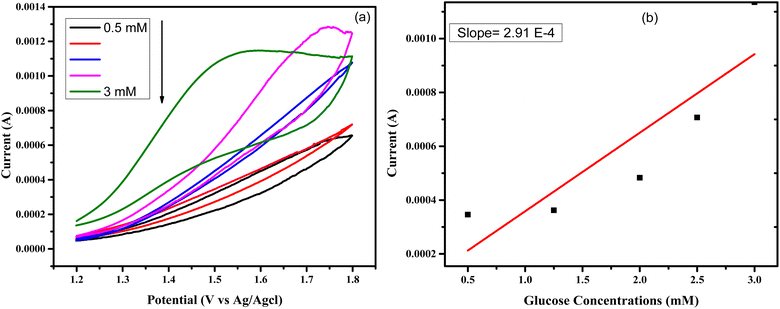 | ||
| Fig. 8 (a) CuSe/MWCNTs responses against different concentration of glucose by CV (b) calibration curve constructed by the plotting of anodic maximum current vs. the concentration of glucose. | ||
| Sample | Sensitivity | Limit of detection | Linear range | References |
|---|---|---|---|---|
| Cu/MWCNTs | 922 μA mM−1 cm−2 | 2 μM | 0.5–0.75 mM | 30 |
| Pd–Ni/MWCNTs | 71 μA mM−1 cm−2 | 0.0026 μM | 0.01–1.4 mM | 31 |
| Co3O4 doped N-MWCNT/PPy | 195.72 μA mM−1 cm−2 | 0.07327 μA cm−2 | 10–0.15 μM | 32 |
| CuSe | 15![[thin space (1/6-em)]](https://www.rsc.org/images/entities/char_2009.gif) 341 μA mM−1 cm−2 341 μA mM−1 cm−2 |
0.26 μM | — | 16 |
| Au/CNTs | 2.28 μA mM−1 cm−2 | 0.19 μM | 0.1–3 mM | 28 |
| CuSe/GCE | 19![[thin space (1/6-em)]](https://www.rsc.org/images/entities/char_2009.gif) 419 μA mM−1 cm−2 419 μA mM−1 cm−2 |
0.196 μM | 100 nM to 40 μM | 19 |
| CuSe/MWCNTs | 4157 μA mM−1 cm−2 | 0.3 μM | 0.1–2 mM | This work |
3.7 Electrochemical impedance spectroscopy
Electrode was modified for electrochemical impedance spectroscopy of both samples CuSe/PVP/GO nanocomposite and CuSe/MWCNTs nanocomposite separately, and then dried at room temperature for 25 to 30 minutes. The EIS examined the electrode surface's ability to transmit electrons and changes in impedance throughout the modification procedure. On the empty GCE, Fig. 9(a) showed a semicircle. When electrode was bare then EIS value at semicircle was 17.3 kΩ, but when electrode was modified with the sample (CuSe/PVP/GO) and CuSe/MWCNTs then semicircles for each showed EIS value as 7.3 kΩ and 12.3 kΩ respectively. When electrode was modified with sample, then the value of the semicircle decreased following the change of the nanocomposite on the electrode. This demonstrated that modified electrode improves and minimizes the transfer resistance of electrons. The Fig. 9(a) display the Nyquist plots of CuSe/PVP/GO and CuSe/MWCNTs. Finally, a circuit of an electrode with adjusted EIS was created using Gamry software, as seen in the Fig. 9(b) for CuSe/PVP/GO and CuSe/MWCNTs.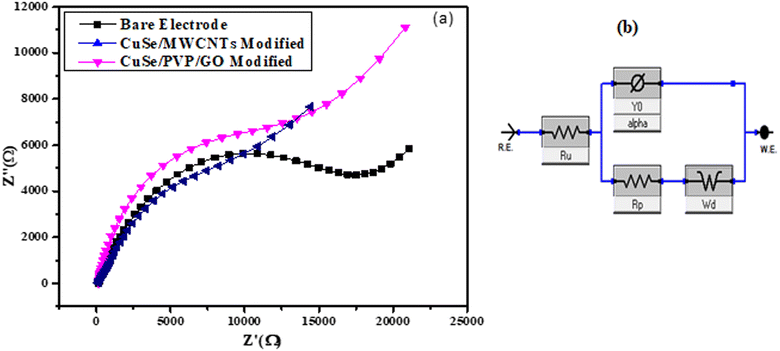 | ||
| Fig. 9 (a) Nyquist plot of bare and modified electrode of CuSe/PVP/GO and CuSe/MWCNTs (b) shows circuit diagram of EIS of modified electrode of both samples. | ||
Ru represents the solution resistance which is due to the electrolyte, Rp represents the charge transfer resistance which is present on the surface of electrode and this Rp resistance of modified electrode should be less than the bare electrode, the Ru value was typically the best approach to assess the system's electrochemical performance. Y0 represents the capacitance of modified electrode and at the last Wd represents the Warburg impedance which is the mass transfer resistance. Mass transfer resistance actually represents the transfer of analyte from solution to the electrode.
3.8 Chronoamperometry
Ascorbic acid, uric acid, dopamine, and other biological species can obstruct the detection of glucose in blood samples. Chronoamperometry is a method that detects even the smallest variations in current over time at a constant voltage. Selectivity for the glucose sensing in the presence of other interferents was also checked by the chronoamperometry for CuSe/MWCNTs nanocomposite. Chronoamperometric measurements were performed by injecting glucose and other interferents in the same electrolyte. Different interferents like ascorbic acid (AA), uric acid (UA) and dopamine (DA) were injected along with glucose in the electrolyte. As glucose (1 mM) was added in electrolyte, an increase of 150 μA and 230 μA in current was observed, but similar concentration of AA, UA and dopamine could not alter the current to this level. Fig. 10(a) showed that only addition of glucose produces the major increment in the oxidation current as compared to other interferents which showed that this nanocomposite was selective towards the glucose sensing. Experiments were conducted in triplicate (rest two graphs are added in ESI†). These experiments were conducted on three different modified electrodes and variation in current increment can be observed because of fluctuations in the amount of loaded nanomaterials on electrode surface. All three experiments (10a, S1 and S2) clearly depict that glucose addition into electrolyte (1 M NaOH) produces highest jump in current which is consistent throughout all experiments. At the same time interferants produce small change in current values, which can further be improved by designing more selective and smart nanomaterials. This shows that rise in current with glucose is consistent and stable while interferants cause minimal fluctuations in current. Although this lower current rise is also statistically significant as can be seen by bar graph in Fig. 10(b).Simultaneously, after multiple uses as a sensing material, it was observed that the stability and efficiency of the nanocomposite remained unaffected, as depicted in Fig. 11. The nanocomposite remained stable throughout eight cycles of sensing glucose. This stability was attributed to the synergistic effect of PVP and MWCNTs, which enhanced the available surface area for the reaction. Furthermore, there was no requirement for a binder between the glassy carbon electrode and the nanocomposite.
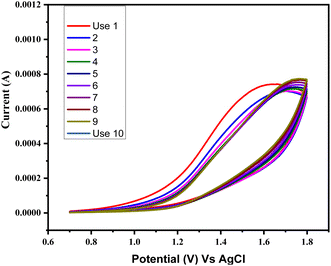 | ||
| Fig. 11 Stability in terms of current for the working electrode following 10 sets of sensing for the glucose. | ||
4. Conclusion
In this work we synthesized CuSe/PVP/GO and CuSe/MWCNTs nanocomposites by using sol gel route. The prepared nanocomposites were characterized by XRD, FTIR, UV-Vis spectrometry. The nanocomposites exhibited hexagonal structure and the crystallite size of CuSe/PVP/GO and CuSe/MWCNTs calculated by Scherrer formula. FTIR spectra shows the occurrence of CuSe, PVP and GO at 823 cm−1, 1634 cm−1 and at 1115 cm−1 respectively which confirmed the successful synthesis of CuSe/PVP/GO nanocomposites. Similarly, the relevant peaks of second sample CuSe/MWCNTs nanocomposite confirmed the development of nanocomposite. UV-visible spectroscopy of CuSe/PVP/GO nanocomposite showed the absorption peaks at 308 nm, 400 nm and 460 nm and bandgap value of GO, CuSe and PVP as 2.01 eV, 2.63 eV and 3.01 eV respectively. Photoluminescence of CuSe/PVP/GO nanocomposite showed the peaks of CuSe/GO at the wavelengths 611 nm/653 nm and that of CuSe/MWCNTs nanocomposite showed the peaks of MWCNTs/CuSe at 487 nm/522 nm respectively. SEM images showed the morphologies of Cuse/PVP/GO and CuSe/MWCNTs nanocomposites. EDX also confirmed the presence of copper, selenium and graphene oxide and MWCNTs. Cyclic voltammetry confirmed that these nanocomposites were good sensor for glucose. The glucose oxidation occurs in the presences of both samples CuSe/PVP/GO and CuSe/MWCNTs. Gradual rise of oxidation current was noted with the addition of glucose to the electrolytic solution. The sensitivity and limit of detections are 2328 μA mM−1 cm−2, 0.2 μM and 4157 μA mM−1 cm2, 0.3 μM for CuSe/PVP/GO and CuSe/MWCNTs respectively. In comparison with other materials (Tables 1 and 2) our samples showed one of the highest sensitives and least limit of detection. Electrochemical impedance spectroscopy (EIS) showed that the resistances of modified electrode/bare electrode as 12.3 kΩ/17.3 kΩ and 6.3 kΩ/17.3 kΩ of CuSe/PVP/GO and CuSe/MWCNTs nanocomposites respectively. Chronoamperometry confirmed that these nanocomposites were best sensor towards glucose sensing even in the presence of other interferants ascorbic acid (AA), uric acid (UA) and dopamine (DA).Ethical statement
The experimental work has been performed under institutional laws of The Islamia University of Bahawalpur, Pakistan. These laws were validated by institutional review and bioethical committees (IBC) under ORIC office.Author contribution
Junaid Yaseen: methodology, laboratory experiments, analysis, writing. Farhat Saira: supervision, to conduct the biosensing experiment, SEM measurements, their analysis and fruitful discussions. Muhammad Imran: writing – review & editing. Mehwish Fatima: writing, review, editing. Momina Rasheed: methodology, and experimentation. Hafiz Ejaz Ahmed: laboratory experiments. Muhammad Zeewaqar and Iqbal Nisa: biosensing experiments. Manzoor: writing – review & editing. Khalid Mehmood: validation, visualization. Zahida Batool: conceptualization, supervision, writing – review & editing.Conflicts of interest
The authors declare that they have no known competing financial interests or personal relationships that could have appeared to influence the work reported in this paper.Acknowledgements
The authors express their appreciation to the Deanship of Scientific Research at King Khalid University, Saudi Arabia, for funding this work through research group program under grant number RGP 2/256/44.References
- M. Iqbal, et al., Graphene oxide nanocomposite with CuSe and photocatalytic removal of methyl green dye under visible light irradiation, Diamond Relat. Mater., 2021, 113, 108254 CrossRef CAS.
- K.-S. Kim, et al., Preparation of copper (Cu) thin films by MOCVD and their conversion to copper selenide (CuSe) thin films through selenium vapor deposition, Bull. Korean Chem. Soc., 2003, 24(5), 647–649 CrossRef CAS.
- M. F. R. Hanifah, et al., Synthesis of Graphene Oxide Nanosheets via Modified Hummersâ€TM Method and its Physicochemical Properties, J. Teknol., 2015, 74(1), 189–192 Search PubMed.
- Z. T. Banizi, et al., Photoluminescence and photocatalytic studies of cadmium sulfide/multiwall carbon nanotube (CdS/MWCNT) nanocomposites, Optik, 2018, 158, 882–892 CrossRef CAS.
- P. Seal, et al., MWCNT-MnFe2O4 nanocomposite for efficient hyperthermia applications, AIP Conf. Proc., 2018, 1942(1) DOI:10.1063/1.5028714.
- Y. Firat and A. Peksoz, Efficiently two-stage synthesis and characterization of CuSe/polypyrrole composite thin films, J. Alloys Compd., 2017, 727, 177–184 CrossRef CAS.
- S. Lu, et al., The mechanical properties, microstructures and mechanism of carbon nanotube-reinforced oil well cement-based nanocomposites, RSC Adv., 2019, 9(46), 26691–26702 RSC.
- A. Hemza, et al., Spectroscopic and thermal properties of PU/PVC doped with multi walled carbon nanotube, Der Pharma Chemica, 2016, 8, 201–208 Search PubMed.
- R. Bhargava and S. Khan, Structural, optical and dielectric properties of graphene oxide, AIP Conf. Proc., 2018, 1953(1), 030011 CrossRef.
- O. Arellano-Tanori, et al., Copper-selenide and copper-telluride composites powders sintetized by ionic exchange, Chalcogenide Lett., 2014, 11, 13–19 Search PubMed.
- I. G. Shitu, et al., Influence of irradiation time on the structural and optical characteristics of CuSe nanoparticles synthesized via microwave-assisted technique, ACS Omega, 2021, 6(16), 10698–10708 CrossRef CAS PubMed.
- Z. Gan, H. Xu and Y. Hao, Mechanism for excitation-dependent photoluminescence from graphene quantum dots and other graphene oxide derivates: consensus, debates and challenges, Nanoscale, 2016, 8(15), 7794–7807 RSC.
- Y. Yan-Hong, et al., Photoluminescence of multiwalled carbon nanotubes excited at different wavelengths, Chin. Phys., 2006, 15(11), 2761 CrossRef.
- J. Montes-Monsalve, R. B. Correa and A. P. Mora, Optical and structural study of CuSe and CuSe/in thin films, J. Phys.: Conf. Ser., 2014, 480(1), 012024 CrossRef CAS.
- L. Li, et al., Facile synthesis of copper selenides with different stoichiometric compositions and their thermoelectric performance at a low temperature range, RSC Adv., 2021, 11(42), 25955–25960 RSC.
- H. Singh, et al., Copper selenide as multifunctional non-enzymatic glucose and dopamine sensor, J. Mater. Res., 2021, 36(7), 1413–1424 CrossRef CAS.
- J. Lv, et al., Facile synthesis of novel CuO/Cu2O nanosheets on copper foil for high sensitive nonenzymatic glucose biosensor, Sens. Actuators, B, 2017, 248, 630–638 CrossRef CAS.
- Z. Miao, et al., Development of a glucose biosensor based on electrodeposited gold nanoparticles–polyvinylpyrrolidone–polyaniline nanocomposites, J. Electroanal. Chem., 2015, 756, 153–160 CrossRef CAS.
- S. Umapathi, et al., Nanostructured copper selenide as an ultrasensitive and selective non-enzymatic glucose sensor, Mater. Adv., 2021, 2(3), 927–932 RSC.
- M. Qi, et al., Increased sensitivity of extracellular glucose monitoring based on AuNP decorated GO nanocomposites, RSC Adv., 2016, 6(45), 39180–39187 RSC.
- X. Hao, et al., Monodisperse copper selenide nanoparticles for ultrasensitive and selective non-enzymatic glucose biosensor, Electrochim. Acta, 2019, 327, 135020 CrossRef CAS.
- J.-D. Qiu, J. Huang and R.-P. Liang, Nanocomposite film based on graphene oxide for high performance flexible glucose biosensor, Sens. Actuators, B, 2011, 160(1), 287–294 CrossRef CAS.
- Y. Dilmac and M. Guler, Fabrication of non-enzymatic glucose sensor dependent upon Au nanoparticles deposited on carboxylated graphene oxide, J. Electroanal. Chem., 2020, 864, 114091 CrossRef CAS.
- M. Dong, et al., A facile synthesis of CoMn2O4 nanosheets on reduced graphene oxide for non-enzymatic glucose sensing, Nanotechnology, 2020, 32(5), 055501 CrossRef PubMed.
- M. Rasheed, Facile synthesis of a CuSe/PVP nanocomposite for ultrasensitive non-enzymatic glucose biosensing, RSC Adv., 2023, 13, 26755–26765 RSC.
- W. Liu, et al., Preparation of three dimensional Cu2O/Au/GO hybrid electrodes and its application as a non-enzymatic glucose sensor, Microchem. J., 2022, 179, 107451 CrossRef CAS.
- S. Phetsang, et al., Copper/reduced graphene oxide film modified electrode for non-enzymatic glucose sensing application, Sci. Rep., 2021, 11(1), 1–13 CrossRef PubMed.
- F. Saira, et al., Investigation of Glucose Oxidation at Gold Nanoparticles Deposited at Carbon Nanotubes Modified Glassy Carbon Electrode by Theoretical and Experimental Methods, Karbala International Journal of Modern Science, 2020, 6(1), 10 CrossRef.
- R. Batool, et al., A nanocomposite prepared from magnetite nanoparticles, polyaniline and carboxy-modified graphene oxide for non-enzymatic sensing of glucose, Microchim. Acta, 2019, 186(5), 1–10 CrossRef CAS PubMed.
- J. Zhao, et al., A non-enzymatic glucose sensor based on the composite of cubic Cu nanoparticles and arc-synthesized multi-walled carbon nanotubes, Biosens. Bioelectron., 2013, 47, 86–91 CrossRef CAS PubMed.
- H. Karimi-Maleh, et al., Palladium–nickel nanoparticles decorated on functionalized-MWCNT for high precision non-enzymatic glucose sensing, Mater. Chem. Phys., 2020, 250, 123042 CrossRef CAS.
- S. Ramesh, et al., Hexagonal nanostructured cobalt oxide@nitrogen doped multiwalled carbon nanotubes/polypyrrole composite for supercapacitor and electrochemical glucose sensor, Colloids Surf., B, 2021, 205, 111840 CrossRef CAS PubMed.
- H. Naeim, et al., Ionic liquid/reduced graphene oxide/nickel-palladium nanoparticle hybrid synthesized for non-enzymatic electrochemical glucose sensing, Electrochim. Acta, 2018, 282, 137–146 CrossRef CAS.
- F. Liaqat, et al., Development of glucose sensor based on cobalt and nickel doped ceria nanostructures, Mater. Sci. Eng., B, 2023, 289, 116231 CrossRef CAS.
- F. Saira, et al., Hollow nanocages for electrochemical glucose sensing: a comprehensive review, J. Mol. Struct., 2022, 1268, 133646 CrossRef CAS.
Footnote |
| † Electronic supplementary information (ESI) available: Chronoamperometry experiments. See DOI: https://doi.org/10.1039/d3ra06713k |
| This journal is © The Royal Society of Chemistry 2024 |

