 Open Access Article
The effect of Si/Al ratio of ZSM-12 zeolite on its morphology, acidity and crystal size for the catalytic performance in the HTO process†
Samira Soltania,
Akbar Zamaniyan*b,
Jafar Towfighi Darian a and
Saeed Soltanali
 b
b
aDepartment of Chemical Engineering, Tarbiat Modares University, Tehran, Iran
bCatalysis Technologies Development Division, Research Institute of Petroleum Industry (RIPI), Tehran, Iran. E-mail: zamaniyana@ripi.ir
First published on 12th February 2024
Abstract
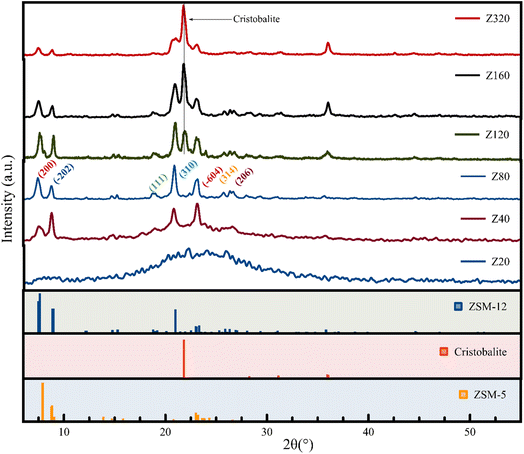
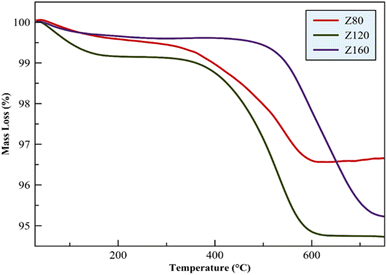
In this research, ZSM-12 zeolite with six Si/Al ratios (20 to 320) was synthesized by a hydrothermal method and systematically investigated. The physicochemical properties of the synthesized nano zeolites were evaluated and compared by XRD, FE-SEM,ICP-AES, NH3-TPD, BET, FT-IR, and TGA analyses. The results show that when the Si/Al ratio increases, the amount of microcrystals increases with the dominant competitive phase of cristobalite by decreasing the MTW phase. The catalytic assessment of synthesized zeolites in the (n-hexane to olefins) HTO process in a fixed bed reactor under atmospheric pressure and WHSV equal to 4 h−1 at 550 °C was evaluated and various parameters such as selectivity towards light olefins, P/E ratio, production of light alkanes, and aromatic compounds (BTX) were investigated. The result of the n-hexane to olefins process indicated that the presence of cristobalite as an impurity phase strongly affects the activity of the catalysts. The Z80 zeolite, with a Si/Al ratio of 80, corresponds to the pure form of ZSM-12 and exhibits the highest light olefin yield at 52.5%. This zeolite demonstrates superior propylene selectivity (P/E = 1.75) owing to its well-suited pore structure, wide channels, and optimal acidity derived from the MTW zeolite. On the other hand, zeolite Z320 has a lower light olefin yield (19.4%) and a lower P/E (1.1) ratio. In addition, according to the results of the TGA analysis, the content of coke on the Z80 catalyst after the catalytic reaction is much less than other catalysts after the catalytic reactor test.
1. Introduction
The demand for light olefins including ethylene and propylene as primary raw materials in the petrochemical industry is rapidly increasing day by day.1–4 Catalytic cracking of naphtha due to lower energy consumption and less emission of greenhouse gases can be an effective way to replace the thermal cracking method of naphtha to produce olefins. One of the main issues in catalytic cracking is the type of catalyst used in this process.5–7Therefore, according to the increasing need for light olefins in the industry, it is very important to study and design a catalyst that has a higher selectivity to propylene and secondly toward ethylene. The catalyst has a very decisive role in the direction of the catalytic cracking process, and a slight change in the physicochemical properties of the catalyst can direct the reaction in a certain direction. Among the most active and suitable catalysts for hydrocarbon cracking processes are solid proton-donating acids such as zeolites, which are considered key components of the petroleum industry's cracking catalysts. Zeolites have the ability to increase the selectivity of the process towards desired products (light olefins) due to their shape-selective properties.8–10 Phase engineering of nanomaterials gives us different ways to design and make new nanomaterials with fresh crystal phases. This is super important for making their physical and chemical properties adjustable and improving how well they work.11,12
Zeolite H-ZSM-5 is recognized as one of the best candidates for the catalytic cracking reaction. However, in the catalytic cracking process, the yield of light olefins produced in the cracking of unmodified ZSM-5 is very low and during the long-duration reaction, the catalytic activity and lifetime of this zeolite decrease significantly with the formation of coke. BTX molecules (BTX: benzene, toluene, xylene) are the source of coke in the catalytic cracking reaction. Therefore, to overcome this process's limitations, it is very important to use stable and efficient catalysts. Textural and acidic properties of zeolites can strongly affect the selectivity towards the desired or undesired products.13,14
ZSM-12 with the structural type of MTW is a zeolite with a higher amount of silica compared to aluminum and it's composed of the 1D-pore channels with 12 T atoms (T: Si or Al) ring channel system with pore mouths of 5.6 Å × 6.1 Å. Since its pore size is slightly higher than that of ZSM-5, it can be used for the shape-selective conversion of large molecules, which cannot easily pass into the MFI framework. In addition, due to its acidic properties, ZSM-12 has been suggested as a useful catalyst in many reactions such as isomerization, hydroisomerization, catalytic cracking, and MTO.15–17 The acid properties of zeolites play a crucial role in hydrocarbon cracking, as catalytic cracking heavily relies on acid catalysis. The amount, strength of acidic sites, and acid types present in zeolites are important factors to consider. While higher acidity in zeolites enhances conversion rates, it can also result in undesirable aromatization reactions. Aromatics, which serve as precursors to coke formation, can lead to catalyst deactivation when their production increases. So, it is very important to modify zeolites with the aim of improving the acid properties in such a way that the amount of coke is produced less so that the catalyst has a higher lifetime and more suitable products are produced. The Si/Al ratio of zeolites plays a crucial role in determining their catalytic cracking performance. This ratio affects the density and strength of acid sites, and optimizing the Si/Al ratio can enhance the overall catalytic activity, propylene selectivity, and catalyst lifetime in hydrocarbon cracking reactions. It is important to note that the catalytic activity of a zeolite in the catalytic cracking process is actually proportional to the concentration of aluminum (which is attributed to strong acid sites).18–20
In this work, the effect of six Si/Al ratios on its, acidity, morphology, crystal size, and product distribution in n-hexane cracking of ZSM-12 was studied. Furthermore, different catalysts were characterized by XRD, NH3-TPD, BET, FE-SEM, TGA, and FTIR analyses. Eventually, the function of the synthesized HTO catalysts was examined in a microreactor system.
2. Experimental
2.1 Materials and methods
The materials used in the synthesis of zeolite catalysts were laboratory-grade and of high purity, which include: sodium hydroxide (NaOH, Merck Co.), aluminum sulfate (Al2(SO4)3·18H2O, Merck Co.), Colloidal Silica (40 wt% SiO2, Merck Co.), tetraethyleammonium bromide (C8H20NBr, Merck Co.), deionized water, ammonium nitrate (NH4NO3, Merck Co.).The molar composition of the precursor solution was: 100SiO2![[thin space (1/6-em)]](https://www.rsc.org/images/entities/char_2009.gif) :
:![[thin space (1/6-em)]](https://www.rsc.org/images/entities/char_2009.gif) xAl2O3
xAl2O3![[thin space (1/6-em)]](https://www.rsc.org/images/entities/char_2009.gif) :
:![[thin space (1/6-em)]](https://www.rsc.org/images/entities/char_2009.gif) 20TPA
20TPA![[thin space (1/6-em)]](https://www.rsc.org/images/entities/char_2009.gif) :
:![[thin space (1/6-em)]](https://www.rsc.org/images/entities/char_2009.gif) 10Na2O
10Na2O![[thin space (1/6-em)]](https://www.rsc.org/images/entities/char_2009.gif) :
:![[thin space (1/6-em)]](https://www.rsc.org/images/entities/char_2009.gif) 20.5NH4F
20.5NH4F![[thin space (1/6-em)]](https://www.rsc.org/images/entities/char_2009.gif) :
:![[thin space (1/6-em)]](https://www.rsc.org/images/entities/char_2009.gif) 2000H2O (x = 2.5, 1.25, 0.83, 0.625, 0.3125, and 0.1562. From here on, they are referred to as Z20 (Si/Al = 20), Z40 (Si/Al = 40), Z60 (Si/Al = 60), Z80 (Si/Al = 80), Z160 (Si/Al = 160) and Z320 (Si/Al = 320), respectively). TEABr (tetraethylammonium bromide) was used as the template. After all the materials were mixed properly under 500 rpm at room temperature, the solution was aged for 24 h. The mixture was then transferred to an autoclave equipped with a Teflon liner, in which it was crystallized at 145 °C for 120 h. Then the resulting mixture is washed thoroughly (until reaching neutral pH) with deionized water. After drying at 105 °C overnight, the powder was calcinated at 550 °C for 4 h. Finally, ion exchange with 2.0 M NH4NO3 solution was performed two times for 10 min at 85 °C to remove sodium from the zeolite structure, then it was washed and filtered, and after drying, it was calcined at 550 °C for 4 h.
2000H2O (x = 2.5, 1.25, 0.83, 0.625, 0.3125, and 0.1562. From here on, they are referred to as Z20 (Si/Al = 20), Z40 (Si/Al = 40), Z60 (Si/Al = 60), Z80 (Si/Al = 80), Z160 (Si/Al = 160) and Z320 (Si/Al = 320), respectively). TEABr (tetraethylammonium bromide) was used as the template. After all the materials were mixed properly under 500 rpm at room temperature, the solution was aged for 24 h. The mixture was then transferred to an autoclave equipped with a Teflon liner, in which it was crystallized at 145 °C for 120 h. Then the resulting mixture is washed thoroughly (until reaching neutral pH) with deionized water. After drying at 105 °C overnight, the powder was calcinated at 550 °C for 4 h. Finally, ion exchange with 2.0 M NH4NO3 solution was performed two times for 10 min at 85 °C to remove sodium from the zeolite structure, then it was washed and filtered, and after drying, it was calcined at 550 °C for 4 h.
2.2 Characterization methods
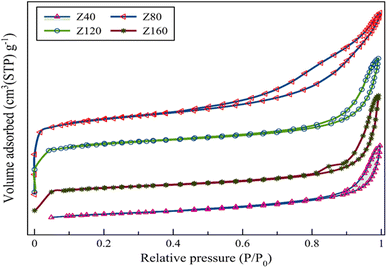
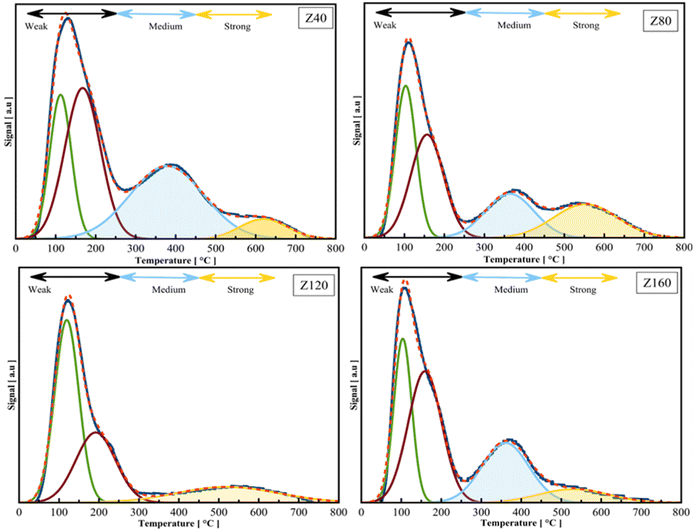
XRD pattern was utilized to identify the zeolite phase and relative crystallinity in 2θ range of 5–80°. The X-ray powder diffraction instrument model X′ Pert Pro (Panalytical Co.) equipped with Cu Kα radiation (λ = 1.5418 Å) as a generation source of X-ray, with a step size of 0.02° was used for this analysis. The morphology and size of the crystals in the zeolite catalysts are checked using a scanning electron microscopic analysis (FE-SEM) with Sigma VP instrument (ZEISS company, Germany). To identify the structural modification of the prepared samples, the spectrum two IR device manufactured by PerkinElmer, Germany was used. The analysis was performed in the range of wave number 400–4000 with a wavelength of 1 cm−1. The Si/Al ratio of all samples was determined using the Shimadzu ICPE-9820 inductively coupled plasma atomic emission spectrometer (ICP-AES). To calculate the average size of the pores, the pores volume, and the surface area of the zeolites used in this research, the BELSORP MINI model was used. Before carrying out the nitrogen adsorption and desorption tests, the samples were degassed for 3 hours at 300 °C and then the test was performed at 77 K. BET analysis was used to calculate the specific surface area. The total pore volume was obtained from desorption isotherms. The BJH method was used to estimate the volume and size distribution of mesopores, and the t-plot method was used to find the volume and area of micropores. NH3-TPD tests were performed to evaluate the strength of acidic sites of zeolites using a ChemBET-3000 instrument equipped with TCD.2.3 Catalytic test
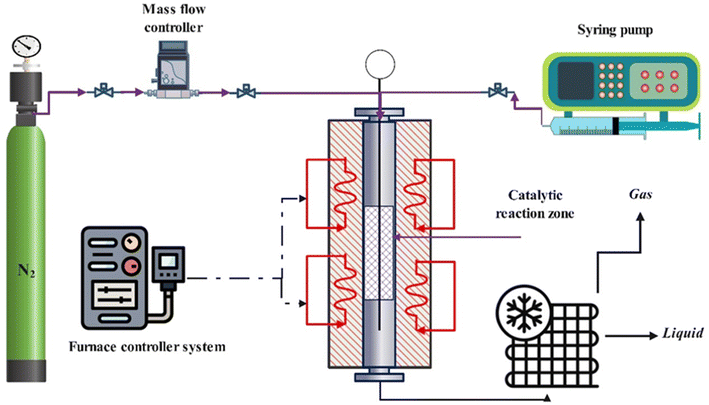
After the synthesis of the catalytic samples, the reactor test was performed to investigate the catalytic performance in the catalytic cracking process of n-hexane. Before the reactor test, the powder obtained from calcination was meshed to prevent channelization of the catalyst and proper passage of the feed through different parts of the reactor tube. Fig. 1 shows the fixed bed catalytic reactor. The laboratory catalytic performance evaluation system of the n-hexane to olefin process includes different parts. Firstly, 0.67 g of catalyst was diluted with 0.33 g of quartz, then it was loaded into the reactor. The temperature of the reactor was heated with a temperature gradient of 5 °C min−1 to the final temperature of 550 °C under nitrogen flow (as a carrier gas with a flow rate of 40 cm3 min−1) using an electric furnace equipped with a temperature controller and a thermocouple. To stabilize the conditions at the final temperature, the system remained at the mentioned conditions for 1 h. Then, the n-hexane (feed) flow was injected into the reactor employing a syringe pump with a flow rate of 0.068 cm3 min−1, under these conditions the value of WHSV was equal to 4 h−1. In the following, the catalytic cracking reaction was carried out by passing the feed through the preheater and reaching the catalytic bed. The output products pass through a condenser and are cooled by a cooling circulator containing ethylene glycol to a temperature of 1 °C and become two-phase. The gas and liquid products were analyzed by utilization of a gas chromatograph (GC) equipped with a FID and a high-performance liquid chromatograph (HPLC) respectively.Calculations related to the selectivity to different products and the conversion of n-hexane were calculated using the defined eqn (1) and (2). And to investigate the deactivation rate of the catalyst, a percentage decrease in reactant converte (PDRC) was calculated using eqn (3).
 | (1) |
 | (2) |
| Percentage decrease in reactant convert (PDRC) = (initial conversion − conversion at certain time)/initial conversion | (3) |
3. Results and discussions
3.1 Characterizations of zeolites
| ID | ZSM-12 | ZSM-5 | Cristobalite |
|---|---|---|---|
| Z20 | Amorphous | ||
| Z40 | >99 | Nill | Nill |
| Z80 | >99 | Nill | Nill |
| Z120 | 68.5 | 10.8 | 20.7 |
| Z160 | 58.5 | Nill | 41.5 |
| Z320 | 48.5 | Nill | 51.5 |
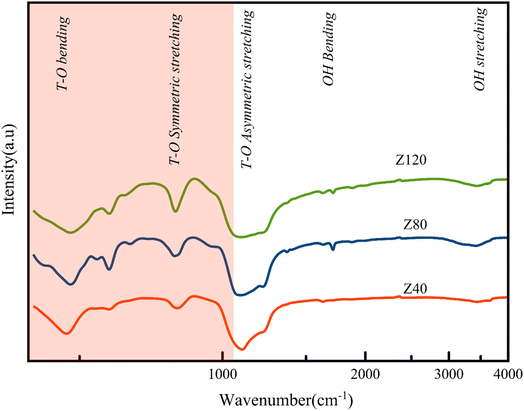
The peak around 3500 cm−1 is ascribed to structurally hydroxyl groups usually acts as an acid site. According to the Fig. 3 the absorption peak intensity of the Z80 sample in 3500 cm−1, is higher than other samples, which indicates the presence of more acidic sites in this sample.33,34 This conclusion is further evaluated by NH3-TPD analysis in the following.22 Also, in the IR spectrum, the ratio of vibration intensity at the wavenumber 550 cm−1 to 450 cm−1 indicates the degree of crystallinity. The higher of this ratio is the greater the crystallinity of the sample.35–37 The ratio number mentioned for the Z80 sample has the highest value, which indicates the greater crystallinity of this sample compared to other samples. The peak at the wavenumber of 682 cm−1, indicates the presence of cristobalite, which is more intense in the Z120 sample than the other samples, which is due to the impurity phase of cristobalite in this sample.
| Samples | Z40 | Z80 | Z120 | Z160 |
|---|---|---|---|---|
| Specific surface area (m−2 g−1) | 65.5 | 309.3 | 228.2 | 147.2 |
| Surface area micro (m−2 g−1) | 27.7 | 216.4 | 157.3 | 109.2 |
| Pore volume (cm3 g−1) | 0.01 | 0.12 | 0.08 | 0.04 |
| Pore diameter (nm) | 4.6 | 1.5 | 1.4 | 1.4 |
| Si/Al (measured by ICP-AES) | 39.84 | 79.65 | 119.31 | 159.15 |
| Sample ID | Acidity concentration (mmol NH3 per g) | Total | S/W | ||
|---|---|---|---|---|---|
| Weak | Medium | Strong | |||
| Z40 | 0.22 | 0.14 | 0.06 | 0.42 | 0.27 |
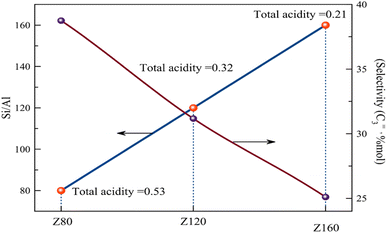
| Z80 | 0.35 | 0.1 | 0.08 | 0.53 | 0.22 |
| Z120 | 0.25 | 0.0 | 0.07 | 0.32 | 0.28 |
| Z160 | 0.13 | 0.06 | 0.02 | 0.21 | 0.15 |
3.2 Catalytic assessment of samples
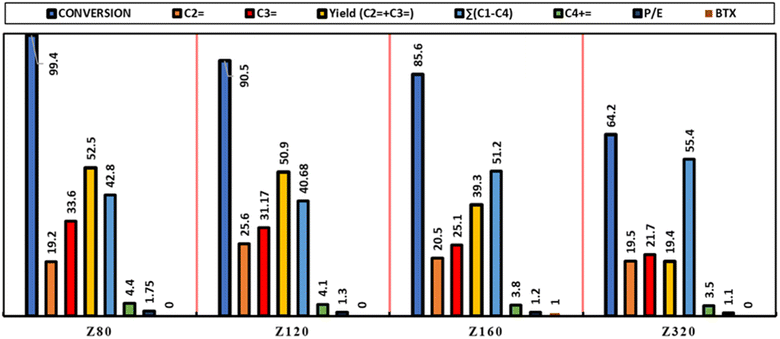
To clarify the reactor performance of the catalysts and investigate the effect of Si/Al ratio on the catalytic performance, HTO tests were performed at 550 °C, under atmospheric pressure the value of WHSV was equal to 4 h−1. The results of the reactor evaluation of catalysts are summarized in Fig. 7 and Table 4 and the selectivity toward light olefins, the production rate of light alkanes, the stability rate, the P/E ratio, and the production rate of aromatic compounds (BTX) have been investigated. According to Fig. 7 and Table 4, the Z320 sample has the lowest n-hexane conversion and the Z80 sample has the highest conversion, which is almost 100%, indicating that all the n-hexane has been converted into a product. Also, the Z80 catalyst has the best result in terms of yield of light olefins, in the following, the influence of the characteristics of the synthesized zeolites will be investigated.| Samples | Si/Al | X (%) | C![[double bond, length as m-dash]](https://www.rsc.org/images/entities/char_e001.gif) 2 (% mol) 2 (% mol) |
C![[double bond, length as m-dash]](https://www.rsc.org/images/entities/char_e001.gif) 3 (% mol) 3 (% mol) |
Yield (C![[double bond, length as m-dash]](https://www.rsc.org/images/entities/char_e001.gif) 2 + C 2 + C![[double bond, length as m-dash]](https://www.rsc.org/images/entities/char_e001.gif) 3) 3) |
∑(C1–C4) | C![[double bond, length as m-dash]](https://www.rsc.org/images/entities/char_e001.gif) 4+ 4+ |
P/E | PDRC | BTX |
|---|---|---|---|---|---|---|---|---|---|---|
| Z80 | 80 | 99.4 | 19.2 | 33.6 | 52.5 | 42.8 | 4.4 | 1.7 | 1.0 | Nill |
| Z120 | 120 | 90.5 | 25.6 | 31.17 | 50.9 | 40.68 | 4.1 | 1.3 | 13.5 | Nill |
| Z160 | 160 | 85.6 | 20.5 | 25.1 | 39.3 | 51.2 | 3.8 | 1.2 | 14.1 | 1.0 |
| Z320 | 320 | 64.2 | 19.5 | 21.7 | 19.4 | 55.4 | 3.5 | 1.1 | 39.4 | Nill |
![[double bond, length as m-dash]](https://www.rsc.org/images/entities/char_e001.gif) ) and (C3+
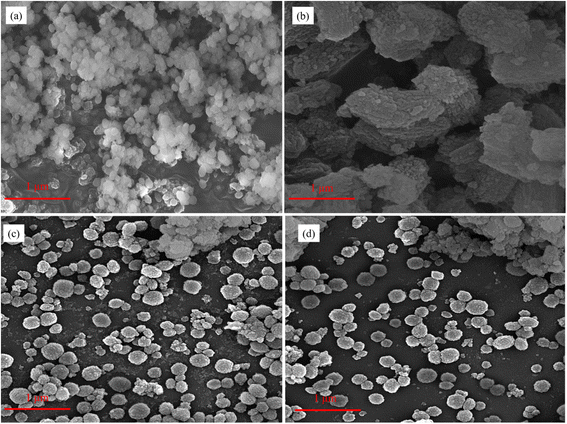
) and (C3+![[double bond, length as m-dash]](https://www.rsc.org/images/entities/char_e001.gif) ) for the Z80 sample is more than the other samples, which can be attributed to the appropriate number of strong acid sites, which are responsible for converting to light olefins, especially propylene.44–46 According to the research done, an excessive increase of strong acid sites leads the reaction to side reactions.47 The Z80 sample has the highest P/E (=1.75). In fact, this sample shows more selectivity to propylene due to its large diameter channels, suitable acidity, and medium pore structure. Also according to eqn (3) and Fig. S4† PDRC parameter, which is the percent decrease reactant conversion and indicates the stability of the catalyst. Z80 catalyst has the lowest PDRC value and this sample is deactivated with a lower speed and slope than other samples and has higher stability. According to the obtained results, it can be stated that the Z80 catalyst has the highest acidity, the highest yield of light olefins especially propylene, maximum stability, and the best performance compared to other samples. In addition to the acidity, the high crystallinity of the Z80 sample helps the penetrate of molecules. The high crystallinity structure and more open pores can promote the catalytic activity with facilitate reactant diffusion improve mass transfer and molecular diffusion in pores.33 Also, reduce the length of the diffusion path and facilitate the diffusion of products through the pores, which leads to an increase in the activity of the zeolite. On the contrary, larger and denser particles increase the length of the diffusion path and make it difficult for products to spread. As a result, the large diffusion path length can lead to the progressive second reactions of light products (olefin) (such as oligomerization and hydrogen transfer), which lead to the production of large hydrocarbons and pore blocking, which can reduce the activity of the zeolite. In addition, according to Fig. 9, the higher concentration of Z80 acidic sites increases the reaction speed and catalyst activity. The relationship between the Si/Al ratio and selectivity towards propylene and acidity is shown in Fig. 8. According to the results, with the increase of Si/Al, the amount of total acidity decreases, as a result, the amount of selectivity C3 decreases. The decrease in the selectivity of olefin, especially ethylene, and propylene, with the reaction time can be attributed to the diffusion resistance of molecules due to the blockage of pores by coke deposits and heavy hydrocarbons. In other words, when many strong acid sites are blocked by heavy particles, the selectivity of light olefins becomes weaker while side reactions increase, such as hydrogen transfer reactions and higher hydrocarbons, which are further investigated in TGA analysis.26,32,48,49 Moreover, we also compared the catalytic performance of our material with the catalysts reported in the literature, as shown in Table 5.
) for the Z80 sample is more than the other samples, which can be attributed to the appropriate number of strong acid sites, which are responsible for converting to light olefins, especially propylene.44–46 According to the research done, an excessive increase of strong acid sites leads the reaction to side reactions.47 The Z80 sample has the highest P/E (=1.75). In fact, this sample shows more selectivity to propylene due to its large diameter channels, suitable acidity, and medium pore structure. Also according to eqn (3) and Fig. S4† PDRC parameter, which is the percent decrease reactant conversion and indicates the stability of the catalyst. Z80 catalyst has the lowest PDRC value and this sample is deactivated with a lower speed and slope than other samples and has higher stability. According to the obtained results, it can be stated that the Z80 catalyst has the highest acidity, the highest yield of light olefins especially propylene, maximum stability, and the best performance compared to other samples. In addition to the acidity, the high crystallinity of the Z80 sample helps the penetrate of molecules. The high crystallinity structure and more open pores can promote the catalytic activity with facilitate reactant diffusion improve mass transfer and molecular diffusion in pores.33 Also, reduce the length of the diffusion path and facilitate the diffusion of products through the pores, which leads to an increase in the activity of the zeolite. On the contrary, larger and denser particles increase the length of the diffusion path and make it difficult for products to spread. As a result, the large diffusion path length can lead to the progressive second reactions of light products (olefin) (such as oligomerization and hydrogen transfer), which lead to the production of large hydrocarbons and pore blocking, which can reduce the activity of the zeolite. In addition, according to Fig. 9, the higher concentration of Z80 acidic sites increases the reaction speed and catalyst activity. The relationship between the Si/Al ratio and selectivity towards propylene and acidity is shown in Fig. 8. According to the results, with the increase of Si/Al, the amount of total acidity decreases, as a result, the amount of selectivity C3 decreases. The decrease in the selectivity of olefin, especially ethylene, and propylene, with the reaction time can be attributed to the diffusion resistance of molecules due to the blockage of pores by coke deposits and heavy hydrocarbons. In other words, when many strong acid sites are blocked by heavy particles, the selectivity of light olefins becomes weaker while side reactions increase, such as hydrogen transfer reactions and higher hydrocarbons, which are further investigated in TGA analysis.26,32,48,49 Moreover, we also compared the catalytic performance of our material with the catalysts reported in the literature, as shown in Table 5.
3.3 Evaluation of the spent catalysts
4. Conclusion
In this research, the synthesis of ZSM-12 zeolite in different Si/Al ratios was investigated and then the synthesized zeolites were evaluated and compared by using different analyses and were evaluated in the HTO process. Various parameters such as selectivity towards light olefins, production of light alkanes and aromatic compounds (BTX) and P/E ratio were investigated. The results of the XRD pattern showed that the increase of Si/Al leads to an increase in the formation of competing phases in the zeolite structure. The presence of cristobalite as an impurity phase strongly affects the activity of the catalyst. The Z80 zeolite, with a Si/Al ratio of 80, corresponds to the pure form of ZSM-12 and exhibits the highest light olefin yield at 52.5%. This zeolite demonstrates superior propylene selectivity (P/E = 1.75) owing to its well-suited pore structure, wide channels, and optimal acidity derived from the MTW zeolite. On the other hand, zeolite Z320 has a lower light olefin yield (19.4%) and a lower P/E (1.1) ratio. In addition, according to the results of TGA analysis, the Z80 catalyst has high thermal stability and the amount of coke deposited on this catalyst is much less than other catalysts after the catalytic reactor test. The reason for this can be attributed to optimal physical and chemical properties.Conflicts of interest
There are no conflicts to declare.References
- S. M. Sadrameli, Fuel, 2016, 173, 285–297 CrossRef CAS.
- F. Gorzin, J. T. Darian, F. Yaripour and S. M. Mousavi, J. Porous Mater., 2019, 26, 1407–1425 CrossRef CAS.
- V. Blay, B. Louis, R. Miravalles, T. Yokoi, K. A. Peccatiello, M. Clough and B. Yilmaz, ACS Catal., 2017, 7, 6542–6566 CrossRef CAS.
- O. Bortnovsky, P. Sazama and B. Wichterlova, Appl. Catal., A, 2005, 287, 203–213 CrossRef CAS.
- O. Muraza, I. A. Bakare, T. Tago, H. Konno, T. Taniguchi, A. M. Al-Amer, Z. H. Yamani, Y. Nakasaka and T. Masuda, Fuel, 2014, 135, 105–111 CrossRef CAS.
- K. Urata, S. Furukawa and T. Komatsu, Appl. Catal., A, 2014, 475, 335–340 CrossRef CAS.
- X. Gao, Z. Tang, D. Ji and H. Zhang, Catal. Commun., 2009, 10, 1787–1790 CrossRef CAS.
- A. Yamaguchi, D. Jin, T. Ikeda, K. Sato, N. Hiyoshi, T. Hanaoka, F. Mizukami and M. Shirai, Fuel Process. Technol., 2014, 126, 343–349 CrossRef CAS.
- Y. Bai, G. Zhang, D. Liu, Y. Zhang, L. Zhao, J. Gao, C. Xu, Q. Meng and X. Gao, Appl. Catal., A, 2021, 628, 118399 CrossRef CAS.
- M. R. Sakha, S. Soltanali, D. Salari, M. Rashidzadeh and P. H. Tabrizi, J. Solid State Chem., 2021, 301, 122342 CrossRef CAS.
- Z. Liu, K. Nie, X. Qu, X. Li, B. Li, Y. Yuan, S. Chong, P. Liu, Y. Li and Z. Yin, J. Am. Chem. Soc., 2022, 144, 4863–4873 CrossRef CAS PubMed.
- B. Li, K. Nie, Y. Zhang, L. Yi, Y. Yuan, S. Chong, Z. Liu and W. Huang, Adv. Mater., 2023, 35, 2303285 CrossRef CAS PubMed.
- Y. Nakasaka, J. Nishimura, T. Tago and T. Masuda, Chem. Eng. J., 2015, 278, 159–165 CrossRef CAS.
- S. Mintova, M. Jaber and V. Valtchev, Chem. Soc. Rev., 2015, 44, 7207–7233 RSC.
- Q. Wang, Z.-M. Cui, C.-Y. Cao and W.-G. Song, J. Phys. Chem. C, 2011, 115, 24987–24992 CrossRef CAS.
- P. Dugkhuntod, T. Imyen, W. Wannapakdee, T. Yutthalekha, S. Salakhum and C. Wattanakit, RSC Adv., 2019, 9, 18087–18097 RSC.
- K. S. Yoo, S. Gopal and P. G. Smirniotis, Ind. Eng. Chem. Res., 2005, 44, 4562–4568 CrossRef CAS.
- Y. Wang, T. Yokoi, S. Namba, J. N. Kondo and T. Tatsumi, Appl. Catal., A, 2015, 504, 192–202 CrossRef CAS.
- J. Pérez-Ramírez, D. Verboekend, A. Bonilla and S. Abelló, Adv. Funct. Mater., 2009, 19, 3972–3979 CrossRef.
- X. Zhu, S. Liu, Y. Song and L. Xu, Appl. Catal., A, 2005, 288, 134–142 CrossRef CAS.
- S. Wang, C. Wang, H. Liu, D. Wang, X. Wang, L. Yang, P. Li and Z. Tian, Microporous Mesoporous Mater., 2023, 348, 112364 CrossRef CAS.
- S. Li, B. Mezari, H. Wu, N. Kosinov and E. J. M. Hensen, Fuel, 2023, 333, 126363 CrossRef CAS.
- M. Ghazimoradi, S. Soltanali, H. Karami, H. Ghassabzadeh and J. Bakhtiari, RSC Adv., 2023, 13, 20058 CAS.
- M. Ghazimoradi, S. Soltanali, N. Safari and H. Ghassabzadeh, J. Mater. Sci., 2023, 1–17 Search PubMed.
- S. Li, A. Liutkova, N. Kosinov and E. J. M. Hensen, ACS Appl. Nano Mater., 2022, 5, 16862–16871 CrossRef CAS.
- E. N. Al-Shafei, M. Z. Albahar, M. F. Aljishi, A. N. Aljishi, G. A. Nasser, M. A. Sanhoob, A. S. Alnasir and A. AlAsseel, Fuel, 2022, 321, 124089 CrossRef CAS.
- M. Ghazimoradi, N. Safari, S. Soltanali and H. Ghassabzadeh, Microporous Mesoporous Mater., 2023, 112486 CrossRef CAS.
- Z. Wan, W. Wu, G. K. Li, C. Wang, H. Yang and D. Zhang, Appl. Catal., A, 2016, 523, 312–320 CrossRef CAS.
- A. Dubey, A. Singh, A. Sharma, A. K. Sundramoorthy, R. Mahadeva, V. Gupta, S. Dixit and S. Arya, Appl. Phys. A: Mater. Sci. Process., 2023, 129, 692 CrossRef CAS.
- H. Karami and S. Soltanali, Surf. Interfaces, 2023, 103813 Search PubMed.
- Y. Tavan, M. R. K. Nikou and A. Shariati, J. Ind. Eng. Chem., 2014, 20, 668–673 CrossRef CAS.
- M. A. Sanhoob, O. Muraza, M. Yoshioka, M. Qamaruddin and T. Yokoi, J. Anal. Appl. Pyrolysis, 2018, 129, 231–240 CrossRef CAS.
- M. S. Aghdam, S. Askari, R. Halladj and A. F. Tajar, Adv. Powder Technol., 2022, 33, 103502 CrossRef.
- F. M. Shalmani, R. Halladj and S. Askari, RSC Adv., 2017, 7, 26756–26769 RSC.
- L. N. Vosmerikova, Y. E. Barbashin and A. V Vosmerikov, Pet. Chem., 2014, 54, 420–425 CrossRef CAS.
- F. Rahmani, M. Haghighi and P. Estifaee, Microporous Mesoporous Mater., 2014, 185, 213–223 CrossRef CAS.
- G. Lawes, J. Goldstein, D. E. Newbury, P. Echlin, D. C. Joy, A. D. Romig Jr, C. E. Lyman, C. Fiori and E. Lifshin, Scanning Electron Microscopy and X-Ray Microanalysis: A Text for Biologists, Materials Scientists, and Geologists, Springer, 1992 Search PubMed.
- X. Wei and P. G. Smirniotis, Microporous Mesoporous Mater., 2006, 97, 97–106 CrossRef CAS.
- X. Zhang, D. Cheng, F. Chen and X. Zhan, Chem. Eng. Sci., 2017, 168, 352–359 CrossRef CAS.
- H. Karami, M. Kazemeini, S. Soltanali and M. Rashidzadeh, Can. J. Chem. Eng., 2022, 11, 3357–3366 CrossRef.
- H. Karami, M. Kazemeini, S. Soltanali and M. Rashidzadeh, Microporous Mesoporous Mater., 2022, 332, 111704 CrossRef CAS.
- S. Hassanpour, M. Taghizadeh and F. Yaripour, Ind. Eng. Chem. Res., 2010, 49, 4063–4069 CrossRef CAS.
- H. Karami, S. Soltanali, A. M. Najafi, M. Ghazimoradi, E. Yaghoobpour and A. Abbasi, Appl. Catal., A, 2023, 658, 119167 CrossRef CAS.
- W.-Z. Lang, C.-L. Hu, L.-F. Chu and Y.-J. Guo, RSC Adv., 2014, 4, 37107–37113 RSC.
- S. Askari, R. Halladj and M. Sohrabi, Microporous Mesoporous Mater., 2012, 163, 334–342 CrossRef CAS.
- P. Sadeghpour and M. Haghighi, Adv. Powder Technol., 2018, 29, 1175–1188 CrossRef CAS.
- X. Jiang, X. Su, X. Bai, Y. Li, L. Yang, K. Zhang, Y. Zhang, Y. Liu and W. Wu, Microporous Mesoporous Mater., 2018, 263, 243–250 CrossRef CAS.
- M. A. Sanhoob, O. Muraza, T. Tago, T. Taniguchi, G. Watanabe and T. Masuda, Res. Chem. Intermed., 2016, 42, 6437–6448 CrossRef CAS.
- M. A. Sanhoob, E. N. Shafei, A. Khan, G. A. Nasser, I. Bakare, O. Muraza, M. Z. Al-Bahar, A. N. Al-Jishi, H. H. Al-Badairy and A. C. Ummer, ACS Omega, 2022, 7, 10317–10329 CrossRef CAS PubMed.
- D. He, Y. Zhang, S. Yang, Y. Mei and Y. Luo, ChemCatChem, 2018, 10, 5434–5440 CrossRef CAS.
- O. D. A. Salah Aldeen, M. Z. Mahmoud, H. S. Majdi, D. A. Mutlak, K. Fakhriddinovich Uktamov and E. Kianfar, Adv. Mater. Sci. Eng., 2022, 2022, 6165180 Search PubMed.
- H. Li, B. Zhu, D. Wang, S. Fan, X. Gao, J. Zhang, Q. Ma and T. Zhao, Microporous Mesoporous Mater., 2021, 327, 111403 CrossRef CAS.
Footnote |
| † Electronic supplementary information (ESI) available. See DOI: https://doi.org/10.1039/d3ra08792a |
| This journal is © The Royal Society of Chemistry 2024 |

