 Open Access Article
Effective correction of dissolved organic carbon interference in nitrate detection using ultraviolet spectroscopy combined with the equivalent concentration offset method
Jing Dong ab,
Junwu Tangac,
Guojun Wu*ac,
Yu Xind,
Ruizhuo Liab and
Yahui Lic
aXi'an Institute of Optics and Precision Mechanics, Chinese Academy of Sciences, Xi'an 710119, China. E-mail: dongjing@opt.ac.cn; jwtang@vip.163.com; wuguojun@opt.ac.cn; liruizhuo@opt.ac.cn
bUniversity of Chinese Academy of Sciences, Beijing 100049, China
cLaoshan Laboratory, Qingdao 266237, China. E-mail: yhli@qnlm.ac
dOcean University of China, Qingdao 266100, China. E-mail: xinyu312@ouc.edu.cn
First published on 12th February 2024
Abstract
Nitrate contamination in water sources poses a substantial environmental and health risk. However, accurate detection of nitrate in water, particularly in the presence of dissolved organic carbon (DOC) interference, remains a significant analytical challenge. This study investigates a novel approach for the reliable detection of nitrate in water samples with varying levels of DOC interference based on the equivalent concentration offset method. The characteristic wavelengths of DOC were determined based on the first-order derivatives, and a nitrate concentration prediction model based on partial least squares (PLS) was established using the absorption spectra of nitrate solutions. Subsequently, the absorption spectra of the nitrate solutions were subtracted from that of the nitrate-DOC mixed solutions to obtain the difference spectra. These difference spectra were introduced into the nitrate prediction model to calculate the equivalent concentration offset values caused by DOC. Finally, a DOC interference correction model was established based on a binary linear regression between the absorbances at the DOC characteristic wavelengths and the DOC-induced equivalent concentration offset values of nitrate. Additionally, a modeling wavelength selection algorithm based on a sliding window was proposed to ensure the accuracy of the nitrate concentration prediction model and the equivalent concentration offset model. The experimental results demonstrated that by correcting the DOC-induced offsets, the relative error of nitrate prediction was reduced from 94.44% to 3.36%, and the root mean square error of prediction was reduced from 1.6108 mg L−1 to 0.1037 mg L−1, which is a significant correction effect. The proposed method applied to predict nitrate concentrations in samples from two different water sources shows a certain degree of comparability with the standard method. It proves that this method can effectively correct the deviations in nitrate measurements caused by DOC and improve the accuracy of nitrate measurement.
1. Introduction
Nitrate is one of the most common chemical pollutants in water bodies. In aquatic ecosystems, excessive nitrate can fuel harmful algal blooms, disrupt oxygen levels, and disrupt fragile ecological equilibriums. Therefore, precise nitrate detection plays a pivotal role in ensuring the safety of drinking water, preserving aquatic biodiversity, and mitigating the adverse impacts of nutrient pollution.1,2Ultraviolet spectroscopic water quality analysis technology is based on the Lambert–Beer law by combining chemometric methods to model water quality parameters that can be directly predicted for unknown concentrations.3 This technique, known for its simplicity, rapid and convenient detection, as well as its minimal secondary pollution, is increasingly being employed to measure various parameters in water bodies, including nitrate,4–6 nitrite,7,8 chemical oxygen demand (COD),9–11 and dissolved organic carbon (DOC).12,13 Several manufacturers have developed commercial nitrate sensors, such as the SUNA,14,15 spectrolyser,3 and OPUS.16 However, the accurate detection of nitrate in natural water can be significantly compromised by matrix effects, with one of the critical interfering factors being DOC. DOC exhibits notable absorption characteristics in the ultraviolet region, overlapping its absorption spectra with those of nitrates when directly measured, leading to biased nitrate prediction results.17 Therefore, the elimination of DOC interference is of paramount importance.
There are two common strategies for addressing DOC interference. One strategy relies on the inherent capability of specific stoichiometric algorithms to eliminate spectral overlap and directly predict substance concentrations. Rieger et al.18 developed a global calibration model using the partial least squares (PLS) method for various water quality parameters, including nitrate, DOC, and suspended particulate matter. This model was successfully employed in monitoring typical municipal wastewater. Hu et al.19 reduced cross-sensitivity between nitrate and COD through characteristic wavelength selection within the PLS calibration model. They also created a multi-parameter sensor for water quality in the environmental context. Although PLS can reduce the effect of spectral overlap to some extent, it may complicate the model when dealing with a large number of variables, making the identification of specific spectral features for prediction potentially challenging. In addition, insufficient data can lead to instability in model performance and reduced ability to address spectral overlap.
Another interference elimination strategy involves spectral compensation. To address organic interference, the American Public Health Association and China's environmental protection industry standard employ a dual-wavelength detection method. This method measures the absorbance of nitrate at 220 nm and compensates for it with the absorbance at 275 nm, where nitrate does not absorb.20,21 Edwards et al.22 proposed using 205 nm for nitrate detection and compensating with an absorbance measurement at 300 nm to mitigate the effects of DOC interferences. Jean Causse et al.23 proposed using the second absorbance derivative at two wavelengths to determine DOC and nitrate in water directly. With the development of continuous spectral detection technology, some researchers have corrected organic interferences by compensating the absorbance of a section of the spectral interval. Nehir et al.24 estimated the absorption spectrum of organic matter in the wavelength range of 217–240 nm by the primary function and calculated the nitrate concentration after deducting the absorption spectrum of organic matter. Chen et al.25 concurrently determined nitrate, COD, and turbidity in water using UV-vis absorption spectrometry combined with interval analysis. They employed the spectral difference method to compensate for COD in the turbidity-compensated spectra within the 225–260 nm range, thus eliminating the spectral overlap between nitrate and COD. These compensation methods usually require the known or estimated organic matter concentration in the water body. Consequently, the compensation model becomes more complex by estimating the compensation spectrum, subtracting it from the original spectrum, and then predicting the nitrate concentration.
This paper delves into the complex issue of DOC interference in nitrate detection in water, focusing on the concentration offset in nitrate prediction due to the introduction of DOC. The effects of different concentrations of DOC on the nitrate absorption spectra are investigated, and a DOC interference correction method based on the equivalent concentration offset is proposed. The characteristic wavelengths of DOC are determined by using the first-order derivative, and a nitrate prediction model is established through partial least squares (PLS). Notably, this method enables the estimation of concentration offsets brought about by DOC interference in mixed solutions, requiring only two absorbance values for a rapid and straightforward DOC interference correction. Experimental results conclusively demonstrated that the proposed method can significantly enhance the accuracy of nitrate prediction.
2. Materials and method
2.1 Samples
According to China's environmental quality standards for surface water (GB3838-2002),26 the concentration range of nitrate in solution samples was set at 0.1–5 mg L−1, and the concentration range of DOC was set at 1–50 mg L−1. The samples were divided into a calibration set and a test set. The calibration set contains ten nitrate standard solutions and 18 nitrate DOC mixed solutions. The test set includes six nitrate DOC mixed solutions with random concentrations of nitrate and DOC.Potassium nitrate reagent (analytically pure) and deionized water were used to prepare 1000 mg L−1 nitrate standard solution. According to the international standard method, a 1000 mg L−1 DOC standard stock solution was prepared using potassium hydrogen phthalate reagent (analytically pure) and deionized water.27 The deionized water was supplied by a Milli-Q water-purification system (Millipore, Billerica, MA, USA). Nitrate solutions of 0.1, 0.2, 0.5, 1.0, 1.5, 2.0, 2.5, 3.0, 4.0, and 5.0 mg L−1 were prepared by diluting a 1000 mg L−1 nitrate standard solution with deionized water. The nitrate concentration was calculated as the concentration of nitrogen in the solution. DOC solutions of 1, 5, 10, 20, 30, 40, and 50 mg L−1 were obtained by diluting a 1000 mg L−1 DOC standard masterbatch with deionized water. Moreover, DOC solutions were added to the nitrate solutions to produce 18 mixtures with different levels of nitrate and COD to develop a correction model. Six random concentrations of nitrate and DOC solutions were prepared as method test samples. The concentrations used in the samples are shown in Table 1.
| Calibration set | Test set | ||||||||||
|---|---|---|---|---|---|---|---|---|---|---|---|
| No. | NO3− (mg L−1) | DOC (mg L−1) | No. | NO3− (mg L−1) | DOC (mg L−1) | No. | NO3− (mg L−1) | DOC (mg L−1) | No. | NO3− (mg L−1) | DOC (mg L−1) |
| 1 | 0.5 | 5 | 7 | 2 | 5 | 13 | 4 | 5 | 1 | 0.5 | 15 |
| 2 | 0.5 | 10 | 8 | 2 | 10 | 14 | 4 | 10 | 2 | 1 | 37 |
| 3 | 0.5 | 20 | 9 | 2 | 20 | 15 | 4 | 20 | 3 | 2 | 11 |
| 4 | 0.5 | 30 | 10 | 2 | 30 | 16 | 4 | 30 | 4 | 3 | 42 |
| 5 | 0.5 | 40 | 11 | 2 | 40 | 17 | 4 | 40 | 5 | 4 | 6 |
| 6 | 0.5 | 50 | 12 | 2 | 50 | 18 | 4 | 50 | 6 | 5 | 24 |
Natural water samples were collected from the mainstream of Mi River and Xi'Er River in Weifang City, Shandong Province, China. After collection, the water samples underwent filtration through a 0.22 micrometer filter membrane (Millipore Co., USA), and their concentrations of nitrate and DOC were measured. The concentrations of samples are shown in Table 2 The DOC concentrations were determined using a total organic carbon analyser (Shimadzu TOC-L). The nitrate concentrations were measured by the chemiluminescence method on a NOx analyzer (API-200E, Teledyne) with a detection limit of 10 nmol L−1 and a precision of 3%.28,29
| No. | Sample source | NO3− (mg L−1) | DOC (mg L−1) |
|---|---|---|---|
| 1 | MR01 | 0.59 | 0.49 |
| 2 | MR02 | 0.55 | 0.30 |
| 3 | MR03 | 0.58 | 0.69 |
| 4 | MR04 | 0.62 | 0.79 |
| 5 | MR05 | 0.66 | 0.51 |
| 6 | MR06 | 0.73 | 0.27 |
| 7 | XER01 | 1.65 | 0.58 |
| 8 | XER02 | 1.7 | 2.8 |
2.2 Measurements
A double-beam UV-vis spectrophotometer (UV-8000s, LASPEC, Shanghai, China) was used to measure the absorption spectra of different solutions with the wavelength scan range set to 200–400 nm. The spectrophotometer equipped with a 10 mm quartz cuvette and deionized water was used as a reference to reduce measurement error. The scanning speed was set as medium, and the spectral resolution was set as 0.5 nm.2.3 Interference correction model based on equivalent concentration offset method
In this study, we developed an interference correction model for DOC based on the concept of equivalent concentration offset, to achieve precise nitrate concentration predictions in DOC-enriched aquatic environments. This method effectively obviates the need for estimating DOC concentrations within water bodies or the laborious task of quantifying absorbance variations attributed to DOC. The method requires two models: a PLS-based nitrate prediction model and an equivalent concentration offset model. The equivalent concentration offset model is built using the absorbances at the DOC characteristic wavelengths and the DOC-induced equivalent concentration offset values.PLS decomposes the spectral matrix X and concentration matrix Y and then performs principal component analysis to extract the main components as model inputs. The PLS model can be written as follows:
| X = TPT + E | (1) |
| Y = UQT + F | (2) |
To maintain orthogonality, a weight matrix W is introduced:
| T = XW | (3) |
After decomposing the above matrix, the matrix of regression coefficients is:
| β = W(PTW)−1QT | (4) |
| Ŷ = Xβ | (5) |
Step 1: Absorption spectra were acquired for the nitrate DOC mixed solution and nitrate solution samples. The absorption spectra of the nitrate solution samples (Xnitrate) were subtracted from that of the mixed solution samples (Xmixed) to derive the difference spectra (Xdiff). These difference spectra illuminate the influence of DOC on the nitrate absorption spectra. As shown in eqn (6):
| Xdiff = Xmixed − Xnitrate | (6) |
Step 2: The nitrate prediction model can be built on the calibration sets of nitrate standard solutions based on the PLS method. The regression coefficients matrix of the model (βn) can be calculated as shown in eqn (7). Specific calculation steps are described in eqn (1)–(4).
| βn = Wn((Pn)TWn)−1(Qn)T | (7) |
Step 3: Difference spectra (Xdiff) were substituted into the nitrate prediction model to calculate DOC-induced equivalent concentration offset (YECO), as shown in eqn (8)
| YECO = Xdiffβn | (8) |
Step 4: Determining characteristic wavelength points within spectra of mixed solution samples (Xmixed) that remain unaltered by nitrate spectra interference can be achieved by analyzing their first-order derivatives. Subsequently, a linear model is established between the absorbance measured at these characteristic wavelengths and the corresponding equivalent concentration offset values (YECO). The linear model can be written as follows:
| YECO = aA1 + bA2 + c | (9) |
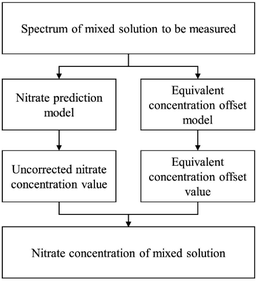
Step 5: When analyzing an unknown mixed solution sample, the initial spectrum is directly input into the nitrate concentration prediction model, yielding the uncorrected nitrate concentration. Subsequently, the equivalent concentration offset model is applied to quantify the extent of overestimation in nitrate concentration caused by DOC influence, resulting in the determination of the equivalent concentration offset value. Finally, an accurate nitrate concentration is obtained by subtracting this offset value. The outlined process is visually depicted in Fig. 1.
2.4 Model validation
In this paper, the nitrate concentration prediction model is developed based on the PLS method, and leave-one-out cross-validation was used to verify the performance of the PLS model in predicting new data. In this process, one element out of n total elements in the dataset was held out as the test set, while the remaining N − 1 elements were utilized for training the models. This iterative procedure was repeated several times, with each element serving as the validation set once. The resulting validation results from these iterations were averaged to estimate the overall prediction performance of the model. The root mean square error of cross-validation (RMSECV) was computed as the mean value of the root mean square error of prediction (RMSEP) obtained across the multiple cross-validation rounds. This approach provided a robust assessment of the model's predictive accuracy.The performance of the whole model is evaluated by three performance indices: the coefficient of determination (R2), the root mean square error of prediction, and the relative error (RE). The performance indices are shown in eqn (10)–(12).
 | (10) |
 | (11) |
 | (12) |
3 Results and discussion
3.1 Analysis of dissolved organic carbon interference
The absorption spectra of the solutions with different concentrations of nitrate were measured, as shown in Fig. 2(a). The primary absorption spectral region of nitrate is from 200 to 250 nm, and the absorbances after 250 nm are almost zero. The absorption spectra of DOC solutions with different concentrations are shown in Fig. 2(b). The absorption of DOC is mainly concentrated in the interval before 300 nm, and there is more than one absorption peak. Notably, there is a substantial overlap between the spectral curves of nitrate and DOC, indicating that DOC significantly interferes with the absorption spectra of nitrate.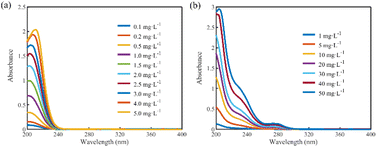 | ||
| Fig. 2 (a) Absorption spectra of different concentrations of nitrate solutions. (b) Absorption spectra of different concentrations of DOC solutions. | ||
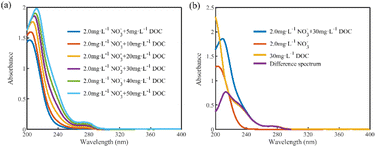
To investigate the effect of DOC on the absorption spectra of nitrate, 18 sets of mixed solution samples with nitrate concentrations of 0.5, 2, and 4 mg L−1 and DOC concentrations of 5, 10, 20, 30, 40, and 50 mg L−1 were prepared, and their absorption spectra were obtained as shown in Fig. 3(a) (for the 2 mg L−1 nitrate mixed sample group). The absorbance of the mixed samples increased with the increase in DOC concentration, and the absorption peaks were red-shifted. Since the absorbance of nitrate was almost zero after 250 nm, the absorbance of the mixed samples after 250 nm was contributed by the absorption of DOC, and the absorbance increased linearly with the DOC concentration.
To quantify the influence of DOC on nitrate absorbance, we obtained the difference spectra by subtracting the spectra of the nitrate solutions at the corresponding concentration from the spectra of the mixed solutions. As shown in Fig. 3(b), the difference spectra do not overlap with the DOC solution spectra, indicating that the absorption spectra of the mixed solutions are not a simple linear combination of the nitrate and DOC absorption spectra. Using the DOC absorption spectrum directly to estimate the effect on nitrate absorbance would lead to overestimation. Instead, the difference spectra offer a precise representation of the changes in absorbance resulting from the introduction of DOC solution.
The mixed solution spectra result from a linear combination of the nitrate solution spectra and the difference spectra. When directly applied to the nitrate prediction model, this leads to overestimating the predicted nitrate concentration, a phenomenon primarily driven by the contribution of the difference spectra. Consequently, by substituting the difference spectra into the nitrate prediction model, we can calculate the overestimated concentrations, referred to as the equivalent concentration offset values induced by DOC. These offset values exhibit a linear relationship with the DOC concentrations in the mixed solutions. Since DOC mainly contributed to the absorbances of the mixed solutions in the interval after 250 nm, and the correlation coefficient between the absorbance and DOC concentration in the interval of 250–300 nm was more significant than 0.99, it indicated that the concentration of DOC in the mixed solution could be reflected by the absorbance magnitude after 250 nm. Therefore, a linear model of absorbances at a wavelength after 250 nm and the corresponding equivalent concentration offset values can be established directly, and the correction of DOC interference can be realized by calculating the equivalent concentration offset values caused by DOC in the mixed solutions to be measured.
3.2 Modeling interval selection
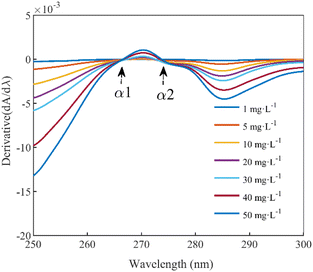
The equivalent concentration offset model involves modeling two key parameters: the absorbances that indirectly reflect the fluctuation in DOC concentration within the mixed solution and the corresponding equivalent concentration offset value resulting from these variations. Fig. 2(b) within Section 2.1 shows a trough and peak in the DOC absorption spectrum after 250 nm. Typically, the peak or trough represents the most prominent feature in an absorption spectrum, and the intensity or depth of this feature often directly correlates with the concentration of the absorbing species. Consequently, we selected the absorbance at these two specific wavelengths as parameters for the equivalent concentration offset model.In this study, the first-order derivative is used to identify the extreme points within the DOC absorption spectra, specifically locating the positions of the troughs and peaks. The first-order derivative spectra of DOC absorption within the wavelength range from 250 nm to 300 nm were calculated and plotted, as shown in Fig. 4. The first-order derivatives at α1 (266.5 nm) and α2 (273.5 nm) equate to zero, designating them as the trough and peak wavelengths in the DOC absorption spectra, respectively. After 250 nm, the spectra of the pure DOC solutions, the mixed solutions, and the difference spectra all converge. Consequently, the absorbance at the trough and peak wavelengths within the difference spectra were used as inputs for modeling the equivalent concentration offset model.
Another parameter in the equivalent concentration offset model is the equivalent concentration offset values resulting from different DOC concentrations. Eighteen difference spectra were obtained by subtracting the absorption spectra of 18 modeled mixed samples from the spectra of their corresponding nitrate solutions with the same concentration. These difference spectra were then used as inputs for the established nitrate prediction model, and the resulting concentration predictions represented the equivalent concentration offset values.
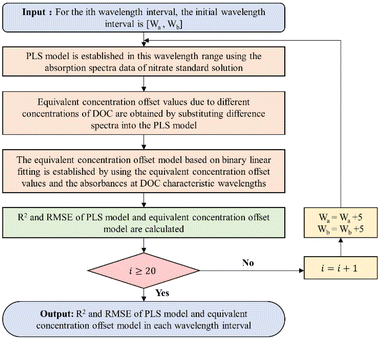
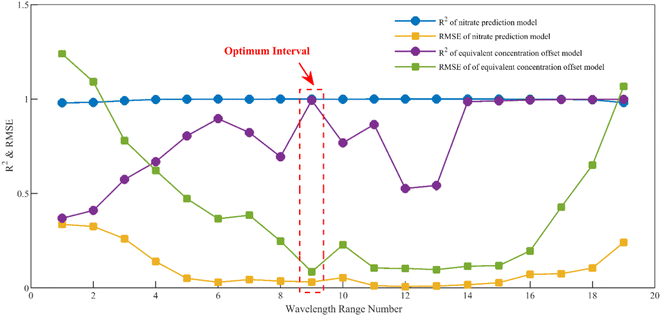
It is worth noting that the equivalent concentration offset model was established on the basis of the nitrate prediction model. Thus, the choice of the modeling interval not only affects the accuracy of the nitrate prediction model but also indirectly affects the accuracy of the equivalent concentration offset model. A sliding window-based modeling interval selection algorithm is proposed, aiming at the problem of considering the accuracy of the two models simultaneously. The specific process is shown in Fig. 5.
Firstly, the first wavelength interval [200 nm, 205 nm] was input, and the nitrate prediction model was established based on PLS using the absorption spectral data of nitrate standard solutions in this interval. Secondly, the equivalent concentration offset values of nitrate corresponding to different concentrations of DOC were obtained by substituting the difference spectra into the nitrate prediction model, and the equivalent concentration offset model was established based on binary linear regression using these values and the absorbances of difference spectra at DOC characteristic wavelengths. The R2 and RMSE of the nitrate prediction model and the equivalent concentration offset model were calculated at this wavelength interval. The wavelength interval window was then shifted 2.5 nm (5 variables) to the right, creating a new wavelength interval, and the entire process was reiterated. This algorithm was looped 19 times with a 200–250 nm wavelength range to cover the nitrate UV-sensitive interval. The results of the optimal modeling interval selection are shown in Fig. 6.
The results show that the root mean square errors (RMSE) exhibited a general pattern of diminishing and subsequently escalating trends for both the nitrate prediction model and the equivalent concentration offset model. This behavior is notably influenced by spectral characteristics. Nitrate absorbance approached near-zero levels after the 16th interval (237.5–242.5 nm). In this regime, the divergence between absorption spectra for various nitrate concentrations markedly decreased, leading to an escalation in the error rates for both models, although the coefficient of determination did not change much. In The 9th interval (220–225 nm), both models achieve their highest coefficient of determination and exhibit the lowest root mean square errors, signifying the interval's optimal modeling accuracy. Consequently, this interval was chosen as the optimal modeling interval.
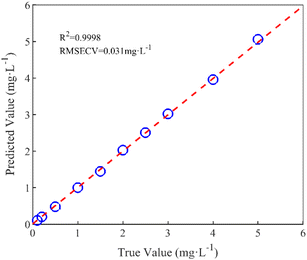
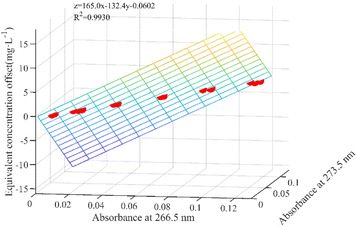
3.3 Nitrate prediction model and dissolved organic carbon interference correction model
3.4 Results of DOC interference correction
The prediction of nitrate concentrations was conducted for both the calibration set and a validation set samples to validate the correction method proposed in this paper. Absorption spectra of the mixed solution were collected, and the corrected nitrate concentrations were calculated using the DOC interference correction model based on equivalent concentration offsets. These corrected values were compared with the uncorrected and true nitrate concentrations. The prediction results for the modeling set samples are depicted in Fig. 9.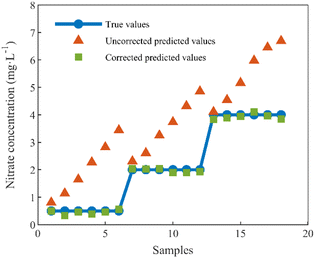 | ||
| Fig. 9 Prediction results of nitrate concentration before and after calibration of calibration set samples. | ||
Following the correction process, the predicted nitrate concentrations closely matched the true values, with a root mean square error of 0.0933 mg L−1 and an average relative error of 6.67%. This method demonstrates effective correction under conditions of constant nitrate concentration with varying DOC concentrations and variable nitrate concentrations with constant DOC concentrations.
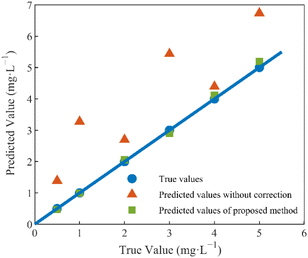
The test set samples were six sets of mixed nitrate and DOC solutions with random concentrations, and the sample concentrations were set as in Table 2 in Section 1.2. The nitrate concentrations of the test set samples were predicted using the method proposed in this paper, and the predicted results were compared with the uncorrected, true values of nitrate concentrations, as depicted in Fig. 10.
From the calibration results depicted in the figure above, it is evident that the uncorrected predictions exhibit substantial discrepancies from the true values, and these discrepancies are notably influenced by the concentration of DOC in the solution. Notably, a direct correlation is observed between the concentration of DOC and the magnitude of the prediction errors, with higher DOC concentrations resulting in more pronounced deviations.
The correction algorithm, grounded in the concept of equivalent concentration offsets and introduced within the framework of this paper, effectively mitigates the disruptive effects of DOC. Post-correction, the predicted values align closely with the true values, a comparative summary of which is presented in Table 3. Following correction, the determination coefficient is elevated from 0.8013 to 0.9982, and the average relative error undergoes a significant reduction, decreasing from 94.44% to 3.36%. Furthermore, the root-mean-square error of prediction is substantially minimized, declining from 1.6108 mg L−1 to 0.1037 mg L−1. These results signify a substantial enhancement in prediction accuracy and underscore the method's effectiveness in nitrate detection under DOC interference (Table 3).
| Endpoint | R2 | RE (100%) | RMSEP (mg L−1) |
|---|---|---|---|
| Uncorrected | 0.8013 | 94.44% | 1.6108 |
| Corrected | 0.9982 | 3.36% | 0.1037 |
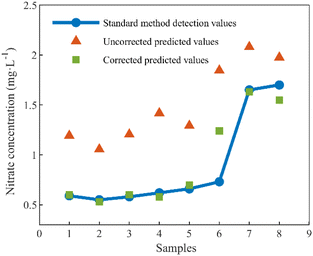
To validate the effectiveness of the proposed method in real conditions, samples were collected from two natural water sources. All samples underwent filtration using a 0.2 µm membrane to eliminate turbidity interference. For comparison, nitrate and DOC concentrations were measured using standard methods. The comparison results are depicted in Fig. 11.
After the algorithm correction, the concentration offsets caused by DOC were considerably eliminated, resulting in corrected nitrate predictions more closely to the measurements obtained through standard methods. However, we noticed that the results of sample 6 before and after the correction had large deviations. The algorithm partially corrected this sample but did not entirely eliminate all interferences. Further analysis of Sample 6 revealed its similarity in nitrate and DOC concentrations to the previous five samples but with a notably higher total nitrogen content. The PLS-based nitrate prediction model effectively removes non-nitrate spectral components through principal component extraction. However, when the total nitrogen content is excessively high, it leads to an abundance of components in the water that share a spectral resemblance with nitrate, causing prediction biases. Further development of the compensation model is required to remove such interferences.
Results before and after correction are presented in Table 4, indicating improvements across all indicators after correction. Significantly, due to disparities between DOC spectra in natural water and those used for modeling, the efficacy of interference correction is not as pronounced as results obtained using the standard samples test set. Local calibration could be employed to further enhance the algorithm's measurement accuracy in real environments.
| Endpoint | R2 | RE (100%) | RMSEP (mg L−1) |
|---|---|---|---|
| Uncorrected | 0.7385 | 90.18% | 0.6663 |
| Corrected | 0.8399 | 12.65% | 0.1894 |
| Uncorrected (remove sample 6) | 0.9388 | 81.24% | 0.5741 |
| Corrected (remove sample 6) | 0.9910 | 4.49% | 0.0626 |
To evaluate the accuracy and robustness of the proposed method, recovery experiments were performed. Nitrate standard solutions with concentrations of 0.645, 1.250, and 1.818 mg L−1 were spiked into three samples, namely, MR02, XER01, and XER02, respectively. Each sample was measured three times and its standard deviation was calculated. The results of the recovery experiments are shown in Table 5. The highest recovery rate reached 106.96%, the lowest was 90.95%, and the average recoveries were 101.49%, 96.82% and 97.57%, respectively. The results indicate that the established model has good accuracy and reliability.
| Samples | Original concentration (mg L−1) | Added concentration (mg L−1) | Measured concentration (mg L−1) | Recovery (%) | Average recovery (%) |
|---|---|---|---|---|---|
| MR02 | 0.5293 ± 0.0117 | 0.645 | 1.1996 ± 0.0128 | 103.92 | 101.49 |
| 0.5293 ± 0.0117 | 1.250 | 1.8017 ± 0.0192 | 101.79 | ||
| 0.5293 ± 0.0117 | 1.818 | 2.3247 ± 0.0143 | 98.76 | ||
| XER01 | 1.6313 ± 0.0149 | 0.645 | 2.2838 ± 0.0104 | 101.15 | 96.82 |
| 1.6313 ± 0.0149 | 1.250 | 2.8414 ± 0.0139 | 96.81 | ||
| 1.6313 ± 0.0149 | 1.818 | 3.3129 ± 0.0154 | 92.50 | ||
| XER02 | 1.5441 ± 0.0099 | 0.645 | 2.2340 ± 0.0152 | 106.96 | 97.57 |
| 1.5441 ± 0.0099 | 1.250 | 2.6810 ± 0.0198 | 90.95 | ||
| 1.5441 ± 0.0099 | 1.818 | 3.2678 ± 0.0196 | 94.81 |
The proposed correction method can be effectively combined with underwater in situ spectrophotometers to achieve more accurate in situ measurements of nitrate concentrations. It is important to note that for practical applications in natural water bodies, this method is only applicable to water bodies with pH close to neutral.6–8 Given the complexity of components in real water bodies and the potential co-existence of different interfering factors, this method can be integrated with existing interference compensation techniques to collectively improve the accuracy of direct nitrate detection in natural water bodies.
4 Conclusion
A simple and rapid method for DOC interference correction based on an equivalent concentration offset method was proposed to address the challenging issue of DOC interference in nitrate detection in aquatic environments. Based on the linear relationship between the absorbances at the characteristic wavelengths of DOC and the equivalent concentration offset values caused by DOC, this method offers a direct correction for DOC-induced concentration offset in nitrate detection without acquiring DOC concentration or estimating the DOC absorption spectrum in the water body. A sliding window-based modeling interval selection algorithm was proposed to screen the optimal wavelength interval to ensure the accuracy of the nitrate prediction model and the equivalent concentration offset model. In this optimized interval, ranging from 220 to 225 nm, the nitrate prediction model and the equivalent concentration offset model were established. Both models consistently demonstrated coefficients of determination exceeding 0.99, confirming their satisfactory accuracy. This interference correction method was validated by random concentration mixed sample experiments. The results demonstrate the method's efficacy, as the post-correction average relative error in detection was notably reduced from 94.44% to 3.36%. Moreover, the method demonstrated good performance in natural water measurement and recovery experiments. This improvement underscores the correction method's capacity to yield accurate predictions in mixed water samples containing DOC, providing a technical reference for direct nitrate detection in environmental applications.Author contributions
Conceptualization, Jing Dong; methodology, Jing Dong; resources, Yu Xin; software, Ruizhuo Li; validation, Junwu Tang and Yu Xin; writing—original draft preparation, Jing Dong; writing—review and editing, Junwu Tang and Guojun Wu; visualization, Jing Dong and Yahui Li; investigation, Yahui Li; supervision, Guojun Wu; funding acquisition, Guojun Wu.Conflicts of interest
There are no conflicts to declare.Acknowledgements
The authors gratefully acknowledge the support of the National Key Research and Development Program of China (No. 2022YFC3103900).Notes and references
- J. A. Camargo and Á. Alonso, Ecological and toxicological effects of inorganic nitrogen pollution in aquatic ecosystems: a global assessment, Environ. Int., 2006, 32(6), 831–849 CrossRef CAS PubMed.
- E. Abascal, L. Gómez-Coma, I. Ortiz and A. Ortiz, Global diagnosis of nitrate pollution in groundwater and review of removal technologies, Sci. Total Environ., 2022, 810, 152233 CrossRef CAS PubMed.
- G. Langergraber, N. Fleischmann and F. Hofstaedter, A multivariate calibration procedure for UV/vis spectrometric quantification of organic matter and nitrate in wastewater, Water Sci. Technol., 2003, 47, 63–71 CrossRef CAS PubMed.
- K. S. Johnson and L. J. Coletti, In situ ultraviolet spectrophotometry for high resolution and long-term monitoring of nitrate, bromide and bisulfide in the ocean, Deep Sea Res., Part I, 2002, 49, 1291–1305 CrossRef CAS.
- M. Xia, R. Yang, G. Yin, X. Chen, J. Chen and N. Zhao, A method based on a one-dimensional convolutional neural network for UV-vis spectrometric quantification of nitrate and COD in water under random turbidity disturbance scenario, RSC Adv., 2023, 13(1), 516–526 RSC.
- X. Zhu, J. Xu, N. Zhang and C. Wu, Nitrate Measurement in Seawater Based on Environmental Correction Algorithm, IEEE Sens. J., 2023, 23, 15803–15812 CAS.
- P. Singh, M. K. Singh, Y. R. Beg and G. R. Nishad, A review on spectroscopic methods for determination of nitrite and nitrate in environmental samples, Talanta, 2019, 191, 364–381 CrossRef CAS PubMed.
- H. Wang, A. Ju and L. Wang, Ultraviolet spectroscopic detection of nitrate and nitrite in seawater simultaneously based on partial least squares, Molecules, 2021, 26(12), 3685 CrossRef CAS PubMed.
- J. Li, Y. Tong, L. Guan, S. Wu and D. Li, Optimization of COD determination by UV-vis spectroscopy using PLS chemometrics algorithms, Optik, 2018, 174, 591–599 CrossRef CAS.
- X. Xu, J. Wang, J. Li, A. Fan, Y. Zhang, C. Xu, H. Qin, F. Mu and T. Xu, Research on COD measurement method based on UV-vis absorption spectra of transmissive and reflective detection systems, Front. Environ. Sci. Eng., 2023, 11, 1175363 CrossRef.
- M. Cardia, S. Chessa, M. Franceschi, F. Gambineri and A. Micheli, Machine Learning for the Estimation of COD from UV-Vis Spectrometer in Leather Industries Wastewater, Int. J. Environ. Pollut. Rem., 2023, 11, 10–19 CAS.
- M. Simonsson, K. Kaiser, R. Danielsson, F. Andreux and J. Ranger, Estimating nitrate, dissolved organic carbon and DOC fractions in forest floor leachates using ultraviolet absorbance spectra and multivariate analysis, Geoderma, 2005, 124(1–2), 157–168 CrossRef CAS.
- A. Escalas, M. Droguet, J. M. Guadayol and J. Caixach, Estimating DOC regime in a wastewater treatment plant by UV deconvolution, Water Res., 2003, 37(11), 2627–2635 CrossRef CAS PubMed.
- G. Macintyre, B. Plache, M. R. Lewis, J. Andrea, S. Feener and S. D. McLean, ISUS/SUNA nitrate measurements in networked ocean observing systems, OCEANS, 2009, 1–7 Search PubMed.
- J. N. Plant, C. M. Sakamoto, K. S. Johnson, T. L. Maurer and M. B. Bif, Updated temperature correction for computing seawater nitrate with in situ ultraviolet spectrophotometer and submersible ultraviolet nitrate analyzer nitrate sensors, Limnol. Oceanogr.: Methods, 2023, 21, 581–593 CrossRef CAS.
- D. Meyer, R. D. Prien, L. Rautmann, M. Pallentin, J. J. Waniek and D. E. Schulz-Bull, In situ determination of nitrate and hydrogen sulfide in the Baltic sea using an ultraviolet spectrophotometer, Front. Mar. Sci., 2018, 5, 431 CrossRef.
- A. C. Edwards, P. S. Hooda and Y. Cook, Determination of nitrate in water containing dissolved organic carbon by ultraviolet spectroscopy, Int. J. Environ. Anal. Chem., 2001, 80(1), 49–59 CrossRef CAS.
- L. Rieger, G. Langergraber, M. Thomann, N. Fleischmann and H. Siegrist, Spectral in-situ analysis of NO2, NO3, COD, DOC and TSS in the effluent of a WWTP, Water Sci. Technol., 2004, 50, 143–152 CrossRef CAS PubMed.
- Y. Hu, Y. Wen and X. Wang, Detection of water quality multi-parameters in seawater based on UV-Vis spectrometry, OCEANS, 2016, 1–4 Search PubMed.
- A. Rice, E. W. Baird and R. B. Eaton, Standard Methods for Examination of Water and Wastewater, American Public Health Association, Washington, DC, USA, 2017 Search PubMed.
- Chinese Environmental Protection Agency, Water Quality-Determination of Nitrate-Nitrogen-Ultraviolet Spectrophotometry (HJ/T 346–2007), China Environmental Science Press, Beijing, China, 2007 Search PubMed.
- A. C. Edwards, P. S. Hood and Y. Cook, Determination of nitrate in water containing dissolved organic carbon by ultraviolet spectroscopy, Int. J. Environ. Anal. Chem., 2001, 80, 49–59 CrossRef CAS.
- J. Causse, O. Thomas, A. V. Jung and M. F. Thomas, Direct DOC and nitrate determination in water using dual pathlength and second derivative UV spectrophotometry, Water Res., 2017, 108, 312–319 CrossRef CAS PubMed.
- M. Nehir, M. Esposito, C. Begler, C. Frank, O. Zielinski and E. P. Achterberg, Improved calibration and data processing procedures of OPUS optical sensor for high-resolution in situ monitoring of nitrate in seawater, Front. Mar. Sci., 2021, 8, 663800 CrossRef.
- X. Chen, G. Yin, N. Zhao, T. Gan, R. Yang, M. Xia, C. Feng, Y. Chen and Y. Huang, Simultaneous determination of nitrate, chemical oxygen demand and turbidity in water based on UV-vis absorption spectrometry combined with interval analysis, Spectrochim. Acta, Part A, 2021, 244, 118827 CrossRef CAS PubMed.
- Environmental Quality Standards for Surface Water (GB 3838-2002), Ministry of Environment Protection of China, Beijing, China, 2002, available online: https://www.mee.gov.cn/ywgz/fgbz/bz/bzwb/shjbh/shjzlbz/200206/t20020601_66497.htm, accessed on November 2023.
- ISO 8245:1999, Water Quality: Guidelines for the Determination of Total Organic Carbon (TOC) and Dissolved Organic Carbon (DOC), International Standards Organization, Geneva, Switzerland, 1999 Search PubMed.
- K. Grasshoff, K. Kremling, and M. Ehrhardt, Methods of Seawater Analysis, John Wiley & Sons, 2009 Search PubMed.
- Z. Yan, N. Yang, Z. Liang, M. Yan, X. Zhong, Y. Zhang, W. Xu and Y. Xin, Active dissolved organic nitrogen cycling hidden in large river and environmental implications, Sci. Total Environ., 2021, 795, 10 CrossRef PubMed.
| This journal is © The Royal Society of Chemistry 2024 |

