 Open Access Article
Explainable machine-learning predictions for catalysts in CO2-assisted propane oxidative dehydrogenation†
Hongyu Liu‡
 ab,
Kangyu Liu‡
 b,
Hairuo Zhu
 a,
Weiqing Guoa and
Yuming Li*a
aState Key Laboratory of Heavy Oil Processing, China University of Petroleum, Beijing, 102249, PR China. E-mail: liyuming@cup.edu.cn
bNational Engineering Research Center for Petroleum Refining Technology and Catalyst, Research Institute of Petroleum Progressing Co., Ltd., SINOPEC, Beijing 100083, China
First published on 1st March 2024
Abstract
Propylene is an important raw material in the chemical industry that needs new routes for its production to meet the demand. The CO2-assisted oxidative dehydrogenation of propane (CO2-ODHP) represents an ideal way to produce propylene and uses the greenhouse gas CO2. The design of catalysts with high efficiency is crucial in CO2-ODHP research. Data-driven machine learning is currently of great interest and gaining popularity in the heterogeneous catalysis field for guiding catalyst development. In this study, the reaction results of CO2-ODHP reported in the literature are combined and analyzed with varied machine learning algorithms such as artificial neural network (ANN), k-nearest neighbors (KNN), support vector regression (SVR) and random forest regression (RF)and were used to predict the propylene space-time yield. Specifically, the RF method serves as a superior performing algorithm for propane conversion and propylene selectivity prediction, and SHapley Additive exPlanations (SHAP) based on the Shapley value performs fine model interpretation. Reaction conditions and chemical components show different impacts on catalytic performance. The work provides a valuable perspective for the machine learning in light alkane conversion, and helps us to design catalyst by catalytic performance hidden in the data of literatures.
1 Introduction
Propylene is an important raw material in the production of various petrochemicals, including polypropylene and rubber.1 At present, propylene is mainly produced via steam cracking and fluid catalytic cracking. With the increasing demand for propylene in the global industrial market, new propylene production routes, especially environment-friendly and energy-efficient ones, are urgently needed.2 With recent development in shale gas exploitation techniques, abundant light alkanes can be produced, which thus gives a great chance for the application of propane dehydrogenation.3 Compared with propane nonoxidative dehydrogenation, propane oxidative dehydrogenation shows good stability owing to the existence of oxidants (e.g. O2, N2O, CO2, SO2 and Cl2).1,2 Specifically, the CO2-assisted oxidative dehydrogenation of propane (CO2-ODHP) is one of the most prominent routes for its advantage in the cooperative conversion of CO2 and propane.4,5CO2-ODHP uses CO2 as a mild oxidant to transform propane into propylene. During this catalytic process (as shown in Table 1), CO2 is directly converted to CO, which exhibits a great application in the syngas reaction (CO2 + C3H8 → CO + C3H6 + H2O).6 Compared with propane nonoxidative dehydrogenation (C3H8 → C3H6 + H2), CO2-ODHP can improve the equilibrium of propane conversion via propane dry reforming during the reaction (3CO2 + C3H8 → 6CO + 4H2). Besides, the presence of CO2 facilitates the removal of the deposited coke via the Boudouard reaction (C + CO2 → 2CO), which stabilizes the CO2-ODHP reaction.
| CO2-ODHP reaction steps | ΔH25 °C (kJ mol−1) | ΔG25 °C (kJ mol−1) | |
|---|---|---|---|
| 1 | C3H8 ![[left over right harpoons]](https://www.rsc.org/images/entities/char_21cb.gif) C3H6 + H2 C3H6 + H2 |
+124 | +86 |
| 2 | C3H8 + CO2 ![[left over right harpoons]](https://www.rsc.org/images/entities/char_21cb.gif) C3H6 + CO + H2O C3H6 + CO + H2O |
+164 | +115 |
| 3 | CO2 + H2 ![[left over right harpoons]](https://www.rsc.org/images/entities/char_21cb.gif) CO + H2O CO + H2O |
+41 | +29 |
| 4 | CO2 + C ![[left over right harpoons]](https://www.rsc.org/images/entities/char_21cb.gif) 2CO 2CO |
+172 | +120 |
| 5 | C3H8 + 3CO2 ![[left over right harpoons]](https://www.rsc.org/images/entities/char_21cb.gif) 6CO + 4H2 6CO + 4H2 |
+621 | +383 |
| 6 | C3H8 ![[left over right harpoons]](https://www.rsc.org/images/entities/char_21cb.gif) C2H4 + CH4 C2H4 + CH4 |
+82 | +41 |
| 7 | C3H8 ![[left over right harpoons]](https://www.rsc.org/images/entities/char_21cb.gif) CH4 + 2C + 2H2 CH4 + 2C + 2H2 |
+29 | −27 |
| 8 | C3H8 ![[left over right harpoons]](https://www.rsc.org/images/entities/char_21cb.gif) 3C + 4H2 3C + 4H2 |
+104 | −23 |
There are two reaction mechanisms involved in CO2-ODHP, namely the Mars–van-Krevelen mechanism and a coupling mechanism between the reverse water gas shift reaction and the propane dehydrogenation reaction.2 The Mars–van-Krevelen mechanism is also called the lattice oxygen mechanism. It usually occurs on transition metal oxide-based catalysts. Propane is first oxidized to propylene by lattice oxygen on a metal oxide catalyst, and an oxygen vacancy is formed on the metal oxide. At this time, CO2 provides an oxygen atom to supplement the lattice oxygen vacancy on the catalyst so that the whole reaction is balanced. The lattice oxygen on the catalyst is directly involved in the reaction. The coupling mechanism holds that under appropriate reaction conditions, the reverse water gas shift reaction (RWGS) will be coupled with the propane dehydrogenation reaction, and jointly promote the process.
Previous CO2-ODHP studies were mainly focused on Cr-,7,8 V-,9,10 Ga-,11,12 and In-13,14 based catalysts. Bu et al. prepared a copper-modified Ga-MFI zeolite (Cu/Ga-MFI) and introduced it into CO2-ODHP.15 It was reported that the Ga atoms in the MFI framework can give a moderate acid strength, and the Cu species can provide an appropriate Brønsted/Lewis acid distribution, which will enhance the catalytic performance. Thus, the aromatics selectivity of 73% at propane conversion of 93.6% was achieved. A series of M@ZSM-5 (M = V-, Ga-, Ti-, or Ni-oxide) combined with CaO catalysts was prepared by Lawson et al.16 The catalytic performance of these catalysts in CO2-ODPH revealed that the Ti-doped catalyst generated the best balance of CO2 conversion (76%) and propylene selectivity (39%), due to the high dispersion of TiO2. The variation of the metal dopant could control the catalytic performance. Mo2C, as a novel catalyst, was found to be active in CO2-ODHP by Sullivan et al.17 The kinetic models were carefully investigated, and the two-site dehydrogenation mechanism can provide proper explanation for the good reaction results of Mo2C. Nevertheless, the current development of catalysts in CO2-ODHP is mainly based on trial-and-error experiments. For the design of new catalysts in high activity, it is important to predict catalytic performance and the influencing factors.
Support modulation, additive modification, and preparation-method variations are efficient methods for enhancing the catalytic performance.5 During the past decades, large amounts of experimental data have been reported in the propane conversion field. However, varied methods of the reaction conditions during CO2-ODHP reaction in the reported literature have made it complex to decouple the modulation mechanism, which thus brings a great challenge to revealing the fine correlation between the catalyst composition and their catalytic performance.18,19 Thus, establishing an efficient and accurate relationship between the catalyst composition and CO2-ODHP performance would provide reliable guidance for catalyst design and developing effective catalyst systems.
Recently, owing to the fast development of computer science, especially machine learning, sophisticated and complex nonlinear models (e.g. artificial neural networks, kernel regression, random forest, etc.) have achieved a great application in the heterogeneous catalysis fields.20 Notably, prediction of the impact of input process variables on the catalysis processes is the key to enhancing the catalytic performance.
Based on machine learning with the combination of vast data in the references, relative empirical models can be trained based on these data.21 Hereafter, these models can offer advice on catalyst design, predict the impact of relative parameters on the catalytic activity,22–24 explain the structure–activity relationship25 and evaluate kinetic data.26 For the catalyst design, Guo et al.27 analyzed and predicted the organic additives during Cu-catalyzed CO2 reduction with the XGBoost algorithm and found that aliphatic hydroxyl-containing additives can improve the formation of Cu2O in the cubic phase, which is crucial for the catalytic performance. Especially with the combination of DFT calculations, catalysts with excellent catalytic performance can be screened out.28–30 Liu's group successfully predicted the transition energy variation of reactant molecules during F–T synthesis and ethylene oxidation with the assistance of DFT and machine learning, which can guide the catalyst design.31,32 Moreover, due to the large number of literature reports, it is difficult to establish a structure–activity relationship for purposeful catalyst preparation or to identify suitable experimental conditions. Yang et al.33 used decision tree analysis to elucidate the influence of catalyst compositions, promoters, supports, precursors, preparation methods, reaction conditions, etc., on the catalytic performance of CO2 hydrogenation. The selectivity-determining descriptors can be revealed, and their findings in the catalyst design were also proved by experiments. Similar applications of machine learning on oxygen evolution reaction and chemical looping oxidative dehydrogenation of propane are also reported.34,35
To the best of our knowledge, the application of machine learning in CO2-ODHP for catalysis analysis has still not been reported. In the present work, the statistical correlations between catalyst composition, reaction parameters, and catalytic performance of CO2-ODHP reaction from previous literature studies are established based on a series of mathematical models, which were constructed using the artificial neural network (ANN), support vector regressor (SVR), random forest regressor (RF) and k-nearest neighbor (KNN) algorithms. In addition, we also applied the SHapley Additive exPlanations (SHAP) methodology on the collected dataset to identify the input variables with a great impact on the catalyst performance and revealed the effect of the important variables on the space-time yield of propylene, propane conversion and propylene selectivity in CO2-ODHP.
2 Data and methods
2.1 Catalytic reaction dataset of CO2-ODHP
In this study, CO2-ODHP reaction results reported in the literature were collected, and these data in the MS Excel format are loaded as the ESI.† We excluded mainly the reaction conditions including temperature, CO2 concentration, C3H8 concentration, WHSV, etc., catalyst components, and catalytic performance (space-time yield of propylene, propane conversion and propylene selectivity), which are all described in the dataset.2.2 Machine learning
All the algorithms were run using the open-source code Scikit-learn package in the Python 3 environment.36 The original 270 data were randomly divided into the training set and testing set to guarantee the accuracy of the models. Unsupervised learning algorithms were used to visualize the dataset. That is, k-means clustering algorithm37 was first introduced to group similar samples together, and principle component analysis (PCA) and t-distributed stochastic neighbor embedding (t-SNE), which are widely used as the unsupervised machine learning tools for data analysis and data dimension reduction.38 The Pearson correlation was used to measure a linear correlation between two variables. This can give information about the relationship between these variables using a linear or monotonic function.Hereafter, four kinds of machine learning algorithms (ANN, SVR, RF and KNN) were used to obtain reliable qualitative and quantitative analysis results.39–43 The brain's biological neural network consists of about 100 billion neurons, which are the basic processing units of the brain. These neurons perform their functions through huge connections between each other. ANN is inspired by its biological counterparts. It consists of an input layer and an output layer, where the input layer receives data from the dataset, and one or more hidden layers process the data. The output layer provides network-based functions for one or more data points. SVR is one of the most common applications of the support vector machines, which can be used for regression analysis. It finds a regression plane that makes all the data in a set closest to a regression plane. A margin of width ε represents the accuracy, and the points within the 2ε interval are closest to the regression plane. It is considered that the prediction results of these points are more reliable. Thus, the aim of SVR is to contain maximum data within the margin. RF is an algorithm that integrates multiple trees through the idea of ensemble learning. Its basic unit is the decision tree, a branch of machine learning. Random forest is a classifier containing many decision trees, which can be used for both classification and regression problems. It is also known to work well even with very large datasets. Thus, RF is quite popular in the chemistry field, and the result is easy to interpret. KNN algorithm is a memory-based model, and it finds the K instances that are most adjacent to the new input instance in the training data set. If most of the K instances belong to a certain class, the input instance is classified into this class. KNN is mostly used for classification, and it is also suitable for regression analysis. The parameter K is important for the performance of KNN.
Two indexes, the root-mean-square error (RMSE) and the coefficient of determination value (R2 score) were introduced to analyze the prediction errors and evaluate the performance of different models, which were calculated using eqn (1) and (2). After selecting the RF algorithm as the best one, a grid search with 5-fold cross-validation was employed. Grid search is an exhaustive method that can find the optimal hyperparameters of the machine learning model. The key hyperparameters tested in this work are listed in the ESI in Table S1.† SHapley Additive exPlanations (SHAP) were used to interpret the model predictions.40 In this work, tree SHAP, a variant of SHAP to provide explanations for the individual predictions made by RF was used.
 | (1) |
 | (2) |
 is the average value of the real reaction results.
3 Results and discussion
3.1 Data analysis
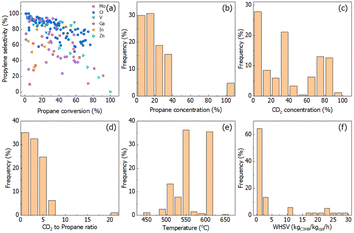
The conversion–selectivity relationship and reaction conditions analysis are shown in Fig. 1. Cr-, V-, Ga-, In-, Zn-, etc., based catalysts are the main catalysts reported in the literature related to CO2-ODHP. The commonly used supports are SiO2, Al2O3 and ZrO2-based oxides. To visualize the catalytic performance of all the catalysts, a propane conversion–propylene selectivity relationship is established and shown in Fig. 1a. It is quite evident that Cr- and V-based catalysts, the most extensively investigated ones, show higher propylene selectivity when propane conversion is lower than 50%, while the research for the catalytic performance at higher propane conversion (>80%) is still scarce. Moreover, Ga-based samples exhibit potential as a new kind of catalyst system with high selectivity at low propane conversion. It is clearly shown that the conversion–selectivity trade-off can be found for all the catalysts in the literature.It is well known that the reaction conditions exert a large impact on the reaction results. For propane activation, propane concentration at a lower level is beneficial for propylene selectivity and propane conversion, and in more than half of the reported CO2-ODHP reactions <20% of propane concentration was chosen, as shown in Fig. 1b. For CO2, its concentration distribution has been chosen randomly (Fig. 1c), while, the ratio of CO2 to propane concentration is always lower than 5 (Fig. 1d). Conventionally, the reaction temperature and weight hourly space velocity (WHSV) are crucial for both propane conversion and propylene selectivity. More than 70% of the reactions were carried on at the reaction temperature in the range of 550–600 °C, and WHSV of lower than 5 kgC3H8 kgcat−1 h−1 was always used.
The Pearson correlation coefficient between the input variables and the targeted catalytic performance can reflect the degree of correlation between them. A higher Pearson correlation coefficient indicates a tighter positive correlation and vice versa. Reaction conditions are used as input variables, and catalytic performance, including the space-time yield of propylene (abbreviated as STY), propane conversion and propylene selectivity are the output variables. The color bar indicates correlation among descriptors, where deep color presents negative values and light color presents positive values. All the values of correlation are in the range of −1 to 1. It can be seen from Fig. 2 that, different reaction conditions are uncorrelated which can be determined by the Pearson correlation. For the correlation between the reaction conditions and catalytic performance, WHSV exhibits a relatively high positive correlation with an STY value (0.79), indicating that the increase of WHSV leads to a high STY value. For the Pearson correlation between the catalyst chemical composition and catalytic performance, no significant correlation could be observed (thus, the figure is not shown here).
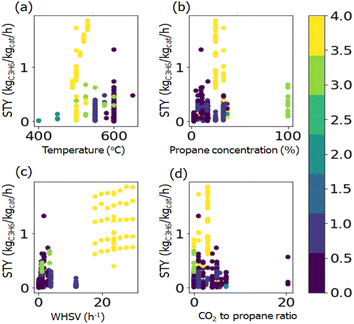
To visualize in detail the relationship between the chemical composition and catalytic performance, twelve elements with higher average weight loading calculated from the reported literature were chosen and plotted with the STY values (Fig. S1†). The figures show that there is no obvious relationship between chemical components and the STY value, which indicates that the influence of the chemical composition on catalytic performance cannot be directly established. Similar figures are drawn with reaction conditions and the STY value (Fig. S2†). It can be seen that higher STY values are skewed in the conditions with lower propane concentration, higher WHSV, and lower CO2-to-propane ratio.
To investigate the unapparent classes (including chemical components and reaction conditions) in the dataset, unsupervised learning methods are introduced for detailed grouping and visualizing. A k-mean clustering algorithm was used first to separate the data into clusters. As shown in Fig. S3,† different cluster numbers between 1 and 20 were tried, and the score versus cluster numbers were collected. The lower the score value the better the prediction. Thus, it is evident that above 5 clusters, there is only slight improvement, and 5 clusters were chosen for further PCA and t-SNE analysis.
PCA and t-SNE were used to reduce the dimensionality of the dataset to two and allow a 2-dimensional representation for the whole dataset. As shown in Fig. 3, it is quite clear that these 270 data points can be separated well into five classes. Unfortunately, it is hard to transform the conclusion from 2-dimensional back to full-dimensional space. The original reaction conditions, as well as chemical composition, can be colored concerning the cluster number we found by k-means clustering (Fig. 4 and S4†). It can be seen that one cluster would be propane concentration with pure propane in use (cluster 3, Fig. 4b), and another cluster would be WHSV at high values (cluster 4, Fig. 4c). It is clear to see that the clustering is not heading for the classes containing just one factor but for multi-component catalyst classes. This makes the interpretation somehow difficult. Although some insight into the dataset can be gained with clustering, supervised algorithms are urgently needed to make predictions based on the whole dataset.
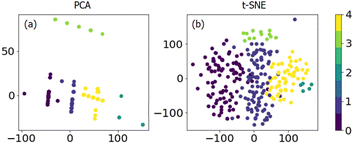 | ||
| Fig. 3 Dimensional reduction of the dataset by (a) PCA and (b) t-SNE from k-means clustering (color bar); different colors indicate different classes. | ||
3.2 Supervised learning with different algorithms
Supervised learning algorithms are used for further prediction and analysis. The dataset was separated into the training set and testing set to verify the accuracy. Four different algorithms, including artificial neural network (ANN), support vector regressor (SVR), random forest regressor (RF) and k-nearest neighbor (KNN) were used to predict the STY values (Fig. 5). The root-mean-squared-error (RMSE) and R2 score of all the algorithms were compared in both the training set and testing set shown in Fig. 6. Lower RMSE and higher R2 score indicate better prediction ability for the algorithm.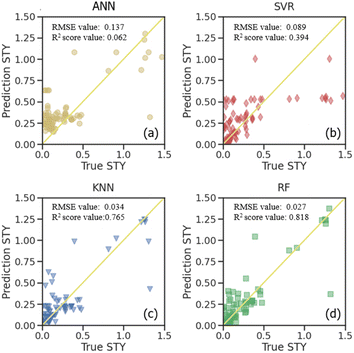 | ||
| Fig. 5 Predictions with machine learning model of (a) ANN, (b) SVR, (c) KNN and (d) RF on the testing set. | ||
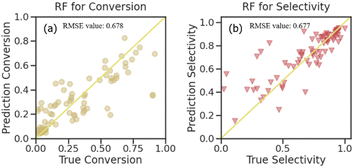 | ||
| Fig. 6 Predictions for the RF algorithm used on the testing set (a) propane conversion and (b) propylene selectivity. | ||
Fig. 5 illustrates a comparison of the prediction quality for different algorithms on the STY value in the testing set. The true STY values are plotted on the “x” axis, and the predicted ones on the “y” axis. It can be seen that all of them possess a decent prediction quality. Specifically, the RF algorithm seems to perform a better precision, while ANN and the SVR both exhibited deviations for the STY values. It is suggested that the STY values and corresponding deviations possess a monotonic increment under these predictions, which might be due to the less frequent samples with very high STY values in the original data.
For further comparison, the STY prediction ability of the four machine learning models presenting as RMSE and R2 scores are shown in Fig. S5.† The results for the predicting training data and the testing data are presented. These values from the training dataset show how adequately the model is fitted to the data, and the ones for the testing dataset show how well the model can predict a new dataset. It is observed from the STY behavior that ANN has the highest RMSE values on both the training set and testing set (0.158 and 0.137, respectively). It also shows the worst R2 score values among all the algorithms with 0.199 and 0.062 on the training set and testing set, respectively. This indicates that ANN is the worst algorithm for STY prediction in CO2-ODHP. KNN showed the same prediction ability on both the training set and testing set with similar RMSE and R2 score values. For SVR, although it possesses a good ability in training sets with an RMSE of 0.005 and an R2 score of 0.975, the prediction ability for the new dataset, that is the testing set herein, is poor. Its RMSE is 0.089 with an R2 score of 0.394. The RF model performs best among the four models for the STY value prediction. It showed the lowest RMSE value and the highest R2 score value on both the training set and testing set. Especially on the testing set, the RMSE value was only 0.027 and the R2 score was 0.818, exhibiting good prediction ability for STY values in CO2-ODHP.
With the results of the STY value prediction, the RF algorithm was chosen for further investigation on propane conversion and propylene selectivity prediction. The comparative evaluation of the prediction capabilities of the RF algorithm on the testing dataset using the joint scatter plots of the actual values versus predicted ones is shown in Fig. 6. The plots revealed that the RF algorithm results in accurate predictions for propane conversion and propylene selectivity. Shown as the R2 score (Fig. S6†), the goodness of fit for the RF model on the training data of propane conversion and propylene selectivity were 0.958 and 0.954, respectively, and for the testing data, they were 0.678 and 0.677, respectively. With RMSE evaluation, the accuracy of the RF model on propane conversion and propylene selectivity were both lower than 0.025. These can further substantiate the fact that except for STY value, the RF model is also suitable for the prediction of propane conversion and propylene selectivity.
3.3 Interpretability of the RF model with SHAP
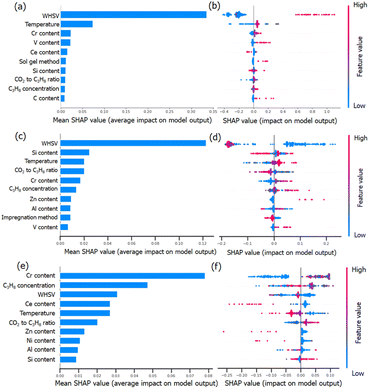
To understand the RF predictions in detail, we utilized the SHapley Additive exPlanations (SHAP) interpretation method to decompose the predicted value into the additive sum of the contributions from individual feature values. SHAP can provide global interpretability, and the dependence of the target output can be explained in terms of the features. The importance of the evaluated features was clarified by sorting them in descending order. It can also give visualization to the impact of the predicted STY values, propane conversion and propylene selectivity on the value of each descriptor (Fig. 7). The overall impact of each descriptor can be calculated by normalizing the Shapley values (abbreviated as SHAP values). A higher SHAP value of the descriptor means a more important influence on model prediction and vice versa.Fig. 7a, c and e clearly show that CO2-ODHP is strongly controlled by the experimental conditions of WHSV and the reaction temperature. These two features are both located as the top 5 important features for STY, propane conversion and propylene selectivity, which might be due to the equilibrium of CO2-ODHP and side reactions. Moreover, the correlation between the features and their global impact based on the calculated SHAP values are also given in Fig. 7b, d and f.
For the STY value in Fig. 7a and b, it can be seen that with an increase of WHSV (blue dots to red dots), its contribution towards STY increases as indicated by the increase in SHAP values. That is, a high WHSV can result in a higher contribution towards STY compared to the average contribution as indicated by the positive SHAP values. In terms of the catalyst composition, Cr, V, and Ce are found to be important in the STY dataset. Especially for Cr and V loading, a higher amount of these elements can improve the resulting STY.
Although WHSV is the most important feature for propane conversion (as shown in Fig. 7c and d), it has a negative impact, as most of the blue dots (lower WHSV) are located on the right side and red ones (higher WHSV) are on the left side. It should be noted that except for the reaction conditions, high Zn content and V content would lead to a higher SHAP value, indicating more Zn or V species can improve the conversion of propane, which may provide insight into CO2-ODHP.
Propylene selectivity is also an important indicator in CO2-ODHP, and the feature importance differs from STY and propane conversion, as shown in Fig. 7e and f. For the effect of the reaction conditions, high WHSV and high reaction temperature (red dots) are suggested to cause low SHAP value, indicating the negative impact of these reaction conditions on propylene selectivity. For the chemical components, Cr content is the most important feature among all the features in determining propylene selectivity due to its greatest average impact on the model output, as indicated by the mean absolute SHAP values. However, Ce, Zn and Ni show a negative impact. According to the above analysis, it can be inferred that the efficient exploration of high-performance catalytic systems is still challenging owing to the multiple effects of reaction conditions. Moreover, it is well known that machine learning is representative of the given data in the dataset, and it remains difficult to design novel catalysts far away from the input data. However, machine learning for catalyst component prediction can provide insight into the influence of the metal type and metal content, which thus gives a great chance for predicting the roles of new types of active components, and further investigation (such as Zn-based catalysts in CO2-ODHP) would be necessarily desirable.
4 Conclusions
In this study, we used four kinds of machine learning algorithms including artificial neural network (ANN), k-nearest neighbors (KNN), support vector regression (SVR) and random forest regression (RF) to predict the STY values with collected reported data of CO2-ODHP reaction. Notably, the RF model evaluated by RMSE and R2 score was considered the preferred model for further investigation due to its superior performance compared with the other three models. The RF model also provided a good match for propane conversion and propylene selectivity prediction with its decent ability of prediction. For the model interpretation, a widely used SHAP algorithm based on the Shapley value on random forest regression prediction was introduced to rank the input features according to their impact on the output values. The reaction conditions, including WHSV, and reaction temperature were found to be important for catalytic performance, and identified as the top 5 features. For chemical components, Zn, V, Ni, etc. possess a positive impact, while the Ce content has a negative impact on different output variables, which can be fine-tuned in the future to prepare catalysts with high activity. The present work provides a great perspective for data analysis with machine learning in the CO2-ODHP reaction, and provides a reliable strategy for identifying the relationship of property-performance hidden in the vast data from the literature.Conflicts of interest
There are no conflicts to declare.Acknowledgements
This work is supported by the National Engineering Research Center for Petroleum Refining Technology and Catalyst (RIPP, SINOPEC) with no. 33600000-23-FW2313-0001, and the State Key Laboratory of Heavy Oil Processing, China University of Petroleum.Notes and references
- T. Otroshchenko, G. Jiang, V. A. Kondratenko, U. Rodemerck and E. V. Kondratenko, Chem. Soc. Rev., 2021, 50, 473–527 RSC
.
- X. Jiang, L. Sharma, V. Fung, S. J. Park, C. W. Jones, B. G. Sumpter, J. Baltrusaitis and Z. L. Wu, ACS Catal., 2021, 11, 2182–2234 CrossRef CAS
.
- C. Li and G. Wang, Chem. Soc. Rev., 2021, 50, 4359–4381 RSC
.
- J. Sheng, B. Yan, W.-D. Lu, B. Qiu, X.-Q. Gao, D. Wang and A.-H. Lu, Chem. Soc. Rev., 2021, 50, 1438–1468 RSC
.
- E. Gomez, B. H. Yan, S. Kattel and J. G. G. Chen, Nat. Rev. Chem, 2019, 3, 638–649 CrossRef CAS
.
- M. A. Atanga, F. Rezaei, A. Jawad, M. Fitch and A. A. Rownaghi, Appl. Catal., B, 2018, 220, 429–445 CrossRef CAS
.
- J. Baek, H. J. Yun, D. Yun, Y. Choi and J. Yi, ACS Catal., 2012, 2, 1893–1903 CrossRef CAS
.
- Q. Zhu, M. Takiguchi, T. Setoyama, T. Yokoi, J. N. Kondo and T. Tatsumi, Catal. Lett., 2011, 141, 670–677 CrossRef CAS
.
- M. L. Balogun, S. Adamu, M. S. Ba-Shammakh and M. M. Hossain, J. Ind. Eng. Chem., 2021, 96, 82–97 CrossRef CAS
.
- Z.-F. Han, X.-L. Xue, J.-M. Wu, W.-Z. Lang and Y.-J. Guo, Chin. J. Catal., 2018, 39, 1099–1109 CrossRef CAS
.
- P. Michorczyk, P. Kuśtrowski, A. Kolak and M. Zimowska, Catal. Commun., 2013, 35, 95–100 CrossRef CAS
.
- S. Orlyk, M. Kantserova, V. Chedryk, P. Kyriienko, D. Balakin, Y. Millot and S. Dzwigaj, J. Porous Mater., 2021, 28, 1511–1522 CrossRef CAS
.
- M. Kantserova, N. Vlasenko, S. Orlyk, K. Veltruska and I. Matolinova, Theor. Exp. Chem., 2019, 55, 207–214 CrossRef CAS
.
- M. Chen, J.-L. Wu, Y.-M. Liu, Y. Cao, L. Guo, H.-Y. He and K.-N. Fan, Appl. Catal., A, 2011, 407, 20–28 CrossRef CAS
.
- K. K. Bu, Y. K. Kang, Y. F. Li, Y. H. Zhang, Y. Tang, Z. Huang, W. Shen and H. L. Xu, Appl. Catal., B, 2024, 343, 123528 CrossRef CAS
.
- S. Lawson, K. Baamran, K. Newport, T. Alghamadi, G. Jacobs, F. Rezaei and A. A. Rownaghi, Appl. Catal., B, 2022, 303, 120907 CrossRef CAS
.
- M. M. Sullivan and A. Bhan, J. Catal., 2018, 357, 195–205 CrossRef
.
- H. Mai, T. C. Le, D. Chen, D. A. Winkler and R. A. Caruso, Chem. Rev., 2022, 122, 13478–13515 CrossRef CAS PubMed
.
- J. A. Esterhuizen, B. R. Goldsmith and S. Linic, Nat. Catal., 2022, 5, 175–184 CrossRef
.
- Y. N. Guan, D. Chaffart, G. H. Liu, Z. Y. Tan, D. S. Zhang, Y. J. Wang, J. D. Li and L. Ricardez-Sandoval, Chem. Eng. Sci., 2022, 248, 117224 CrossRef CAS
.
- Z. C. Yu and W. M. Huang, Electroanalysis, 2022, 34, 599–607 CrossRef CAS
.
- R. Palkovits and S. Palkovits, ACS Catal., 2019, 9, 8383–8387 CrossRef CAS
.
- B. V. Ayodele, M. A. Alsaffar, S. I. Mustapa, R. Kanthasamy, S. Wongsakulphasatch and C. K. Cheng, Chem. Eng. Process., 2021, 166, 108484 CrossRef CAS
.
- K. W. Ting, H. Kamakura, S. S. Poly, M. Takao, S. H. Siddiki, Z. Maeno, K. Matsushita, K.-i. Shimizu and T. Toyao, ACS Catal., 2021, 11, 5829–5838 CrossRef CAS
.
- H. Li, Z. Zhang and Z. J. Liu, Catalysts, 2017, 7, 306 CrossRef
.
- A. Chakkingal, P. Janssens, J. Poissonnier, M. Virginie, A. Y. Khodakov and J. W. Thybaut, Chem. Eng. J., 2022, 446, 137186 CrossRef CAS
.
- Y. Guo, X. R. He, Y. M. Su, Y. H. Dai, M. C. Xie, S. L. Yang, J. W. Chen, K. Wang, D. Zhou and C. Wang, J. Am. Chem. Soc., 2021, 143, 5755–5762 CrossRef CAS PubMed
.
- N. K. Pandit, D. Roy, S. C. Mandal and B. Pathak, J. Phys. Chem. Lett., 2022, 13, 7583–7593 CrossRef CAS PubMed
.
- D. Wang, R. Cao, S. Hao, C. Liang, G. Chen, P. Chen, Y. Li and X. Zou, Green Energy Environ., 2021, 8(3), 820–830 CrossRef
.
- H. S. Feng, H. Ding, S. Wang, Y. J. Liang, Y. Deng, Y. S. Yang, M. Wei and X. Zhang, ACS Appl. Mater. Interfaces, 2022, 14, 25288–25296 CrossRef CAS PubMed
.
- D. X. Chen, P. L. Kang and Z. P. Liu, ACS Catal., 2021, 11, 8317–8326 CrossRef CAS
.
- Q. Y. Liu, C. Shang and Z. P. Liu, J. Am. Chem. Soc., 2021, 143, 11109–11120 CrossRef CAS PubMed
.
- Q. X. Yang, A. Skrypnik, A. Matvienko, H. Lund, M. Holena and E. V. Kondratenko, Appl. Catal., B, 2021, 282, 119554 CrossRef CAS
.
- C. Jiang, H. Song, G. Sun, X. Chang, S. Zhen, S. Wu, Z. J. Zhao and J. Gong, Angew. Chem., Int. Ed., 2022, e202206758 CAS
.
- X. Jiang, Y. Wang, B. R. Jia, X. H. Qu and M. L. Qin, ACS Appl. Mater. Interfaces, 2022, 14(36), 41141–41148 CrossRef CAS PubMed
.
- F. Pedregosa, G. Varoquaux, A. Gramfort, V. Michel, B. Thirion, O. Grisel, M. Blondel, P. Prettenhofer, R. Weiss and V. Dubourg, J. Mach. Learn. Res., 2011, 12, 2825–2830 Search PubMed
.
- D. Arthur and S. Vassilvitskii, k-means++: The advantages of careful seeding, Soda, 2007, vol. 7, pp. 1027–1035 Search PubMed
.
- L. v. d. Maaten, J. Mach. Learn. Res., 2008, 9, 2579–2605 Search PubMed
.
- S. M. Lundberg and S.-I. Lee, Proceedings of the 31st International Conference on Neural Information Processing Systems, 2017, pp. 4765–4774 Search PubMed
.
- S. M. Lundberg, G. Erion, H. Chen, A. DeGrave, J. M. Prutkin, B. Nair, R. Katz, J. Himmelfarb, N. Bansal and S.-I. Lee, Nat. Mach. Intell., 2020, 2, 56–67 CrossRef PubMed
.
- V. Vapnik, Statistical learning theory, Wiley, New York, 1998, vol. 1(624), p. 2 Search PubMed
.
- L. Breiman, Mach. Learn., 2001, 45, 5–32 CrossRef
.
- M. T. Dickerson, R. S. Drysdale and J.-R. Sack, Int. J. Comput. Geom. Appl., 1992, 2, 221–239 CrossRef
.
Footnotes |
| † Electronic supplementary information (ESI) available. See DOI: https://doi.org/10.1039/d4ra00406j |
| ‡ These authors contributed equally. |
| This journal is © The Royal Society of Chemistry 2024 |

