 Open Access Article
Synthesis, structural, spectroscopic and electric/dielectric studies of a nanocrystalline Ni(II) complex based on [(1,3-diphenyl-1H-pyrazol-4-yl)methylene]thiocarbonohydrazide
R. Fouad *a,
Tarik E. Alib,
Mohammed A. Assirib and
S. S. Shenouda
 cd
cd
aDepartment of Chemistry, Faculty of Education, Ain Shams University, Roxy, Cairo, Egypt. E-mail: Raniaahmed@edu.asu.edu.eg
bDepartment of Chemistry, Faculty of Science, King Khalid University, P. O. Box 9004, Abha 61421, Saudi Arabia
cPhysics Department, Faculty of Education, Ain Shams University, Roxy, Cairo, Egypt
dDepartment of Basic Sciences, Obour High Institute for Engineering and Technology, Egypt
First published on 22nd March 2024
Abstract
A Ni2+ nanocomplex based on a heterocyclic ligand containing a pyrazole moiety was developed in this work, and its electric conductivity and dielectric characteristics were studied. The Ni2+ nanocomplex with the general formula [Ni(PyT)2(H2O)2]Cl2·½H2O, where PyT = [(1,3-diphenyl-1H-pyrazol-4-yl)methylene]thiocarbonohydrazide, was characterized using various techniques, including elemental and thermal analyses, as well as conductivity, magnetism, TEM, and spectroscopic (FT-IR, UV-Vis and XRD) studies. The results showed that PyT was bonded to the Ni(II) centers via a neutral bidentate ligand, resulting in an octahedral-shaped, thermally stable mononuclear complex. The frequency response of the dielectric properties and ac conductivity was studied in the range from 200 Hz to 6 kHz. Both dielectric constant and dielectric loss decreased with increasing frequency. In addition, the effect of temperature was investigated in the range of 294.1–363.4 K. The ac conductivity increased with increasing temperature in the range of 294.1–333.5 K. The ac conduction is described as correlated barrier hopping between non-intimate valence alternation pairs. Furthermore, the PyT and Ni(PyT) nanocomplex structures were optimized using theoretical calculations and DFT computations.
1 Introduction
Thiocarbohydrazide derivatives are an important class of compounds with a wide range of applications in the biochemical, pharmaceutical, and industrial domains.1,2 The antiviral, antidiabetic, hepatoprotective, antibacterial, and antiproliferative properties of thiocarbohydrazone ligands have been studied.3 Additionally, because of their flexible coordination ability and hybrid soft-hard donor nature, thiocarbohydrazone ligands easily form metal complexes. Both organic molecules and their metal complexes display a wide range of pharmacological functions, including anticancer, antibacterial, and fungistatic actions. The majority of studies mainly report the preparation and identification of thiocarbohydrazones and their coordinated compounds.4,5Researchers in the field of electronic materials have been constantly examining and refining particular material features according to their usefulness. However, capacitor dielectrics have long been a focus of research among several electronic materials.6
Hydrazones have a variety of qualities that are of interest to scientists and useful in everyday life. Some of these properties include thermal endurance, conductivity, and chelate production. This has sped up the development of novel Schiff bases with unique characteristics and the growth of their applications.7–9 In recent years, organic semiconductors have gained popularity in electronics and optoelectronic technologies because of their intriguing electrical and optical properties,10,11 low cost and ease of making films. Additional energy sublevels are formed in organic molecules when transition metal ions are added. These compounds typically exhibit enhanced charge transfer from ligand to metal or metal to ligand, larger electronic transitions, and intramolecular electron delocalization, resulting in increased electrical properties. Using metal complexes to create electrical and photoelectric devices including diodes, transistors, sensors, photodetectors, and solar cells is one of the most fascinating areas of research for chemists and physicists alike. These are seen as alternatives to traditional semiconductor materials because of their possible usage with flexible substrates, ease of production via continuous printing, broad application scope, and considerable environmental and economic benefits.9
AC conductivity and dielectric behavior studies of materials are important to discover the charge transport mechanism and explain the origin of dielectric losses, which in turn is helpful to determine the presence of defects in these materials and gain essential knowledge about the transport processes in the localized states of the bandgap.12–14 In addition, it is important to investigate the dielectric behavior of these materials to design passive devices for integrated circuits.15,16 In a series of articles, several models have been proposed to explain the electronic structure, ac conduction, and dielectric behavior of materials.14,17–23
This study reports the synthesis and characterization of a novel Ni(II) nanocomplex based on [(1,3-diphenyl-1H-pyrazol-4-yl)methylene]thiocarbonohydrazide for electronic applications. TGA–DTG, X-ray diffraction, and optical absorption of this new complex were studied. In addition, the temperature and frequency responses of its ac conductivity and dielectric parameters were investigated. Therefore, this study provides new insights into the properties and behavior of the Ni(PyT) complex, which indicate its potential application in various fields such as materials science, optical technology and the determination of complex characteristics, especially conductivity properties, and that they can be developed further for various optical applications in the future.
2 Experimental
2.1. Chemicals and methods
Analytical grading chemicals were used as starting material. Thiocarbohydrazide, pyrazole, and nickel chloride were purchased from BDH, Analar, or Merck chemicals. Spectroscopic grade solvents, including ethanolic solvent and dimethylformamide (DMF), were purchased commercially and used as received.At Cairo University's Micro-analytical Central Laboratory, the percentage of H, C, N, and S elements was calculated using a Vario EL Element Analyzer. In addition, complexometric titration was used to detect the percentage of the Ni(II) metal. England's Stuart melting point instrument was employed to determine the melting and decomposition points. For molar conductance, a 10−3 M solution of the Ni(II) complex was dissolved in DMF using a Corning conductivity meter (NY 14831 model). Moreover, the electronic spectra of PyT and its Ni(II) complex were measured using 10−3 M solutions using a JASCO UV-Vis spectrophotometer (V-550). Using an FT-IR Nicolet IS10 spectrometer, FT-IR spectra (4000–400 cm−1) of PyT and its Ni(II) complex were detected. The effective magnetic moment of the Ni(II) complex (μeff) was calculated using the relation μeff = 2.828 (cm T)1/2 B.M., where cm is the molar susceptibility corrected for the diamagnetism of all atoms in the compound using Pascal's constants. In addition, a magnetic susceptibility balance from Sherwood Scientific in Cambridge Science Park (England) was used to measure the magnetic susceptibility using the Gouy method. XRD patterns of the produced compounds were captured using a PHILIPS diffractometer with CuK1 radiation (λ = 1.54056 Å, current = 30 mA and accelerating voltage = 40 kV). A transmission electron microscope (TEM, JEM-2100 (JEOL)) working at an accelerating voltage of 200 kV was used for imaging. An RCL Bridge (PM-6304 Fluke & Phillips) was used to measure the loss tangent and capacitance, which were used to determine the dielectric parameters and ac conductivity of the Ni(II) complex sample prepared in the form of a circular disc with a thickness of 0.72 mm. The sample was placed in a furnace using a special holder with two circular electrodes and a temperature controller.
2.2. Synthesis of [(1,3-diphenyl-1H-pyrazol-4-yl)methylene]thiocarbonohydrazide (PyT)
[(1,3-Diphenyl-1H-pyrazol-4-yl)methylene]thiocarbonohydrazide (PyT) was synthesized using a previously reported method.24 1H NMR: 4.82 (br, 2H, NH2), 7.03–7.88 (m, 10H, Ph–H), 8.16 (s, H, CH![[double bond, length as m-dash]](https://www.rsc.org/images/entities/char_e001.gif) N), 9.24 (s, 1H, H-5pyrazole), 9.51 (brs, 1H,
N), 9.24 (s, 1H, H-5pyrazole), 9.51 (brs, 1H,  ), 11.34 (brs, 1H,
  ).
).
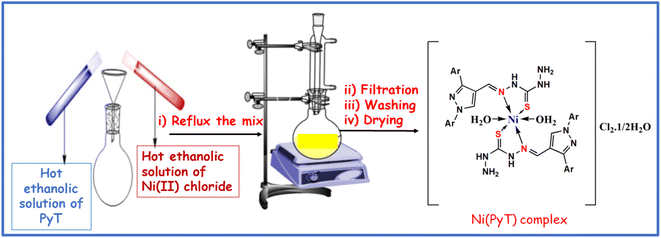
2.3. Synthesis of the Ni(PyT) complex
Ethanolic solutions of nickel chloride and PyT were used in a stoichiometric reaction at a molar ratio of 1![[thin space (1/6-em)]](https://www.rsc.org/images/entities/char_2009.gif) :
:![[thin space (1/6-em)]](https://www.rsc.org/images/entities/char_2009.gif) 2 to synthesize the Ni(PyT) complex. For 8 hours, the resulting mixture was heated through a reflux system (pH = 5.5). Then, the colored precipitate was filtered and washed multiple times with a 1
2 to synthesize the Ni(PyT) complex. For 8 hours, the resulting mixture was heated through a reflux system (pH = 5.5). Then, the colored precipitate was filtered and washed multiple times with a 1![[thin space (1/6-em)]](https://www.rsc.org/images/entities/char_2009.gif) :
:![[thin space (1/6-em)]](https://www.rsc.org/images/entities/char_2009.gif) 1 solution of ethanol and water to remove remnants of unreacted components. The precipitate was finally dried in a suction desiccator, yielding a nearly reddish-brown powder of the Ni(PyT) complex: [Ni(PyT)2(H2O)2]Cl2·½H2O; yield: 83%; melting point >300 °C; anal. found (calcd) for C34H37N12O2.5S2Cl2Ni: M. wt: (847); %C: 48.41 (48.18); % H: 4.63 (4.40); % N: 20.00 (19.83); % S: 7.61 (7.56); % Ni: 7.11 (6.92); FT-IR (KBr, cm−1): 3410 (νOH), 3102 (νNH2, νNH), 3054 (νCHarom), 1597, (νCH
1 solution of ethanol and water to remove remnants of unreacted components. The precipitate was finally dried in a suction desiccator, yielding a nearly reddish-brown powder of the Ni(PyT) complex: [Ni(PyT)2(H2O)2]Cl2·½H2O; yield: 83%; melting point >300 °C; anal. found (calcd) for C34H37N12O2.5S2Cl2Ni: M. wt: (847); %C: 48.41 (48.18); % H: 4.63 (4.40); % N: 20.00 (19.83); % S: 7.61 (7.56); % Ni: 7.11 (6.92); FT-IR (KBr, cm−1): 3410 (νOH), 3102 (νNH2, νNH), 3054 (νCHarom), 1597, (νCH![[double bond, length as m-dash]](https://www.rsc.org/images/entities/char_e001.gif) N), 1540, 755 (νC
N), 1540, 755 (νC![[double bond, length as m-dash]](https://www.rsc.org/images/entities/char_e001.gif) Npyrazole), 1156 (νN–N), 1204, 828 (νNH–C
Npyrazole), 1156 (νN–N), 1204, 828 (νNH–C![[double bond, length as m-dash]](https://www.rsc.org/images/entities/char_e001.gif) S), 506 (νM–O), 469 (νM–N). Molar conductivity (Λm): 107 S mol−1 cm2; UV/Vis (DMF) λmax (nm): 348, 405, 592, 883. μeff (B.M.): 2.7. Scheme 1 provides a representation of the chemical structure of the Ni(PyT) complex.
S), 506 (νM–O), 469 (νM–N). Molar conductivity (Λm): 107 S mol−1 cm2; UV/Vis (DMF) λmax (nm): 348, 405, 592, 883. μeff (B.M.): 2.7. Scheme 1 provides a representation of the chemical structure of the Ni(PyT) complex.
2.4. DFT calculations
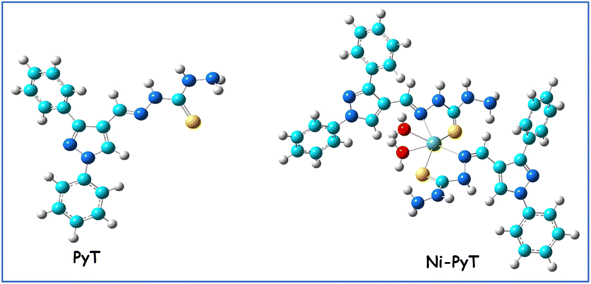
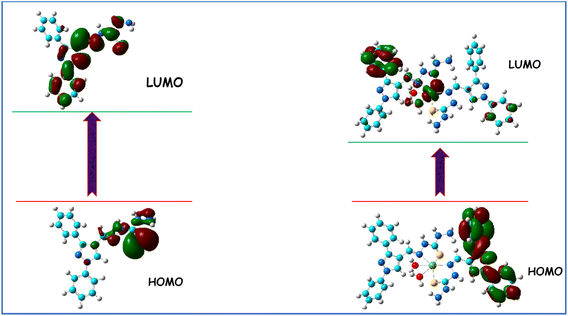
DFT calculations of the PyT structure have been reported in our previous research work.25 Herein, DFT calculations of the Ni(PyT) nanocomplex were carried out using the Gaussian 09 software.26 The standard base set B3LYB/6-311G(p,d) was used to optimize the geometry. Using Gauss View 5.0.9 software, the optimal structure and HOMO–LUMO of the produced compounds were determined.273 Results and discussion
3.1. Characterization of the Ni (PyT) nanocomplex
PyT was reacted directly with Ni(II) ions at a molar ratio of 1![[thin space (1/6-em)]](https://www.rsc.org/images/entities/char_2009.gif) :
:![[thin space (1/6-em)]](https://www.rsc.org/images/entities/char_2009.gif) 2, producing a pure reddish-brown precipitate of the Ni(PyT) complex, which has the general formula of [Ni(PyT)2(H2O)2]Cl2·½H2O. The powder exhibited no change or decomposition at room temperature, demonstrating excellent stability in the air. However, upon heating to 300 °C, the complex underwent decomposition, which suggests high thermal stability, and as a result, a strong coordination bond between the Ni2+ ions and PyT. In organic solvents such as acetone, methanol and ethanol, the Ni(PyT) complex was weakly soluble. However, the Ni(PyT) complex easily dissolved in the solvents DMF and DMSO. The elemental examination supported the predicted structure of Ni(PyT) given in Scheme 1. According to the analytical results, the Ni(PyT) complex was formed when Ni2+ and PyT were reacted at a stoichiometric ratio of 1
2, producing a pure reddish-brown precipitate of the Ni(PyT) complex, which has the general formula of [Ni(PyT)2(H2O)2]Cl2·½H2O. The powder exhibited no change or decomposition at room temperature, demonstrating excellent stability in the air. However, upon heating to 300 °C, the complex underwent decomposition, which suggests high thermal stability, and as a result, a strong coordination bond between the Ni2+ ions and PyT. In organic solvents such as acetone, methanol and ethanol, the Ni(PyT) complex was weakly soluble. However, the Ni(PyT) complex easily dissolved in the solvents DMF and DMSO. The elemental examination supported the predicted structure of Ni(PyT) given in Scheme 1. According to the analytical results, the Ni(PyT) complex was formed when Ni2+ and PyT were reacted at a stoichiometric ratio of 1![[thin space (1/6-em)]](https://www.rsc.org/images/entities/char_2009.gif) :
:![[thin space (1/6-em)]](https://www.rsc.org/images/entities/char_2009.gif) 2.
2.
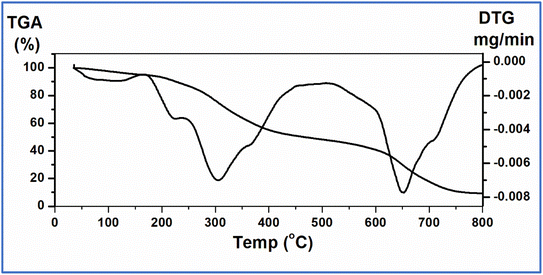
The hypothesized chemical structure of the Ni(PyT) complex is based on analytical data obtained from the thermal gravimetric analysis (TGA). As shown in Fig. 1, the Ni(PyT) complex loses two coordinated water molecules and half a lattice water molecule at 169 °C with an observed weight loss of 5.50% (calcd 5.31%). Then, two molecules of HCl are removed at a higher temperature (250 °C) with a weight loss of 14.00% (calcd 13.91%). The Ni(PyT) complex continues to degrade thereafter from 250 to 433 °C, exhibiting a weight loss of 50.50% (calcd 50.78%), which is attributed to the removal of four molecules of C6H6.
The molar conductance of a 10−3 M solution of the Ni(PyT) complex was found to be in a range typical of 1![[thin space (1/6-em)]](https://www.rsc.org/images/entities/char_2009.gif) :
:![[thin space (1/6-em)]](https://www.rsc.org/images/entities/char_2009.gif) 2 electrolytes at ambient temperature, showing that two anions were present as counter ions outside the coordination sphere.28,29
2 electrolytes at ambient temperature, showing that two anions were present as counter ions outside the coordination sphere.28,29
IR spectral data of PyT and the Ni(PyT) nanocomplex were compared, and some clear and observable spectral changes were found. In addition, the FT-IR data are used to support the chelation modes of PyT with the metal ion. The presence of stretching vibrations of the N–H and C![[double bond, length as m-dash]](https://www.rsc.org/images/entities/char_e001.gif) S groups in the spectrum of Ni(PyT) confirms the coordination of PyT with the metal ion in neutral form. The shift of the ν(NHC
S groups in the spectrum of Ni(PyT) confirms the coordination of PyT with the metal ion in neutral form. The shift of the ν(NHC![[double bond, length as m-dash]](https://www.rsc.org/images/entities/char_e001.gif) S) of PyT (1235, 843 cm−1) to lower wavenumbers (1205, 828 cm−1) in the spectrum of the complex indicates that thioxo sulfur was chelated with the metal ion.30 In addition, the negative shift of the ν(CH
S) of PyT (1235, 843 cm−1) to lower wavenumbers (1205, 828 cm−1) in the spectrum of the complex indicates that thioxo sulfur was chelated with the metal ion.30 In addition, the negative shift of the ν(CH![[double bond, length as m-dash]](https://www.rsc.org/images/entities/char_e001.gif) N) signal from 1617 cm−1 (PyT) to 1597 cm−1 (the Ni(PyT) complex) indicates that the nitrogen of the azomethine group bonded with the metal ion.24,30 Moreover, the 11 cm−1 shift of the ν(N–N) of PyT to lower wavenumbers in the Ni(PyT) complex spectrum supports the involvement of azomethine nitrogen in coordination.30 The coordination of the azomethine group is further supported by the presence of a non-ligand band at 469 cm−1 assigned to ν(M–N).31,32 The IR spectrum of the Ni(PyT) complex revealed a new band at 3410 cm−1 corresponding to the ν(OH) group of lattice water.33,34 The emergence of a band at 506 cm−1 corresponding to ν(M ← O) in the FT-IR spectrum of the Ni(PyT) complex is another evidence in favour of the above hypothesis.34,35
N) signal from 1617 cm−1 (PyT) to 1597 cm−1 (the Ni(PyT) complex) indicates that the nitrogen of the azomethine group bonded with the metal ion.24,30 Moreover, the 11 cm−1 shift of the ν(N–N) of PyT to lower wavenumbers in the Ni(PyT) complex spectrum supports the involvement of azomethine nitrogen in coordination.30 The coordination of the azomethine group is further supported by the presence of a non-ligand band at 469 cm−1 assigned to ν(M–N).31,32 The IR spectrum of the Ni(PyT) complex revealed a new band at 3410 cm−1 corresponding to the ν(OH) group of lattice water.33,34 The emergence of a band at 506 cm−1 corresponding to ν(M ← O) in the FT-IR spectrum of the Ni(PyT) complex is another evidence in favour of the above hypothesis.34,35
Therefore, according to the IR analysis, PyT functions as a neutral bidentate ligand with indents at azomethine N and thione S.
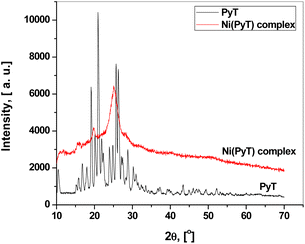
Fig. 2 represents the XRD patterns of the PyT and Ni(PyT) complex powders. PyT has a crystalline form according to the XRD patterns; however, the Ni(PyT) complex has a fine nanocrystalline nature. The crystallite size L of the Ni(PyT) complex was calculated from the main peak using the Scherer equation L = 0.9λ/(β![[thin space (1/6-em)]](https://www.rsc.org/images/entities/char_2009.gif) cos
cos![[thin space (1/6-em)]](https://www.rsc.org/images/entities/char_2009.gif) θ), where θ is the diffraction angle, and β is the full width at half maximum.36 The calculated crystallite size of the Ni(PyT) complex was about 4.4 nm. The chelation of the metal ion with PyT to form a new complex was confirmed by the differences in diffraction intensity and diffraction angle between PyT and its Ni(PyT) complex.37
θ), where θ is the diffraction angle, and β is the full width at half maximum.36 The calculated crystallite size of the Ni(PyT) complex was about 4.4 nm. The chelation of the metal ion with PyT to form a new complex was confirmed by the differences in diffraction intensity and diffraction angle between PyT and its Ni(PyT) complex.37
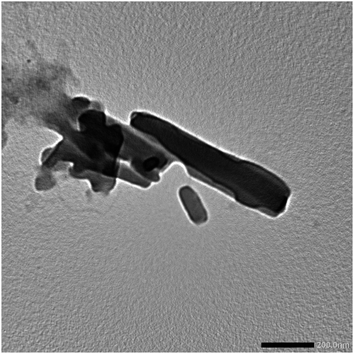
The TEM image of the Ni(PyT) complex showed that the Ni(PyT) complex has a rod shape with an average diameter of 48 nm (Fig. 3).
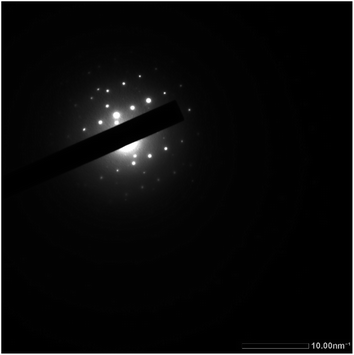
The selected area electron diffraction (SAED) patterns of the Ni(PyT) complex showed good diffraction rings, indicating its crystalline nature (Fig. 4).
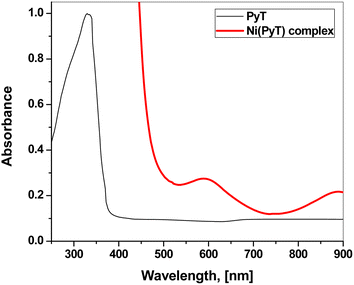
As shown in Fig. 5, the UV-Vis electronic spectra of the DMF solutions of PyT and its Ni(PyT) complex were measured. The absorption spectrum of PyT showed one absorption band at 332 nm due to the n–π* transitions within the C![[double bond, length as m-dash]](https://www.rsc.org/images/entities/char_e001.gif) S and C
S and C![[double bond, length as m-dash]](https://www.rsc.org/images/entities/char_e001.gif) N groups. The other band that appeared as a shoulder at 370 nm could be attributed to the π–π* transitions within the aromatic rings.38,39 In the UV-Vis spectrum of Ni(PyT), the bands of the intra-ligand were shifted to a higher wavelength. This behavior implies that the metal ions coordinate with nitrogen and/or sulfur. Moreover, the absorption spectrum of Ni(PyT) exhibited bands in the visible region. One band appeared at 592 nm, and the other band appeared as a hump at 890 nm. These bands could be assigned to the 3A2g(F) → 3T1g(F) and 3A2g(P) → 3T1g(P) transitions in the octahedral Ni(II) complex.40,41 Furthermore, the magnetic moment of the Ni(PyT) complex was measured, and its value was 2.9 B.M. This result is consistent with the octahedral geometry.42
N groups. The other band that appeared as a shoulder at 370 nm could be attributed to the π–π* transitions within the aromatic rings.38,39 In the UV-Vis spectrum of Ni(PyT), the bands of the intra-ligand were shifted to a higher wavelength. This behavior implies that the metal ions coordinate with nitrogen and/or sulfur. Moreover, the absorption spectrum of Ni(PyT) exhibited bands in the visible region. One band appeared at 592 nm, and the other band appeared as a hump at 890 nm. These bands could be assigned to the 3A2g(F) → 3T1g(F) and 3A2g(P) → 3T1g(P) transitions in the octahedral Ni(II) complex.40,41 Furthermore, the magnetic moment of the Ni(PyT) complex was measured, and its value was 2.9 B.M. This result is consistent with the octahedral geometry.42
3.2. Dielectric properties
Electrical polarization reduces the electric field inside materials by a factor called complex dielectric permittivity ε*, which is given by the following formula:43–45| ε* = ε1 − iε2 |
where A is the effective area, d is the thickness of the sample and εo is the permittivity of the vacuum (εo = 8.85 × 10⁻¹² F m−1). The response of the dielectric constant to frequency and temperature are shown in Fig. 6(a and b). Clearly, ε1 decreased with increasing frequency. On the other hand, ε1 increased with the temperature, reaching its maximum value at 323.5 K at all studied frequencies except for the lowest frequency (200 Hz) for which the maximum value was at 333.5 K. Then, ε1 decreased with a further increase in temperature.
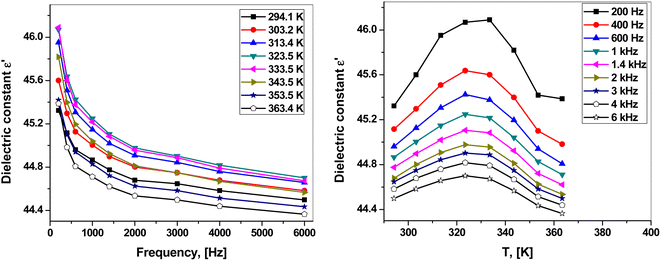 | ||
| Fig. 6 (a) Frequency dependence of the dielectric constant. (b) Temperature dependence of the dielectric constant. | ||
The dielectric constant shows the ability of a material to store electric charge because it refers to the degree of polarization.42,44 The high dielectric constant ε1 of the polar material at low frequencies results from different polarization types (interfacial, orientation, ionic and electronic polarization).42,48 The dielectric constant decreases with increasing frequency because the dipoles are unable to rotate rapidly. This decreases the ionic and orientation contributions.49 On the other hand, the first increase in temperature facilitates the orientation of the dipoles, leading to an increase in the dielectric constant. The following decrease in ε1 at the higher temperature range might result from the change in the structure of the complex and the loss of lattice water (Fig. 1).44,48
The dielectric loss ε2, which represents the dissipation of energy, was calculated from the measured loss tangent tan![[thin space (1/6-em)]](https://www.rsc.org/images/entities/char_2009.gif) δ as follows:45,46
δ as follows:45,46
ε2 = ε1![[thin space (1/6-em)]](https://www.rsc.org/images/entities/char_2009.gif) tan tan![[thin space (1/6-em)]](https://www.rsc.org/images/entities/char_2009.gif) δ δ |
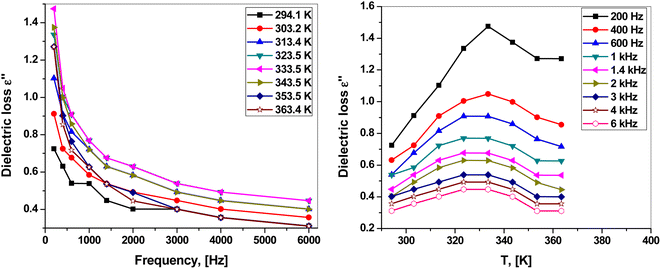
The dependence of dielectric loss ε2 on the frequency and temperature is presented in Fig. 7(a and b). Clearly, the dielectric loss behaved similarly to the dielectric constant in response to frequency and temperature. Fig. 7(a) shows that ε2 decreased with increasing frequency. Fig. 7(b) shows that ε2 increased with increasing temperature, reaching a maximum at around 323.5–333.5 K, and then decreased with a further increase in temperature.
At low frequencies, ε2 has a high value because of different factors such as ion polarization, ion jump, ion vibration, and conduction loss of charge carriers. Some of these sources are lost with increasing frequency, leading to a decrease in dielectric loss.42,44
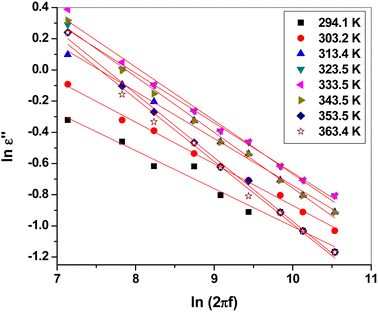
When a material is placed in an electric field, electrons hop from the donor to acceptor states, forming a dipole for each pair of these sites.17,18 The relaxation time τ of each dipole depends on the activation energy attributed to a potential barrier.50 This potential barrier results from the coulombic interaction between the neighboring sites of the dipoles.19–21 The dielectric loss ε2 is related to the frequency of the applied field as follows:22,44,51,52
| ε2 = constant × (2πf)m |
Fig. 8 shows the plot of ln![[thin space (1/6-em)]](https://www.rsc.org/images/entities/char_2009.gif) ε2 versus ln(2πf). Clearly, they could be fitted linearly at all temperatures, obeying the previous equation. The frequency exponent m was determined from the slope of the linear fittings. The barrier height Wm was calculated at each temperature using the following formula:51,52
ε2 versus ln(2πf). Clearly, they could be fitted linearly at all temperatures, obeying the previous equation. The frequency exponent m was determined from the slope of the linear fittings. The barrier height Wm was calculated at each temperature using the following formula:51,52
| Wm = −4kBT/m |
| T [K] | Wm [eV] |
|---|---|
| 294.1 | 0.42 |
| 303.2 | 0.39 |
| 313.4 | 0.36 |
| 323.5 | 0.35 |
| 333.5 | 0.34 |
| 343.5 | 0.33 |
| 353.5 | 0.30 |
| 363.4 | 0.31 |
3.3. AC conductivity
The ac conductivity was determined from the dielectric loss as follows:53–55| σac = ωεoε2 |
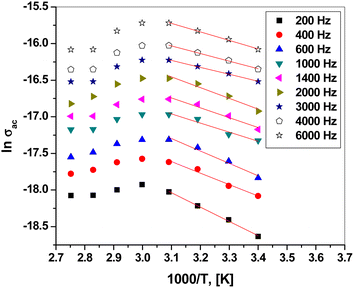
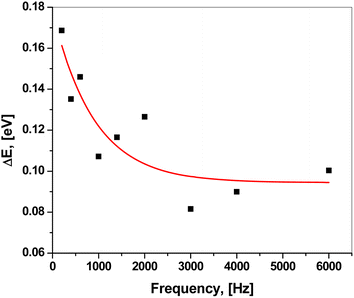
Fig. 9 presents the plot of ln![[thin space (1/6-em)]](https://www.rsc.org/images/entities/char_2009.gif) σac versus 1000/T at different frequencies. Clearly, σac increased with increasing temperature up to 323.5 K, obeying the Arrhenius relation:56–58
σac versus 1000/T at different frequencies. Clearly, σac increased with increasing temperature up to 323.5 K, obeying the Arrhenius relation:56–58
The frequency dependence of ac conductivity σac could be explained by the following equation:62–64
| σac = constant × (2πf)S |
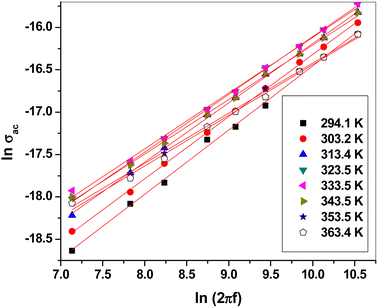
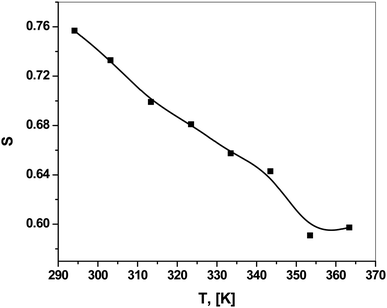
The frequency exponent S refers to the degree of interaction between the ions and their surroundings65 and helps in identifying the conduction mechanism. ln![[thin space (1/6-em)]](https://www.rsc.org/images/entities/char_2009.gif) σac was plotted versus ln(2πf), as shown in Fig. 11. This relation yielded a linear curve with slope S. Fig. 12 shows the temperature dependence of the frequency exponent S. The S values were less than 1 and decreased with increasing temperature over most of the studied range. Thus, ac conduction can be explained as correlated barrier hopping (CBH) between randomly distributed close pairs of centers (5–10 Å apart).19,20,65 This mechanism is called correlated barrier hopping between non-intimate valence alternation pairs (CBH-NVAPs) which has been explained in detail by Elliott.19,21,55,65,66
σac was plotted versus ln(2πf), as shown in Fig. 11. This relation yielded a linear curve with slope S. Fig. 12 shows the temperature dependence of the frequency exponent S. The S values were less than 1 and decreased with increasing temperature over most of the studied range. Thus, ac conduction can be explained as correlated barrier hopping (CBH) between randomly distributed close pairs of centers (5–10 Å apart).19,20,65 This mechanism is called correlated barrier hopping between non-intimate valence alternation pairs (CBH-NVAPs) which has been explained in detail by Elliott.19,21,55,65,66
3.4. DFT calculations
| Compound | Total energy (au) | Dipole moment (Debye) | EHOMO (eV) | ELUMO (eV) | Eg (eV) |
|---|---|---|---|---|---|
| PyT | −1384 | 6.712 | −5.582 | −1.783 | 3.797 |
| Ni-PyT | −4429 | 4.940 | −3.193 | −2.155 | 1.038 |
4 Conclusion
The pyrazole thiocarbohydrazide complex of Ni(II) (Ni(PyT) was successfully synthesized. Using the TGA–DTG technique, elemental analysis, molar conductivity, UV-Vis, FT-IR, and XRD spectroscopy, as well as magnetic moment measurements, the synthesized complex was identified and verified. The Ni(PyT) complex has a nanocrystalline structure with a crystallite size of about 4.4 nm. All data reveal that the octahedral geometry of the Ni(PyT) complex is formed via the coordination of the N and S donor sites of the PyT ligand with the Ni(II) metal center. Increasing the frequency of the applied field reduces the dielectric loss and dielectric constant. These values increase with increasing temperature, reaching the maximum at 323.5 K at most of the frequencies tested. Then, they decrease with increasing temperature. These properties can be explained by considering a set of dipoles and the existence of a potential barrier over which the charges must hop. This barrier decreases with increasing temperature. The results suggest that correlated barrier hopping is the mechanism of ac conduction in which hopping happens between non-intimate valence alternation pairs. The energy gap of the Ni(PyT) nanocomplex is 1.038 eV. The interaction of the Ni(II) ions with PyT leads to a redshift and decreases the energy gap from 3.797 to 1.038 eV.Conflicts of interest
The authors declare that they do not have any conflicts of interest related to this work.Acknowledgements
The second author extends his appreciation to the Deanship of Scientific Research at King Khalid University for funding this work through a large group Research Project under grant number RGP-2/576/44.References
- P. T. Acharya, Z. A. Bhavsar, D. J. Jethava, D. B. Patel and H. D. Patel, A review on development of bio-active thiosemicarbazide derivatives: Recent advances, J. Mol. Struct., 2021, 1226, 129268 CrossRef CAS.
- F. Kurzer and M. Wilkinson, Chemistry of carbohydrazide and thiocarbohydrazide, Chem. Rev., 1970, 70, 111–149 CrossRef CAS PubMed.
- S. S. Kadam, R. P. Gotarne, M. N. Shinde, V. S. Mane, A. A. Khan and A. A. Kumbhar, Fe(III), Co(II), Ni(II), Cu(II) and Zn(II) complexes of fluorophore-anchored asymmetric thiocarbohydrazone: Synthesis, characterization and biological studies, Inorg. Chim. Acta, 2022, 536, 120887 CrossRef CAS.
- M. P. Sathisha, U. N. Shetti, V. K. Revankar and K. S. R. Pai, Synthesis and antitumor studies on novel Co(II), Ni(II) and Cu(II) metal complexes of bis(3-acetylcoumarin) thiocarbohydrazone, Eur. J. Med. Chem., 2008, 43, 2338–2346 CrossRef CAS PubMed.
- Z. H. Abd El-Wahab, M. M. Mashaly, A. A. Salman, B. A. El-Shetary and A. A. Faheim, Co(II), Ce(III) and UO2(VI) bis-salicylatothiosemicarbazide complexes: Binary and ternary complexes, thermal studies and antimicrobial activity, Spectrochim. Acta, Part A, 2004, 63, 2861 CrossRef PubMed.
- Y. Lv, J. Zhang, P. Li, T. Deng, Y. Nan, Z. Lei, Y. Li and L. Li, Microstructure and dielectric properties of Na and Ni co-substituted CaCu3Ti4O12 ceramics with high dielectric constant and low loss, Mater. Chem. Phys., 2024, 315, 128973 CrossRef CAS.
- M. E. Alkış, K. Buldurun, N. Turan, Y. Alan, Ü. K. Yılmaz and A. Mantarcı, Synthesis, characterization, antiproliferative of pyrimidine based ligand and its Ni(II) and Pd(II) complexes and effectiveness of electroporation, J. Biomol. Struct. Dyn., 2022, 40, 4073–4083 CrossRef PubMed.
- K. Buldurun, Synthesis, characterization, thermal study and optical property evaluation of Co(II), Pd(II) complexes containing Schiff bases of thiophene-3-carboxylate ligand, J. Electron. Mater., 2020, 49, 1935–1943 CrossRef CAS.
- N. Turan, H. Seymen, B. Gündüz, K. Buldurun and N. Çolak, Synthesis, characterization of Schiff base and its metal complexes and investigation of their electronic and photonic properties, Opt. Mater., 2024, 148, 114802 CrossRef CAS.
- N. Turan, K. Buldurun, B. Gündüz and N. Çolak, Synthesis and structures of Fe(II), Zn(II) and Pd(II) complexes with a Schiff base derived from methyl 2-amino-6-methyl-4,5,6,7-tetrahydrothieno[2,3-c]pyridine-3-carboxylate and comparison of their optical constants for different solvents and molarities, J. Nanoelectron.Optoelectron., 2017, 12, 1028–1040 CrossRef CAS.
- F. A. Almashal, M. Q. Mohammed, Q. M. Ali Hassan, C. A. Emshary, H. A. Sultan and A. M. Dhumad, Spectroscopic and thermal nonlinearity study of a Schiff base compound, Opt. Mater., 2020, 100, 109703 CrossRef CAS.
- I. Saleem, Qashou, Dielectric relaxation properties, and AC conductivity of Erbium(III)-Tris(8-hydroxyquinolinato) nanostructured films, Phys. B, 2023, 649, 414421 CrossRef.
- N. Shukla and D. K. Dwivedi, Dielectric relaxation and AC conductivity studies of Se90Cd10−xInx glassy alloys, J. Asian Ceram. Soc., 2016, 4, 178–184 CrossRef.
- N. Chandel, M. M. A. Imran and N. Mehta, Comprehensive studies of temperature and frequency dependent dielectric and conducting parameters in third generation multi-component glasses, RSC Adv., 2018, 8, 25468 RSC.
- H.-M. Li, C.-H. Ra, G. Zhang, W. J. Yoo and J.-D. LeeK-Wand Kim, J. Korean Phys. Soc., 2009, 54, 1096 CrossRef CAS.
- S. S. Shenouda, H. Y. Zahran and I. S. Yahia, Facile synthesis and characterization of Co3O4 nanoplates coated with small nanorods, Mater. Res. Express, 2019, 6, 105042 CrossRef CAS.
- N. F. Mott, E. A. Davis and R. A. Street, States in the gap and recombination in amorphous semiconductors, Phil. Mag., 1975, 32, 961 CrossRef CAS.
- R. A. Street and N. F. Mott, States in the Gap in Glassy Semiconductors, Phys. Rev. Lett., 1975, 35, 1293 CrossRef CAS.
- S. R. Elliot, A theory of a.c. conduction in chalcogenide glasses, Philos. Mag. B, 1977, 36, 1291 CrossRef.
- S. R. Elliott, Temperature dependence of a.c. conductivity of chalcogenide glasses, Philos. Mag. B, 1978, 37, 135 Search PubMed.
- S. R. Elliot, AC conductivity due to intimate pairs of charged defect centres, Solid State Commun., 1978, 27, 749 CrossRef.
- J. C. Giuntini, J. V. Zanchetta, D. Jullien, R. Eholie and P. Houenou, Temperature dependence of dielectric losses in chalcogenide glasses, J. Non-Cryst. Solids, 1981, 45, 57 CrossRef CAS.
- N. F. Mott, Conduction in Non-crystalline Materials, Clarendon Press, Oxford, 2nd edn, 1993 Search PubMed.
- S. R. A. Allah, W. S. I. A. Elmagd, K. A. A. Kandeel, M. M. Hemdan, D. S. A. Haneen and A. S. A. Youssef, Synthesis and antimicrobial activity evaluation of some novel hydrazone, pyrazolone, chromenone, 2-pyridone and 2-pyrone derivatives, J. Chem. Res., 2017, 61, 617–623 CrossRef.
- R. Fouad, T. E. Ali, M. A. Assiri and S. S. Shenouda, Novel Co(II) complex containing N-phenyl-1H-pyrazole moiety: Synthesis, characterization, and dielectric/electrical studies, Inorg. Chem. Commun., 2024, 162, 112195 CrossRef CAS.
- M. A. Robb, J. R. Cheeseman, G. Scalmani, V. Barone, B. Mennucci, G. A. Petersson, H. Nakatsuji, M. Caricato, X. Li, H. P. Hratchian, A. F. Izmaylov, J. Bloino, G. Zheng, J. L. Sonnenberg, M. Hada, M. Ehara, K. Toyota, R. Fukuda, J. Hasegawa, M. Ishida, T. Nakajima, Y. Honda, O. Kitao, H. Nakai, T. Vreven, J. A. Montgomery Jr, J. E. Peralta, F. Ogliaro, M. Bearpark, J. J. Heyd, E. Brothers, K. N. Kudin,V. N. Staroverov, R. Kobayashi, J. Normand, K. Raghavachari, A. Rendell, J. C. Burant, S. S. Iyengar, J. Tomasi, M. Cossi, N. Rega, J. M. Millam, M. Klene, J. E. Knox, J. B. Cross, V. Bakken, C. Adamo, J. Jaramillo, R. Gomperts, R. E. Stratmann, O. Yazyev, A. J. Austin, R. Cammi, C. Pomelli, J. W. Ochterski, R. L. Martin, K. Morokuma, V. G. Zakrzewski, G. A. Voth, P. Salvador, J. J. Dannenberg, S. Dapprich, A. D. Daniels, O. Farkas, J. B. Foresman, J. V. Ortiz, J. Cioslowski and D. J. Fox, Gaussian Inc., Wallingford, CT, 2009.
- R. Dennington, T. Keith and J. Millam, GaussView, Version 5, Semichem Inc., Shawnee Mission KS, 2009 Search PubMed.
- W. J. Geary, The use of conductivity measurements in organic solvents for the characterisation of coordination compounds, Coord. Chem. Rev., 1971, 7, 81 CrossRef CAS.
- S. A. AbouEl-Enein, S. M. Emam, R. M. Wagdy and F. I. Abouzayed, Spectral and thermal investigation of novel biologically active (N-(1dimethyl-3-oxo-2-phenyl-2,3-dihydro-1H-pyrazol-4-yl)-2-(1,5dimethyl-3-oxo-2-phenyl-2,3-dihydro-1H-pyrazol-4-yl-amino)-2oxo-cetimidic acid) ligand and its metal complexes, J. Mol. Struct., 2020, 1215, 128230 CrossRef CAS.
- T. A. Yousef, G. M. Abu El-Reash, M. Al-Jahdali and E.-B. R. El-Rakhawy, Synthesis, spectral characterization and biological evaluation of Mn(II), Co(II), Ni(II), Cu(II), Zn(II) and Cd(II) complexes with thiosemicarbazone ending by pyrazole and pyridyl rings, Spectrochim. Acta, Part A, 2014, 129, 163–172 CrossRef CAS PubMed.
- M. Shebl, Synthesis and spectroscopic studies of binuclear metal complexes of a tetradentate N2O2 Schiff base ligand derived from 4,6-diacetyl resorcinol and benzylamine, Spectrochim. Acta, Part A, 2008, 70, 850 CrossRef PubMed.
- O. M. I. Adly and A. Taha, Coordination diversity of new mononuclear ONS hydrazone with transition metals: Synthesis, characterization, molecular modeling and antimicrobial studies, J. Mol. Struct., 2013, 1038, 250 CrossRef CAS.
- U. P. S. Prabhakar, Synthesis, structural elucidation of metal nanoparticles prepared from metal complexes via thermal decomposition method, Appl. Surf. Sci. Adv., 2023, 13, 100357 CrossRef.
- M. Saif, M. M. Mashaly, M. F. Eid and R. Fouad, Synthesis and thermal studies of tetraaza macrocylic ligand and its transition metal complexes. DNA binding affinity of copper complex, Spectrochim. Acta, Part A, 2011, 79, 1849 CrossRef CAS PubMed.
- M. Saif, M. M. Mashaly, M. F. Eid and R. Fouad, Synthesis, characterization and thermal studies of binary and/or mixed ligand complexes of Cd(II), Cu(II), Ni(II) and Co(III) based on 2-(Hydroxybenzylidene) thiosemicarbazone: DNA binding affinity of binary Cu(II) complex, Spectrochim. Acta, Part A, 2012, 92, 347 CrossRef CAS PubMed.
- B. D. Cullity, Elements of X-Ray Diffraction, Addison-Wesley Publishing Co., Reading MA, 2nd edn, 1978 Search PubMed.
- R. Fouad and O. M. I. Adly, Novel Cu(II), Zn(II) Nanocomplexes Drug Based on Hydrazone Ligand Bearings Chromone & Triazine moiety: Structural, Spectral, DFT, Molecular Docking and Cytotoxic Studies, J. Mol. Struct., 2021, 1225, 129158 CrossRef CAS.
- R. Fouad and A. A. M. Ali, Novel electrospun fibers as carriers for delivering a biocompatible Sm(III) nanodrug for cancer therapy: fabrication, characterization, cytotoxicity and toxicity, RSC Adv., 2023, 13, 1883–1891 RSC.
- B. I. Ceylan, Y. Kurt, O. Bolukbasi, A. Yilmaz, K. Kaya and B. Ülküseven, Synthesis, spectroscopic characterization and quantum chemical studies of a dioxomolybdenum(VI) complex with an N,Ssubstituted pyridoxal thiosemicarbazone, Polyhedron, 2020, 193, 114884 CrossRef.
- M. Saif, H. F. El-Shafiy, M. M. Mashaly, M. F. Eid, A. I. Nabeel and R. Fouad, Synthesis, characterization, and antioxidant/cytotoxic activity of new chromone Schiff base nanocomplexes of Zn(II), Cu(II), Ni(II) and Co(II), J. Mol. Struct., 2016, 1118, 75–82 CrossRef CAS.
- A. Cotton and G. Wilkinson, Advanced Inorganic Chemistry, A Comprehensive Text, John Wiley & Sons, New York, 4th edn, 1986 Search PubMed.
- R. Fouad, I. A. Shaaban, T. E. Ali, M. A. Assiri and S. S. Shenouda, Co(II), Ni(II), Cu(II) and Cd(II)-thiocarbonohydrazone complexes: spectroscopic, DFT, thermal, and electrical conductivity studies, RSC Adv., 2021, 11, 37726–37743 RSC.
- A. Singh, H. P. Gogoi and P. Barman, Synthesis of metal oxide nanoparticles by facile thermal decomposition of new Co(II), Ni(II), and Zn(II) Schiff base complexes- optical properties and photocatalytic degradation of methylene blue dye, Inorg. Chim. Acta, 2023, 546, 121292 CrossRef CAS.
- N. A. El-Ghamaz, A. Z. El-Sonbati, M. A. Diab, A. A. El-Bindary, G. G. Mohamed and Sh. M. Morgan, Correlation between ionic radii of metal azodye complexes and electrical Conductivity, Spectrochim. Acta, Part A, 2015, 147, 200–211 CrossRef CAS PubMed.
- A. Nitika and A. Rana, Study of anneal-tuned dielectric properties, AC conductivity, complex impedance, and modulus of cobalt ferrite nanoparticles, Mater. Today: Proc., 2021, 45, 5444–5448 CAS.
- H. Y. Zahran, S. S. Shneouda, I. S. Yahia and F. El-Tantawy, Facile and rapid synthesis of nanoplates Mg(OH)2 and MgO via Microwave technique from metal source: structural, optical and dielectric properties, J. Sol-Gel Sci. Technol., 2018, 86, 104–111 CrossRef CAS.
- P. Priyadarshini, S. Senapati, S. Bisoyi, S. Samal and R. Naik, J. Alloys Compd., 2023, 945, 169222 CrossRef CAS.
- B. Tareev, Physics of Dielectric Material, Mir Publishers, Moscow, 1975 Search PubMed.
- A. H. Ahmed and M. G. Moustafa, Spectroscopic, morphology and electrical conductivity studies on Co(II), Ni(II), Cu(II) and Mn(II)-oxaloyldihydrazone complexes, J. Saudi Chem. Soc., 2020, 24, 381–392 CrossRef CAS.
- M. Pollak and G. E. Pike, ac conductivity of glasses, Phys. Rev. Lett., 1972, 28, 1449 CrossRef CAS.
- P. N. Musfir, S. Mathew, V. P. N. Nampoori and S. Thomas, Investigations on frequency and temperature dependence of AC conductivity and dielectric parameters in Ge20Ga5Sb10S65 quaternary chalcogenide glass, Optik, 2019, 182, 1244–1251 CrossRef CAS.
- A. E. Bekheet, Ac conductivity and dielectric properties of Ga2S3–Ga2Se3 films, Phys. B, 2008, 403, 4342–4346 CrossRef CAS.
- A. Ullah, I. U. Khan, M. Aljohani, K. Althubeiti, N. Rahman, M. Sohail, S. S. Abdullaev, A. Khan and R. Khan, Effect of yttrium on the structural, dielectric, and magnetic properties of Co-doped ZnO magnetic nanorods for potential spintronic applications, J. Mater. Sci.: Mater. Electron., 2023, 34, 1252 CrossRef CAS.
- A. El-ghandour, N. A. El-Ghamaza, M. M. El-Nahass and H. M. Zeyada, Temperature and frequency dependence outline of DC electrical conductivity, dielectric constants, and AC electrical conductivity in nanostructured TlInS2 thin films, Phys. E, 2019, 105, 13–18 CrossRef CAS.
- S. R. Elliott, A.C. conduction in amorphous chalcogenide and pnictide semiconductors, Adv. Phys., 1987, 36, 135–217 CrossRef CAS.
- A. M. Shakra, M. Fadel and S. S. Shenouda, Response of electrical and dielectric parameters of ZnIn2Te4 thin films to temperature and frequency, Phys. B, 2020, 586, 412082 CrossRef CAS.
- R. R. Sahoo and R. N. P. Choudhary, Investigation of structural, dielectric, impedance and leakage current behaviour of green phase of yttrium barium copper oxide:Y2BaCuO5, Phys. B, 2022, 640, 414027 CrossRef CAS.
- N. A. Hegab, M. A. Afifi, H. E. Atyia and A. S. Farid, ac conductivity and dielectric properties of amorphous Se80Te20−xGex chalcogenide glass film compositions, J. Alloys Compd., 2009, 477, 925 CrossRef CAS.
- S. I. Qashou, Dielectric relaxation properties, and AC conductivity of Erbium(III)-Tris(8-hydroxyquinolinato) nanostructured films, Phys. B, 2023, 649, 414421 CrossRef CAS.
- M. M. El-Nahass, A. A. Atta, E. F. M. El-Zaidia, A. A. M. Farag and A. H. Ammar, Electrical, conductivity and dielectric measurements of CoMTPP, Mater. Chem. Phys., 2014, 143, 490–494 CrossRef CAS.
- M. M. El-Nahass, E. F. M. El-Zaidia, A. A. A. Darwish and G. F. Salem, Dielectric relaxation, behavior and AC electrical conductivity study of 2-(1,2-Dihydro-7- Methyl- Oxoquinoline, 5-yl) Malononitrile (DMOQMN), J. Electron. Mater., 2017, 46, 1093–1099 CrossRef CAS.
- E. A. Davis and N. F. Mott, Conduction in non-crystalline systems V. Conductivity, optical absorption and photoconductivity in amorphous semiconductors, Phil. Mag., 1970, 22, 903–922 CrossRef CAS.
- O. Amorri, H. Slimi, A. Oueslati, A. Aydi and K. Khirouni, Investigation of the structural, optical, electrical and dielectric proprieties of LiCd0.5Fe2O4 spinel ferrite, Phys. B, 2022, 639, 414005 CrossRef CAS.
- M. Shoab, Z. Aslam, J. Ali and M. Zulfequar, Investigation of electrical conductivity (AC/DC) and dielectric properties of Se80Te152xCd5Bix (x = 0, 5, 10) quaternary chalcogenide glass, J. Mater. Sci.: Mater. Electron., 2023, 34, 681 CrossRef CAS.
- A. Anjali, B. S. Patial, S. Bhardwaj, A. M. Awasthi and N. Thakur, On the AC-conductivity mechanism in nano-crystalline Se79−xTe15In6Pbx (x = 0, 1, 2, 4, 6, 8 and 10) alloys, Phys. B, 2017, 523, 52–61 CrossRef.
- I. G. Austin and N. F. Mott, Polarons in crystalline and noncrystalline materials, Adv. Phys., 1969, 18, 41 CrossRef CAS.
- K. M. Ibrahim, R. R. Zaky, H. M. Abou-ElBader and S. M. Abo-Zeid, J. Mol. Struct., 2014, 1075, 71 CrossRef CAS.
| This journal is © The Royal Society of Chemistry 2024 |

