 Open Access Article
Study on microstructure evolution of waxy crude oil emulsions under dynamic cooling conditions†
Hang Dong a,
Nan Guoa,
Pengfei Zhangb,
Jian Zhao
 *a and
Zhihua Wang
 a
a
aEnergy-Saving and Consumption-Reducing Laboratory, Surface Engineering Pilot Test Center of CNPC, College of Petroleum Engineering, Northeast Petroleum University, Xuefu Street No. 99, Hi-tech Development Zone, Daqing, 163318, China. E-mail: zhaojian_nepu@163.com; Tel: +86-18345993453
bDaqing Oil Field Limited Liability Company Natural Gas Branch Production and Operation Department, Daqing, China
First published on 3rd April 2024
Abstract
A rheo-microscopy in situ synchronous measurement system was utilized to investigate the dynamic behavior of water droplets in W/O waxy crude oil emulsions subjected to dynamic cooling conditions, the microstructural evolution of water droplets aggregates can be categorized into three stages based on the various forms of wax crystals. The results show that under the joint action of wax crystals and water droplets, the water droplets aggregation trend and complexity in the system are negatively correlated with the changes of temperature and shear rate, and the water droplets movement behavior is positively correlated with the changes of temperature and shear rate. As the temperature decreases, the minimum edge distance of water droplets decreases by a maximum of 32.1%, the specific surface area (SA) decreases by a maximum of 12.0%, and the fractal dimension increases by a maximum of 11.7%. As the shear rate increases, the minimum edge distance of water droplets increases by up to 27.9%, the specific surface area (SA) increases by up to 10.1%, and the fractal dimension decreases by up to 8.5%. Additionally, an analysis is conducted on the collision aggregation behavior of water droplets in shear flow field based on population balance theory.
1. Introduction
In recent years, the global economy has witnessed sustained and rapid development, resulting in a persistently high demand for oil.1 According to the 2023 “BP World Energy Outlook” report, it is projected that there will be a stable trajectory in global oil demand over the next decade. As per the latest market report from the International Energy Agency (IEA), it is estimated that by 2024, the average daily global consumption of crude oil will reach approximately 102.3 million barrels.With the expansion of petroleum development, oil gathering and transportation technology primarily adopt a mixed transportation mode involving both oil and water. The presence of naturally occurring emulsifying agents such as asphaltenes and colloids makes the oil–water mixture susceptible to shearing action at wellheads, pipelines and valves, resulting in emulsion formation. Furthermore, due to the addition of dispersed phase, the rheological properties of waxy crude oil emulsion are more complicated than those of waxy crude oil. In order to analyze the rheological mechanism of waxy crude oil emulsion comprehensively, numerous scholars have conducted investigations on various conditions including viscosity temperature,2 thixotropic properties,3 yield stress,4 and viscoelastic characteristics.5 It has been observed that these properties are closely associated with shear rate,6,7 shear time,8 water content,9,10 temperature,11–15 as well as colloids and asphaltene content.16,17 With the continuous advancement of research and technological innovation, a growing number of researchers have redirected their focus towards investigating the evolutionary process of microstructure. Notably, some researchers have successfully achieved in situ microscopic observation by rheo-microscopy18,19 in many fields, such as blood,20 colloidal suspensions,21,22 crystals,23,24 fibers,25,26 soft materials27 and other complex multiphase system rheology and microstructure studies. Villa28 constructed a rheo-microscopic device that combined a stress-controlled rheometer with differential dynamic microscopic analysis of particle tracking to test the advantages and limitations of the sample under test. Keshtkar29 studied the rheological properties of fiber suspensions with different Young's modulus and different flexibility through the rheo-microscopy method. Soedarmo30 observed the process of in situ wax deposition on a microscopic scale, observed the morphology of mass transfer layer and wax deposition, and the study also investigated how different flow conditions affected the formation and structure of wax deposition crystals at a microscopic level. Macierzanka31 studied the effect of crystallization of acyl propylene glycol and zinc fatty acid carboxylates (ZnC) on the microstructure change, stability and viscoelasticity of the emulsion through in situ technology and rheological experiments, and concluded that the formation of interfacial crystallization and three-dimensional network of propylene alcohol in the continuous phase determined the anti-aggregation stability and viscoelasticity of the emulsion. Zhao et al.32,33 realized in situ observation of wax crystals and water droplets in waxy crude oil and its emulsion through rheo-microscopy in situ synchronous measurement technology, and explored the gelling behavior34 and mechanism of the emulsion.
In addition, the significance of the interaction between water droplets and wax crystals cannot be overlooked. Fan35 investigated water droplets and wax crystals interplay, examine its impact on both gel point and viscosity. Sun36 conducted experimental investigations on the viscoelastic and yield behavior during emulsion gelling process, elucidating the underlying mechanism through comprehensive analysis of experimental results. Furthermore, the collision and aggregation37,38 of water droplets in the oil–water phase under external conditions such as shear39 and electric field40,41 can be quantified using statistical approaches like assessing the collision frequency and agglomeration efficiency of water droplets.42–44 Subsequently, it can be utilized to forecast alterations in dynamic behavior45 of water droplets within the system induced by microscopic phenomena like collision and aggregation, which holds immense significance for further exploration of multidimensional behavioral characteristics exhibited by waxy crude oil emulsions.
In this study, the motion behavior of microscopic units in waxy crude oil emulsions during the dynamic cooling process was observed using rheo-microscopy28,29 in situ synchronous measurement technology.46 Additionally, the impact of gradual growth of wax crystals on water droplets aggregates microstructure, distribution characteristics, and motion behavior were analyzed. A quantitative extraction method based on image processing47 was employed to characterize water droplets motion behavior during cooling in a shear flow field. Rheo-microscopy in situ synchronous measurement technology has been utilized to investigate the dynamic behavior of wax crystals in waxy crude oil,33,48 as well as the aggregation and adhesion between water droplets within the emulsion. Based on previous research, this study focuses on examining the microscopic evolution behavior of wax crystals and water droplets within waxy crude oil emulsions. Furthermore, through rheological experiments and microscopic observations, combined with population balance theory,49 a mathematical model describing water droplets behavior under shear flow conditions was developed.
2. Experimental materials and methods
2.1 Experimental materials
The oil sample selected for this study is Hulunbuir crude oil, which is produced in Hulunbuir region of Inner Mongolia, China. It is a typical example of waxy crude oils. To ensure the accuracy and replicability of the experimental outcomes, it is crucial to pretreat the oil samples before preparing W/O emulsions in order to eliminate the influence of thermal history and shear history on the macroscopic rheological properties of waxy crude oil. The specific procedure is as follows: divide the oil sample into individual reagent bottles, heat in a water bath to 80 °C, followed by incubation at a constant temperature for 2 hours. This process ensures complete dissolution of wax crystals within the oil sample, as well as full ionization of colloids and asphaltenes components, thereby guaranteeing the accuracy of the test sample.The pre-treated oil samples undergo comprehensive analysis to determine their physical and chemical properties. According to industry standard “SY/T0545-2012”, the thermal characteristics of the oil samples were measured by differential scanning calorimetry (DSC). The results revealed wax appearance point temperature (WAT) of 47 °C and wax crystal content of 16.34 wt%. Based on “SY/T-2016”, column separation method was employed to determine that saturated hydrocarbons (WT) constituted 65.8 wt%, naphthenes accounted for 18 wt%, colloids were 11.8 wt% and asphaltenes were 4.4 wt%. Furthermore, following Chinese standard “GB/T2013-2010”, the oil sample's density at a temperature of 20 °C, as measured by Anton Paar density meter 4500 M, is determined to be 835.6 kg m−3.
2.2 Experimental methods
(1) Water droplets velocity:
 | (1) |
(2) Specific surface area (SA)35,50
 | (2) |
SA is the specific surface area, μm−1; n is the number of water droplets, and d is the diameter of the water droplets, μm.
(3) The minimum edge distance of water droplets:
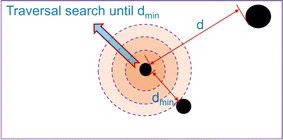
The minimum edge distance represents the minimum distance between water droplets, which can characterize the degree of aggregation between water droplets and indirectly reflect the strength of the interaction force between particles. In order to better demonstrate the calculation logic of this feature parameter, we present its diagram as follows, as shown in Fig. 1. For specific extraction methods, see literature.32
In addition to the aforementioned formula-derived microscopic parameters, ImageJ is also used to extract the fractal dimension of the water droplets.
3. Results and discussion
3.1 Results of rheo-microscopy in situ synchronous experiments
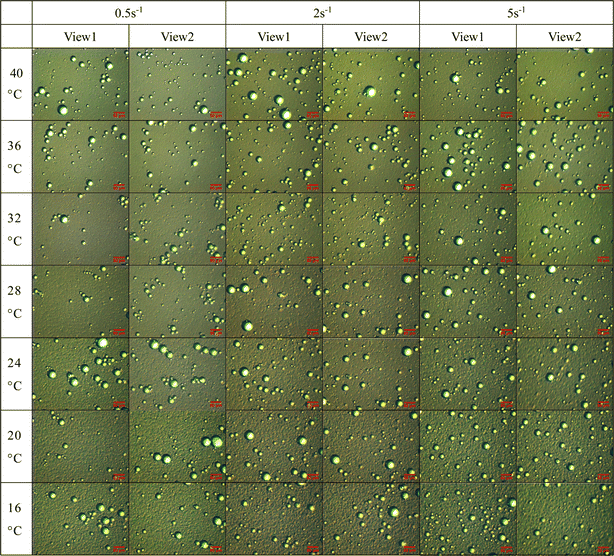
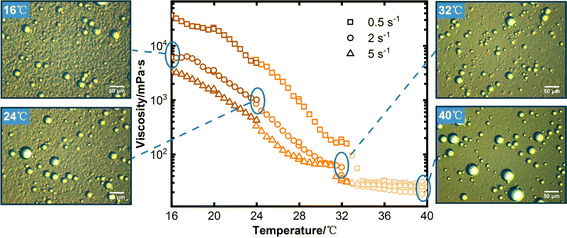
Fig. 2 displays the microscopic images of microscopic units in the emulsion extracted at different observation temperatures while undergoing a temperature reduction process from 40 °C to 16 °C under different shearing actions. In order to ensure the accuracy of the data, each characteristic parameters data in the paper is statistically obtained by extracting parameters from microscopic images of multiple fields of view, only two view fields are shown here for representation, and is shown below.As can be seen from Fig. 2, during the dynamic cooling process, the wax crystals in the emulsion of waxy crude oil continuous precipitation and growth, accompanied by the presence of the water droplets, the system structural transformation from the microstructure form of “monomer wax crystals + water droplets”, “wax crystals + water droplets aggregates” to “wax crystals + water droplets aggregates + liquid hydrocarbon flocs”. In the process of change, the liquid hydrocarbon gradually becomes enveloped within a three-dimensional network of growing wax crystal flocs, the temperature does not affect the water droplets due to its water composition, under constant shear rate, water droplets size remains relatively unchanged as temperature decreases, but there is a gradual transition in the relative motion relationship between the water droplets and the wax crystal particles and aggregates gradually changes from free motion to no motion embedded in the flocculation network structure of wax crystals. The observation conducted at a specific temperature reveals that as the shear action increases, the arrangement and aggregation form of wax crystals and water droplets will be significantly changed, leading to a weakened degree of water droplets aggregation and an increased level of dispersion with higher shear rates. According to the analysis results presented in Fig. 2, we selected the temperatures corresponding to four representative structural changes observed during the cooling process. Subsequently, rheological and microscopic synchronization test results were extracted, as illustrated in Fig. 3.
The overall viscosity of the system decreases as the shear rate increases. Constant shear rate, there is a clear correlation between the viscosity curve and the synchronous microscopy results as temperature decreases, and the entire cooling process can be categorized into three distinct stages, exemplified by the experimental findings of 2 s−1. Subsequently, an analysis of the viscosity and synchronous microscopy results for each stage is conducted.
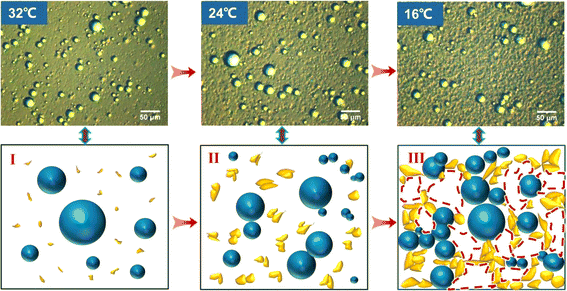
Stage I (40–32 °C): when the temperature is 40 °C, the wax crystal in the system is mainly monomer particle structure, and the viscosity of the system is relatively small, which is 18.486 mPa s. With the temperature decreasing gradually, the particles grow and increase gradually, but before 32 °C, the wax crystal particles and monomer water droplets are mainly in the system, and the wax crystal particles are more evenly distributed around the water droplets. Under the action of shearing, wax crystals and water droplets can move freely without contact and aggregation with each other, and the water droplets will have obvious disturbances to the flow field due to their large mass. Due to the small mass of wax crystals, their motion behaviors such as rotation and tumbling become more pronounced under shear and disturbance, in this stage, the viscosity increased slowly, from 18.486 mPa s to 41.763 mPa s.
Stage II (32–24 °C): the wax crystal particles in the system gradually grew when the temperature drops from 32 °C to 24 °C, aggregation occurs due to van der Waals force to form wax crystals aggregates, the aggregates gradually transitioned from a loose structure to a denser structure as the temperature decreased gradually. In addition, in the presence of the water droplets, the wax crystals aggregates adhere to the surface of the water droplets, which hinders the free motion of wax crystals and the water droplets aggregates. Among them, the stability of the loose aggregate is poor, and the wax crystals within the aggregates are prone to detachment from other particles or the water droplets under shear stress. When the temperature decreased, the aggregates gradually evolved into a dense structure, and its stability are relatively good, correspondingly, the system experienced a substantial increase in viscosity, with the value rising from 41.763 mPa s to 863.890 mPa s.
Stage III (24–16 °C): with the further decrease of temperature, the structure of wax crystal aggregates in the system gradually strengthened, and a large number of wax crystals adhered to the water droplets, and the structural damage no longer occurs under the shear action, the presence of the water droplets hinders the destruction of aggregates, and the presence of aggregates also hinders the motion of the water droplets. Wax crystal aggregates, liquid hydrocarbons, and water droplets aggregates together form the flocculation structures, the strength of the structure is more stable, the viscosity of the system also increased sharply from 863.890 mPa s to 6177.800 mPa s.
In order to present a clearer depiction of the microstructure evolution process in the aforementioned three stages, Fig. 4 illustrates the schematic diagram. The distribution relationships among liquid hydrocarbon, wax crystals, wax crystals + water droplets aggregates at different stages can be clearly seen.
Based on the analysis provided above, it is not difficult to find that the gelling structure of the waxy crude oil emulsion is significantly distinct from that of waxy crude oil due to the coexistence and interaction between water droplets and wax crystals in the cooling gelling process. Moreover, under shearing conditions, the motion behavior of water droplets and wax particles/aggregates changes significantly with the enhancement of shearing. In order to investigate the change of dynamic behavior of water droplets in the presence of wax crystal particles and aggregates under shear action and its effect on the gelling structure of the system, the microstructure and dynamic behavior of water droplets and wax crystals – water droplets aggregates during the cooling process were characterized.
3.2 Dynamic behavior of water droplets and wax crystals – water droplet aggregates
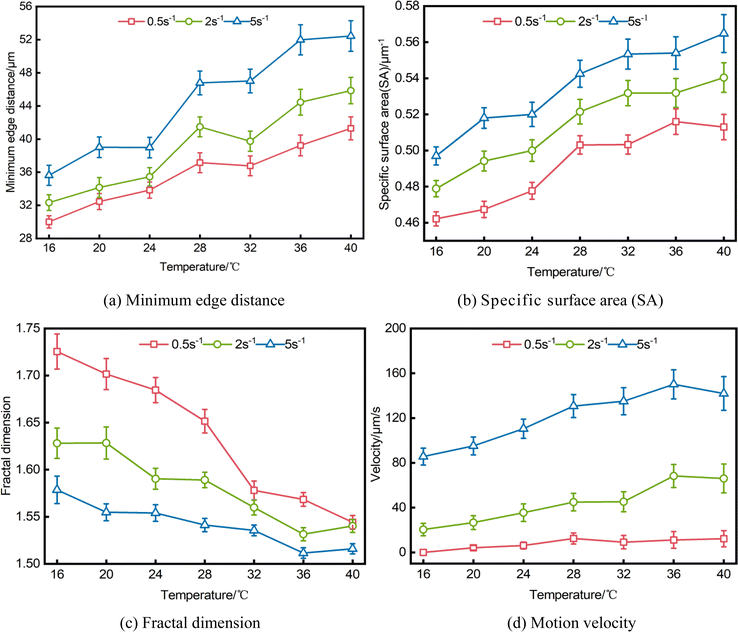
As previously stated, the waxy crude oil emulsion is accompanied by the continuous precipitation and growth of wax crystals during the cooling process. When subjected to shear forces, there are a collision and aggregation process between the water droplets and wax crystals present in the system, leading to their transformation from monomer water droplets and wax crystals into aggregates of wax crystals – water droplets, the microstructure, spatial distribution, and motion behavior of the system exhibit temperature and shear rate-dependent variations, leading to discernible discrepancies in the macroscopic rheological properties. Therefore, the microstructure and distribution characteristics of water droplets and wax crystals – water droplets aggregates are described by parameters such as the minimum edge distance, specific surface area (SA), fractal dimension of water droplets, while their motion behavior are characterized by velocity.The data in Fig. 5 demonstrates a gradual decrease in the motion velocity of the water droplets and its aggregates as the temperature decreases, additionally, an increase in shear rate results in a faster motion velocity. When the shear rate remains constant, the minimum edge distance and specific surface area (SA) of both water droplets and their aggregates gradually decrease with decreasing temperature. Simultaneously, the fractal dimension progressively increases, indicating an enhanced level of aggregation between water droplets and wax crystals following temperature reduction. The minimum edge distance and specific surface area (SA) increase with the rise in shear rate at a constant temperature, while the fractal dimension decreases, this observation suggests that the shearing effect enhances weakening of the aggregation behavior. In conjunction with the 3.1 analysis, it is evident that during Stage I of temperature variation, the minimum edge distance and specific surface area (SA) exhibit their maximum values, while the fractal dimension attains its minimum value, the wax crystals in the system exhibit reduced precipitation and predominantly exist in the form of particles, while the water droplets demonstrate a relatively unconstrained flow state. At this time, the distance between the water droplets is large, the degree of dispersion is high, the water droplets move independently and do not adhere to other wax crystals, and their morphological structure complexity is low. As the temperature drops to Stage II, as wax crystals gradually increase and grow, some wax crystals begin to adhere to the surface of the water droplets, forming wax crystals – water droplets aggregates. Correspondingly, the minimum edge distance and specific surface area (SA) exhibited a gradual decrease, indicating an enhanced level of aggregation. Since the water droplets are no longer independent individuals, but aggregates that adhere to wax crystals, the complexity of morphological structure increases, and the corresponding fractal dimension increases. Finally, at Stage III, as the temperature is lowered, the minimum edge distance and specific surface area (SA) exhibit their smallest values, while the fractal dimension reaches its maximum value, indicating a stronger degree of aggregation within the system. As the wax crystals continue to grow, more and more water droplets and wax crystals collide and adhere together, forming more and more wax crystals – water droplets aggregates, and overlapping with each other to create a complex flocculation structures consisting of wax crystals, water droplets aggregates, liquid hydrocarbon, which are the most complex and the slowest moving speed. By examining the impact of shear rate, it is observed that an intensified shear leads to the dispersion of wax crystals – water droplets aggregates with weak structures. From a parameter perspective, as shear increases, both minimum edge distance and specific surface area (SA) increase while fractal dimension decreases. These findings indicate that shear weakens aggregation within the system and reduces the complexity of flocculation structures.
The relationship between the spatial distribution, microstructure and motion behavior characteristic parameters of the water droplets and the temperature and shear rate are shown in Table 1. It can be seen from Table 1, under the combined influence of wax crystals and water droplets, the aggregation tendency and complexity of water droplets in the system exhibited a negative correlation with changes in temperature and shear rate; the richness of water droplets motion behavior demonstrated a positive correlation with changes in temperature and shear rate. As the temperature decreases, the minimum edge distance of water droplets decreases by a maximum of 32.1%, the specific surface area (SA) decreases by a maximum of 12.0%, and the fractal dimension increases by a maximum of 11.7%. As the shear rate increases, the minimum edge distance of water droplets increases by up to 27.9%, the specific surface area (SA) increases by up to 10.1%, and the fractal dimension decreases by up to 8.5%.
| 0.5 s−1 | ||||
|---|---|---|---|---|
| 40 °C | 32 °C | 24 °C | 16 °C | |
| Minimum edge distance (μm) | 41.298 | 36.773 | 33.843 | 30.008 |
| SA (μm−1) | 0.513 | 0.503 | 0.478 | 0.462 |
| Fractal dimension | 1.544 | 1.578 | 1.684 | 1.725 |
| 2 s−1 | ||||
| Minimum edge distance (μm) | 45.855 | 39.743 | 35.450 | 32.330 |
| SA (μm−1) | 0.540 | 0.531 | 0.500 | 0.478 |
| Fractal dimension | 1.540 | 1.559 | 1.590 | 1.628 |
| 5 s−1 | ||||
| Minimum edge distance (μm) | 52.445 | 47.016 | 38.978 | 35.625 |
| SA (μm−1) | 0.565 | 0.553 | 0.520 | 0.497 |
| Fractal dimension | 1.516 | 1.535 | 1.554 | 1.579 |
According to the above analysis, both temperature change and shearing effect affect the aggregation of water droplets and wax crystals. Specifically, temperature primarily affects the precipitation and growth of wax crystals, while shear forces impact the collision between water droplets and wax crystals. However, based on the observation of experimental results, it is evident that not all wax crystals and water droplets exhibit aggregation following collision, especially when the shear rate increases, some wax crystals – water droplets aggregates with weak structure will be broken up under shear action, and some colliding aggregates will also bounce off each other. Therefore, to further investigate the impact of shear on collision and subsequent aggregation phenomena, this study elucidates the collision and aggregation behavior of water droplets and their aggregates using population balance theory.
3.3 Methods for mathematical characterization of microscopic behavior of the water droplets
The aggregation of water droplets in the flow field can be divided into two steps. Firstly, water droplets get close to each other and collide under the action of adhesive force. Then, the water droplets overcome the fluid force in the flow field to complete the aggregation. The above two steps can be described by collision frequency and agglomeration efficiency respectively, and the degree of aggregation after collision can be characterized by the aggregation frequency. The specific formula is shown as follows:(1) Collision frequency:51,52
 | (3) |
(2) Agglomeration efficiency:
The agglomeration efficiency represents the proportion of water droplets that gather after a collision in the flow field.49,53 Currently, there are primarily two prevailing models in the existing literature for quantifying the agglomeration efficiency of particles subsequent to collision: linear model and curve model. Among them, the linear model does not consider the van der Waals attraction between particles and the shear force of the flow field on the particles, and the model thinks that the particles will definitely aggregate once they collide,54 therefore, the calculation is often greater than the actual value, and the accuracy is lacking. The curve model will comprehensively incorporate the van der Waals gravitational effect between particles and the shear effect of the flow field on particles, thereby yielding calculation results that are more representative of reality. In summary, the model proposed by Ven et al. was used to calculate the agglomeration efficiency among water droplets particles. The specific formulas are shown in eqn (4)–(6):
| α = Kε0.18 | (4) |
 | (5) |
 | (6) |
(3) Aggregation frequency:
The aggregation frequency is the product of the collision frequency and the agglomeration efficiency, an important indicator to characterize the degree of particles aggregation in the flow field.58 It holds immense importance to understand the microscopic dynamics exhibited by water droplets during the gelation process of emulsified waxy crude oil. The detailed equation can be found in eqn (7).
| Cf = α × Q | (7) |
(4) Water droplets aggregate coverage rate:
Water droplets aggregate coverage rate is the ratio of the number of aggregated water droplets to the number of all water droplets, which characterizes the stability of water droplets aggregates in the flow field.
 | (8) |
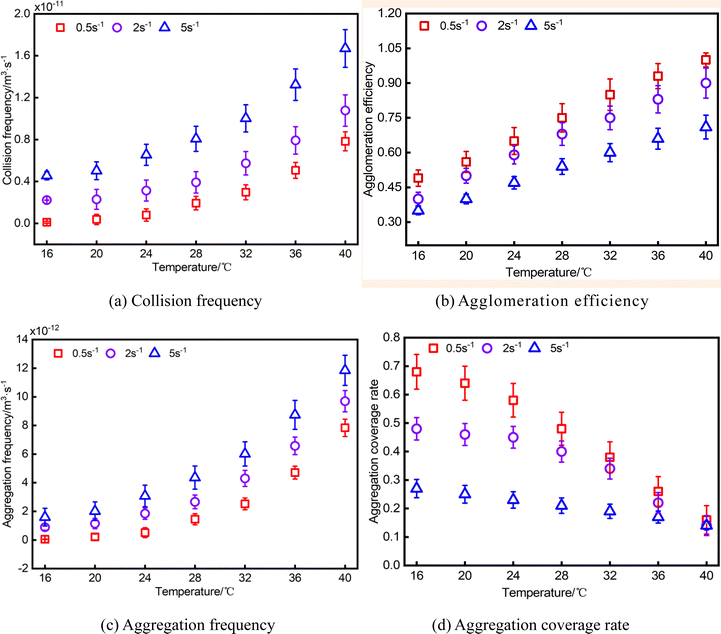
By utilizing the mathematical model presented above and incorporating experimental data from this study, it is possible to obtain variation curves depicting the dynamic parameters of water droplets in relation to temperature and shear rate, as depicted in the illustration provided in Fig. 6.
When the temperature ranges from 40 °C to 32 °C (Stage I), wax crystals in the system are less precipitated and exist in the form of monomer particles, and the distance between them is large, which has little effect on the motion of the water droplets, at this time, the water droplets collide more frequently, as a direct result, the water droplets at this stage have abundant collision and aggregation. However, at this stage, the aggregation is in an unstable state with only a minimal presence of wax crystals, colloids and asphaltenes on the water droplets' surface, resulting in insignificant adhesion between the water droplets. The water droplets aggregates rapidly separate under the influence of shearing forces, causing them to deviate from their original trajectory, and other water droplets around the collision, aggregation, this phenomenon becomes more pronounced as the shear effect intensifies. The increased kinetic energy resulting from enhanced shear effect reduces the likelihood of water droplets aggregation following collision. Due to the large collision base, although the agglomeration efficiency decreases, the aggregation frequency still shows an increasing trend. This unstable aggregation form makes the water droplets aggregation coverage rate lower at this stage, which is macroscopically reflected in the good fluidity of the system, that is, the apparent viscosity is low.
When the temperature is 32–24 °C (Stage II), at this time, wax crystals exist in the visual field in the form of aggregates and monomers, and there is a tendency to aggregate into water droplets, the motion hindrance between water droplets is enhanced, the collision frequency between the water droplets is reduced, and the agglomeration efficiency and frequency are also reduced. At this stage, as the shear rate increases, although the collision frequency between water droplets is enhanced to some extent, the shortened contact time between the water droplets due to the high flow rate leads to a gradual reduction in the agglomeration efficiency of the water droplets with increasing shear rate. At the same time, under the action of van der Waals force, wax crystals and water droplets form a certain structure of aggregates, wherein some wax crystals adhere to the water droplets, thereby enhancing their surface adhesion, consequently, compared to the previous stage, there is an improved coverage rate of water droplets at this stage. This observation suggests that post-collision water droplets exhibit reduced propensity for separation with decreasing temperature (increased viscosity), leading to the formation of a relatively stable aggregates. However, as the shear increases, the stable aggregates gradually become detached and there is a gradual decrease in water droplets aggregate coverage rate with increasing shear rate.
When the temperature is 24–16 °C (Stage III), the presence of wax crystals are observed as flocs and aggregates within the field of view. These wax crystals envelop the water droplets, leading to their overlapping and formation of a more compact three-dimensional structure, additionally, some liquid hydrocarbons are encapsulated within this structure. At this time, the water droplets are strongly hindered, under the action of shear force, the frequency of collision between water droplets is low, so that the agglomeration efficiency and frequency of water droplets at this stage change slowly as the temperature decreases. At this stage, as the shear rate rises, there are differences in the degree of damage to wax crystals and their flocculation structures, the space for water droplets to move is no longer restricted, the collision and aggregation behaviors between water droplets are further enhanced, as evidenced by the gradual increase in both collision frequency and aggregation frequency of water droplets. At this time, the fluidity of the system caused by wax crystals and their flocs decreases, which increases the friction in the flow field, it is difficult for the colliding water droplets to aggregate, so the agglomeration efficiency gradually decreases as the shear rate increases. However, the water droplets aggregates formed after the collision of water droplets in this stage exhibits enhanced stability. The coverage rate of water droplets aggregation gradually increases with decreasing temperature, to a certain extent, the adhesion between wax crystals and water droplets was enhanced. Nevertheless, this adhesion is disrupted under the influence of flow shear force, as evidenced by a gradual decrease in the coverage rate of water droplets aggregation with increasing shear rate. This alteration demonstrates a noteworthy association with the rheological characteristics of the system, as the temperature decreases, there is an increase in water droplets aggregate coverage rate, leading to a gradual deterioration of the macroscopic rheology of the system. Conversely, the rheological properties are improved when the water droplets aggregate coverage rate gradually decreased with increasing shear rate.
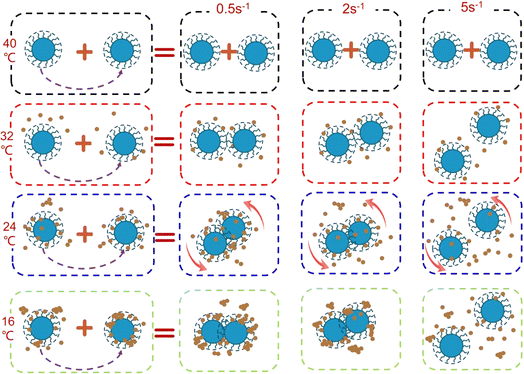
In order to more intuitively understand the collision and aggregation of water droplets in the shear flow field, the microscopic motion of water droplets at different stages is shown in Fig. 7.
The collision and aggregation of water droplets and their aggregates are primarily influenced by temperature and shear, as evident from the aforementioned results. Further analysis based on Fig. 6(a) reveals a quantifiable relationship between water droplets collision frequency Q and temperature as well as shear rate.
 | (9) |
The relationship between water droplets agglomeration efficiency α temperature and shear rate is obtained by fitting in Fig. 6(b).
 | (10) |
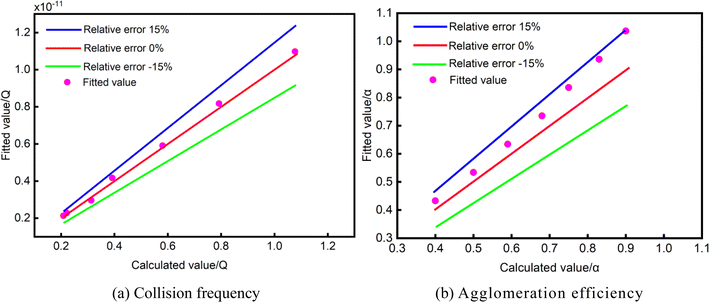
The accuracy of the formula is proven by conducting an error analysis comparing the outcomes derived from the fitting formula with the computed results, as illustrated in Fig. 8.
The pink circles in Fig. 8 are the fitting value of collision frequency and agglomeration efficiency calculated by applied eqn (9) and (10). As can be seen from the above figure, when the shear rate is 2 s−1, the deviation of the fitting and calculated values of the collision frequency and agglomeration efficiency of the water droplets during the cooling process is within 15%, indicating that the water droplets collision aggregation model can better predict the changes in the motion behavior of the water droplets in a shear flow field, consequently, it provides a solid foundation for further analysis of the microscopic behavior characteristics of water droplets.
4. Conclusions
The microstructural changes of water droplets aggregates and wax crystals under dynamic cooling conditions were observed using a rheo-microscopy in situ synchronous measurement in this study. Detailed analysis of the collision and aggregation behavior of water droplets under dynamic cooling conditions are conducted based on quantitative data. The conclusions are as follows:1. The evolution of water droplets aggregates microstructure in the shear flow field can be categorized into three stages based on the different forms of wax crystals. They are “Stage I—monomer wax crystals + water droplets, Stage II—wax crystals + water droplets aggregates, Stage III—wax crystals + water droplets aggregates + liquid hydrocarbon flocs”. However, the presence of wax crystals and flocs can impede the amplitude of water droplets motion and their degree of aggregation, thereby altering the spatial distribution, microstructure, motion behavior, and other microscopic characteristics within the system, consequently, these changes lead to difference in the overall rheological characteristics of the system.
2. Under the combined influence of wax crystals and water droplets, the aggregation tendency and complexity of water droplets in the system exhibited a negative correlation with changes in temperature and shear rate; the richness of water droplets motion behavior demonstrated a positive correlation with changes in temperature and shear rate.
3. Utilizing the population balance theory, we conducted calculations on the collision frequency, aggregation frequency, and agglomeration efficiency of water droplets under different temperatures and shear conditions. Through nonlinear surface fitting, water droplets collision model that accounts for temperature and shear rate was derived, a mathematical model was developed to accurately characterize the microscopic motion behavior of water droplets in a shear flow field, enabling precise prediction of their microscopic changes and analysis of their aggregation nature.
4. The stability and complexity of the structure of the water droplets and wax crystals + water droplets aggregates are evaluated by the aggregate coverage rate of the water droplets, the aggregate coverage rate of water droplets decreases with the increase of temperature and shear rate, which indicates that water droplets are not stable after collision. When the shear force exceeds the adhesive force between water droplet aggregates, the aggregated water droplets undergo detachment, leading to a discernible alteration in the aggregation coverage rate within the system. This alteration demonstrates a noteworthy association with the rheological characteristics of the system, as the temperature decreases, there is an increase in water droplets aggregate coverage rate, leading to a gradual deterioration of the macroscopic rheology of the system. Conversely, the rheological properties are improved when the water droplets aggregate coverage rate gradually decreased with increasing shear rate.
Conflicts of interest
There is no conflict of interest.Acknowledgements
This work is supported by the National Natural Science Foundation of China (Grant 52304065) and China Postdoctoral Science Foundation (Grant 2022MD723759).References
- Q. C. Zhang, X. Chou and M. Y. Li, Review of the first half of 2023 and outlook for the second half of the international crude oil market, Oil and Gas and New Energy, 2023, 35(04), 12–18 Search PubMed.
- L. Zhang, J. Chen and X. Cai, et al., Research on electrostatic coalescence of water-in-crude-oil emulsions under high frequency/high voltage AC electric field based on electro-rheological method, Colloids Surf., A, 2017, 520, 246–256 CrossRef CAS.
- L. P. Guo, X. Han and Y. Lei, et al., Study on the thixotropy and structural recovery characteristics of waxy crude oil emulsion, Pet. Sci., 2021, 18(4), 1195–1202 CrossRef CAS.
- M. T. Ghannam and N. Esmail, Yield stress behavior for crude oil–polymer emulsions, J. Pet. Sci. Eng., 2005, 47(3–4), 105–115 CrossRef CAS.
- M. T. Ghannam, M. Y. E. Selim and A. Y. Zekri, et al., Viscoelastic behavior of crude oil-gum emulsions in enhanced oil recovery, Polymers, 2022, 14(5), 1004 CrossRef CAS PubMed.
- E. Ghanaei, Newtonian and Non-Newtonian Viscosity of Waxy Crude Oils and Condensates: A Noncompositional Model, Ind. Eng. Chem. Res., 2022, 61(19), 6703–6721 CrossRef CAS.
- J. Wen, J. Zhang and M. Wei, Effective viscosity prediction of crude oil-water mixtures with high water fraction, J. Pet. Sci. Eng., 2016, 147, 760–770 CrossRef CAS.
- K. Oh and M. D. Deo, Yield behavior of gelled waxy oil in water-in-oil emulsion at temperatures below ice formation, Fuel, 2011, 90(6), 2113–2117 CrossRef CAS.
- S. Li, Q. Huang and M. He, et al., Effect of water fraction on rheological properties of waxy crude oil emulsions, J. Dispersion Sci. Technol., 2014, 35(8), 1114–1125 CrossRef CAS.
- A. Piroozian, M. Hemmati and I. Ismail, et al., Effect of emulsified water on the wax appearance temperature of water-in-waxy-crude-oil emulsions, Thermochim. Acta, 2016, 637, 132–142 CrossRef CAS.
- Y. M. Jiang and C. X. Li, Preparation of oil-water emulsions, Surface Engineering of Oil and Gasfields, 2000,(6), 21–22 Search PubMed.
- Q. Y. Huang, F. Zhang, J. J. Zhang, M. Wang and D. Q. Bai, Research on the preparation conditions of crude oil water emulsion, Oil and Gas Storage and Transportation, 2007,(6), 49–66 Search PubMed.
- S. Li, Q. Huang and D. Zhao, et al., Relation of heat and mass transfer in wax diffusion in an emulsion of water and waxy crude oil under static condition, Exp. Therm. Fluid Sci., 2018, 99, 1–12 CrossRef CAS.
- Z. Wang, Y. Bai and H. Zhang, et al., Investigation on gelation nucleation kinetics of waxy crude oil emulsions by their thermal behavior, J. Pet. Sci. Eng., 2019, 181(7), 106230, DOI:10.1016/j.petrol.2019.106230.
- M. C. K. De Oliveira, R. M. Carvalho and A. B. Carvalho, et al., Waxy crude oil emulsion gel: Impact on flow assurance, Energy Fuels, 2010, 24(4), 2287–2293 CrossRef CAS.
- D. W. Liu, B. W. Wang, Z. H. Mu, H. Zhang and C. X. Li, Study on the synergistic effect of crude oil gum and asphaltene at oil-water interface and its emulsion stability. Synergistic effect of crude oil colloids and asphaltenes at the oil-water interface and the stability of emulsions, Proceedings (Abstract) of the 17th National Conference on Colloidal and Interface Chemistry of the Chinese Chemical Society (Volume III), Chinese Chemical Society, 2019, vol. 2 Search PubMed.
- A. A. Moud, Asphaltene induced changes in rheological properties: A review, Fuel, 2022,(15), 316, DOI:10.1016/j.fuel.2022.123372.
- Q. Ma, Y. Liu and X. Lv, et al., In situ record of the dynamic process of wax deposition in water-in-oil emulsion: Evolution of two types of deposition structures, J. Pet. Sci. Eng., 2022, 214, 110560 CrossRef CAS.
- Y. Liu, B. Shi and L. Ding, et al., Investigation of hydrate agglomeration and plugging mechanism in low-wax-content water-in-oil emulsion systems, Energy Fuels, 2018, 32(9), 8986–9000 CrossRef CAS.
- L. Lanotte, J. Mauer and S. Mendez, et al., Red cells' dynamic morphologies govern blood shear thinning under microcirculatory flow conditions, Proc. Natl. Acad. Sci. U. S. A., 2016, 113(47), 13289–13294 CrossRef CAS PubMed.
- N. Xue, J. K. Nunes and H. A. Stone, Shear-induced migration of confined flexible fibers, Soft Matter, 2022, 18(3), 514–525 RSC.
- V. Prasad, S. P. Mehrotra and P. Thareja, Rheological characteristics of concentrated Indian coal ash slurries and flow through pipelines, Constr. Build. Mater., 2022, 361, 129624 CrossRef.
- C. Palla, J. de Vicente and M. E. Carrin, et al., Effects of cooling temperature profiles on the monoglycerides oleogel properties: A rheo-microscopy study, Food Res. Int., 2019, 125, 108613 CrossRef CAS PubMed.
- M. D. Aviles, V. D. Cao and C. Sanchez, et al., Effect of temperature on the rheological behavior of a new aqueous liquid crystal bio-lubricant, J. Mol. Liq., 2020, 301, 112406 CrossRef CAS.
- J. Du, J. Páez and P. Otero, et al., Rapid in situ quantification of rheo-optic evolution for cellulose spinning in ionic solvents, Carbohydr. Polym., 2023, 320, 121229 CrossRef CAS PubMed.
- L. J. Thursch, D. DiGuiseppi and T. R. Lewis, et al., Exploring the gel phase of cationic glycylalanylglycine in ethanol/water. I. Rheology and microscopy studies, J. Colloid Interface Sci., 2020, 564, 499–509 CrossRef CAS PubMed.
- V. Räntzsch, M. B. Özen and K. F. Ratzsch, et al., Polymer crystallization studied by hyphenated rheology techniques: Rheo-NMR, Rheo-SAXS, and Rheo-Microscopy, Macromol. Mater. Eng., 2019, 304(2), 1800586 CrossRef.
- S. Villa, P. Edera and M. Brizioli, et al., Quantitative rheo-microscopy of soft matter, Front. Phys., 2022, 905 Search PubMed.
- M. Keshtkar, M. C. Heuzey and P. J. Carreau, et al., Rheological properties and microstructural evolution of semi-flexible fiber suspensions under shear flow, J. Rheol., 2010, 54(2), 197–222 CrossRef CAS.
- A. A. Soedarmo, N. Daraboina and C. Sarica, Microscopic study of wax deposition: mass transfer boundary layer and deposit morphology, Energy Fuels, 2016, 30(4), 2674–2686 CrossRef CAS.
- A. Macierzanka and H. Szeląg, Microstructural behavior of water-in-oil emulsions stabilized by fatty acid esters of propylene glycol and zinc fatty acid salts, Colloids Surf., A, 2006, 281(1–3), 125–137 CrossRef CAS.
- J. Zhao, X. F. Li and H. Dong, et al., Rheo-optic in situ synchronous study on the gelation behaviour and mechanism of waxy crude oil emulsions, Pet. Sci., 2023, 20(2), 1266–1288 CrossRef CAS.
- J. Zhao, X. Xi and H. Dong, et al., Rheo-microscopy in situ synchronous measurement of shearing thinning behaviors of waxy crude oil, Fuel, 2022, 323, 124427 CrossRef CAS.
- J. Zhao, Z. Zhuo and H. Dong, et al., Structural failure process of gelled waxy crude oil emulsion based on rheological-in-situ microscopic synchronous measurement, Fuel, 2024, 364, 131070 CrossRef CAS.
- K. Fan, S. Li and R. Li, Micro-mechanism analysis of the rheological properties of water-in-waxy-crude-oil emulsion under pipe flow, J. Dispersion Sci. Technol., 2021, 43(1), 114–125 CrossRef.
- G. Sun, J. Zhang and H. Li, Structural behaviors of waxy crude oil emulsion gels, Energy Fuels, 2014, 28(6), 3718–3729 CrossRef CAS.
- A. A. Amooey and E. Omidbakhsh Amiri, Computational fluid dynamic simulation of dispersed oil-water flow with new drop coalescence model, J. Appl. Fluid Mech., 2019, 12(1), 119–126 CrossRef.
- Y. Wang, L. Qian and Z. Chen, et al., Coalescence of binary droplets in the transformer oil based on small amounts of polymer: effects of initial droplet diameter and collision parameter, Polymers, 2020, 12(9), 2054 CrossRef CAS PubMed.
- W. Liu, Z. Sun and N. Li, et al., Binary droplet interactions in shear water-in-oil emulsion: A molecular dynamics study, J. Mol. Liq., 2022, 363, 119823 CrossRef CAS.
- Z. Qi, Z. Sun and N. Li, et al., Effect of electric field intensity on electrophoretic migration and deformation of oil droplets in O/W emulsion under DC electric field: A molecular dynamics study, Chem. Eng. Sci., 2022, 262, 118034 CrossRef CAS.
- B. Li, M. Ju and X. Dou, et al., Microscopic mechanism for nanoparticle-laden droplet–droplet electrocoalescence: A molecular dynamics study, Sep. Purif. Technol., 2022, 299, 121768 CrossRef CAS.
- C. J. Meyer and D. A. Deglon, Particle collision modeling–a review, Miner. Eng., 2011, 24(8), 719–730 CrossRef CAS.
- K. S. Park and S. D. Heister, Modeling particle collision processes in high Reynolds number flow, J. Aerosol Sci., 2013, 66, 123–138 CrossRef CAS.
- W. Liu, N. Li and Z. Sun, et al., Droplet trajectories and collisions in gas forced vortexes: A molecular dynamics study, Chem. Eng. Sci., 2022, 248, 117242 CrossRef CAS.
- A. Dhar, R. L. Vekariya and P. Sharma, Kinetics and mechanistic study of n-alkane hydroisomerization reaction on Pt-doped γ-alumina catalyst, Petroleum, 2017, 3(4), 489–495 CrossRef.
- H. Dong, J. Zhao and L. Wei, et al., Effect of initial cooling temperature on structural behaviors of gelled waxy crude oil and microscopic mechanism investigation, Energy Fuels, 2020, 34(12), 15782–15801 CrossRef CAS.
- N. Lin, J. H. Mccoy and X. Cheng, et al., A multi-axis confocal rheoscope for studying shear flow of structured fluids, Rev. Sci. Instrum., 2014, 85(3), 033905 CrossRef PubMed.
- J. J. Zhang, Research and application of rheology and pipeline transportation technologies of high-pour-point and viscous crude oils: retrospect and prospect, Oil Gas Storage Transp., 2022, 41(6), 682–693 Search PubMed.
- G. C. Song, Study on the Characteristics of Hydrate Particle Aggregation and Membrane Growth Deposition in Pipeline, China University of Petroleum (East China), 2019, DOI:10.27644/d.cnki.gsydu.2019.001956.
- H. M. Bi, Study on the Relationship between Rheology and Microstructure of W/O Type Waxy Crude Oil Emulsions, Northeast Petroleum University, 2020, DOI:10.26995/d.cnki.gdqsc.2020.000144.
- X. M. Jiang, S. P. Dong and H. G. Zhang, et al., The collision model and experimental study of dispersed droplets in Newtonian liquid-liquid two-phase flow, Fluid Mach., 2007,(9), 5–8 Search PubMed.
- S. A. Patlazhan and J. T. Lindt, Kinetics of structure development in liquid–liquid dispersions under simple shear flow. Theory, J. Rheol., 1996, 40(6), 1095–1113 CrossRef CAS.
- X. Su, X. Yang and Y. Yu, et al., A simulation approach to predict electrostatic coalescence performance of water-in-oil emulsion using population balance model, Sep. Sci. Technol., 2023, 58(3), 538–550 CrossRef CAS.
- Z. L. Li, Flocculation Kinetics of Activated Sludge Based on Population Balance, Chongqing University, 2014 Search PubMed.
- T. G. M. Van de Ven and S. G. Mason, The microrheology of colloidal dispersions VII. Orthokinetic doublet formation of spheres, Colloid Polym. Sci., 1977, 255, 468–479 CrossRef CAS.
- X. Li and B. E. Logan, Collision frequencies between fractal aggregates and small particles in a turbulently sheared fluid, Environ. Sci. Technol., 1997, 31(4), 1237–1242 CrossRef CAS.
- G. C. Song, Y. X. Li, W. C. Wang, K. Jiang, Z. Z. Shi and S. P. Yao, Kinetic model of hydrate aggregation based on population balance theory, Chem. Prog., 2018, 37(1), 80–87, DOI:10.16085/j.issn.1000-6613.2017-0483.
- Y. Li, J. Zhao and H. Dong, et al., The role of shearing effect in the evolution of the microscopic behavior of wax crystals, New J. Chem., 2021, 45(23), 10418–10431 RSC.
Footnote |
| † Electronic supplementary information (ESI) available. See DOI: https://doi.org/10.1039/d4ra00951g |
| This journal is © The Royal Society of Chemistry 2024 |

