 Open Access Article
Creative Commons Attribution 3.0 Unported Licence
Part II: superconductivity observed in magnetically separated nanoscale anatase titania at ambient temperature and pressure in an aqueous environment at its point of zero charge
Miriam Leffler *,
Jared Fee,
Seth March,
Yang Wu and
Steven L. Suib
Department of Chemistry, University of Connecticut, USA. E-mail: Miriamleffler1066@gmail.com; jare.fee@uconn.edu; seth.march@uconn.edu; yang.wu@uconn.edu; steven.suib@uconn.edu
First published on 24th September 2024
Abstract
This is the first work to investigate if and/or how changes in the surface structure/properties affect the charge transfer resistance (RCT) of anatase titania with decreasing particle size. It was accomplished by measuring the RCT (Ω) of same weight anatase titania pellets, with particle sizes ranging from 5.31 nm to 142.61 nm. Measurements were made using Electrochemical Impedance Spectroscopy (EIS) at each material's point of zero charge (PZC). Results demonstrated two regions of RCT. Above an average primary particle diameter of 23.54 nm, RCT remained essentially constant. Below, this diameter the RCT value first increased significantly, then decreased almost linearly toward zero. The projected average primary particle diameter where the materials RCT was projected to reach zero resistance is at a diameter of approximately 4.39 nm. A simple test was then developed to determine if at a small enough particle size the material would be affected by an external magnetic field. It was found that a sample with an average particle diameter of 12.689 nm, formed fine needles/threads of particles in deionized water, perpendicular to the settled powder at the base of the potash tube. This led to the development of a simple magnetic separation method to obtain strongly diamagnetic material from a parent population with an average primary particle diameter of 5.31 nm. A pellet consisting of these magnetically separated particles was then pressed at the same weight and pressure as the prior samples. The pellet's RCT was then measured using EIS under the identical conditions as the prior samples. EIS results of the magnetically separated particles in pellet form, under multiple conditions, resulted in Nyquist plots indicating the material exhibited no detectable RCT (i.e., superconductivity). Correlation of the shift in the materials RCT with known structure/property changes for each sample with decreasing particle size allowed the development of a model explaining: (1) the significant increase in diamagnetic strength of the magnetically separated particles and (2) the mechanism controlling the material's RCT.
1 Introduction
1.1 Charge transfer resistance applications
Charge transfer resistance is a critical property used in multiple areas of chemistry. These include work on battery anodes,1–3 photosynthesis, medicine, synthesis, electronics4 and catalysis.5 RCT is also employed in determining losses in electronic component materials such as semi-conductors, capacitors, and diodes.6–8Due to the extensive use of anatase titania's electronic properties3,9–11 it has been widely studied. In addition, critical work has been done on the particle size effect on RCT3,12 of this material which provided a broad range of background knowledge. This made it possible to tailor the research into the effect of changes in the materials surface structure and properties due to the particle size effect on RCT.
1.2 Change in charge transfer resistance with decreasing particle size
Charge transfer resistance (RCT (Ω)) is defined as the opposition to the movement of an electron from either one atom or phase to a second atom or phase. As this resistance measurement also possesses a frequency component, it is typically referred to as impedance (active resistance). The factors affecting this value are the given amount of a specific material the current is passing through and the frequency of the current.1 Therefore, particle size differences in same size samples for the same phase should not affect the measured RCT, which was the finding in work by Ariyoshi, Tanimoto and Yamada.13 They demonstrated that significant changes in the particle size of lithium manganese oxide for same size samples exhibited little change in their RCT values from 5 μm to 9 μm.This though, was not the finding for work by Rai et al.12 on nanoscale anatase titania. They demonstrated that as the average primary particle diameter decreased into the nanoscale region, for same size samples, RCT decreased almost linearly. A plot of the materials average primary particle diameter against its RCT resulted in a linear curve. The fitted trendline gave a correlation value (R2) of 0.917 indicating the values were highly correlated and projected values of the fitted equation very reliable. The projected average primary particle diameter (d) for this curve, where the materials resistance would go to zero, was at d = 1.54 nm.
1.3 Effect of an electric field on the charge transfer resistance of titania
Salari et al.'s3 research on highly ordered titania nanotubes for use as supercapacitor electrodes demonstrated the effect of a voltage bias (i.e., electric field) across nanoscale titania material during charge transfer resistance measurements using EIS. The average primary particle diameter for the powder population used in their work was between 30–60 nm. Nyquist plots of both their nanotubes and powder, were run with a 0.1 V bias across the samples. Their results presented Nyquist plots indicating there was no apparent RCT (i.e., bulk electrical resistance). Based on the results by Rai et al.'s12 work, though there should have been a measurable resistance in the average primary particle size used by Salari et al.3The critical difference between these two works is that Salari et al.3 obtained the Nyquist plots with the samples under a 0.1 V bias, while Rai et al.'s12 samples were at a 0.0 V bias. Research by Rincón et al.14 on the effect of an electric field on carbon–hydrogen bonds, such as those generated by a voltage bias, determined that it lengthened the distance between the anions and cations. This creates the same effect of lengthening surface bonds with decreasing particle size, found to occur below an average diameter of approximately 28 nm in anatase titania.15
Based on the above information, one significant structural difference between the materials in the micron and nanoscale ranges is apparent, surface bond lengths. In the micron region, above an average diameter of ∼28 nm, surface bond lengths of anatase titania do not change. Whereas below this particle size bond lengths increase with decreasing particle size.15 In addition to an increase in surface bond lengths with decreasing particle size in the nanoscale region changes in other structure/properties were identified by Leffler et al.16 in anatase titania below a diameter of ≅29 nm. These include changes in the surface structure, a shift toward lower point of zero charge values, increasing bond ionic content and an increasing percent of the global surface area being positively charged. Correlation with the decrease in RCT and changes observed by Leffler et al.,16 suggests that alterations in the surface structure/properties may be an integral part of the mechanism which controls this property.
1.4 Magnetic separation
A different dry magnetic separation method has also been used to segregate superconducting powders in a magnetic field by making use of the Meissner Effect.17 The parent powder population is cooled to below the materials transition temperature (TC) so that it is in superconducting mode. In the cooling chamber, the parent powder population sits above a strong magnet, which creates a vertical magnetic field in which the particles levitate. The more superconducting the particles, the higher they levitate in the magnetic field. Those particles which levitate at the greatest height are the most effective superconducting material and are harvested.
1.5 Objectives
Therefore, the objectives of this work were to:(1) Determine the RCT for same weight pellets with decreasing average primary particle diameters using EIS at each material's PZC. This would allow a possible projected average primary particle diameter where the material's RCT = 0.0 Ω.
(2) Determine if a dry and/or wet magnetic separation method could be developed to concentrate anatase titania powder exhibiting either extremely strong and/or super diamagnetic characteristics from its parent population.
(3) Having obtained enough magnetically separated powder, a same weight pellet would then be pressed under the same pressure as the prior samples. The RCT would then be measured using EIS at the materials PZC.
(4) Correlate the changes in the powder populations RCT with the known surface structural and property changes with decreasing particle diameter to determine the possible underlying cause responsible for changes in the materials RCT (i.e., bulk electrical resistance).
Note: EIS was chosen for specific reasons.
(1) The samples would be measured under identical conditions as each material's PZC value was obtained.16
(2) This would allow a direct correlation between the changes between each powder population's surface properties and structure.16
2 Experimental
2.1 Pellet preparation
Identical amounts of anatase titania powders were measured on a Mettler scale (∼295 mg). The powder was pressed, in a 1.4 cm die, using a Brucker Powder Press at 5000 pounds per square inch (psi). After pressing each pellet was then weighed. The average weight of all seven pellets was ∼291 mg. Each pellets dimensions possessed similar diameters (∼1.4 cm) and thickness (∼1.33 mm).2.2 Charge transfer resistance measurements using EIS on same weight pellets
A Gamry Interface 1010™ Potentiostat/Galvanostat/ZRA Model 600 was used to obtain Nyquist plots for each of the seven pellets. Nyquist plots were run using Gamry Instruments Echem Analyst Software in a 3-electrode cell with a PFTE cover (Teflon). This consisted of a working electrode with a PTFE coated Pt clip, a counter electrode (Pt wire), and a reference electrode (Standard Calomel Electrode (SCE)). A SevesCompact pH/ion meter was used to monitor pH values in the 3-electrode cell. The experimental set-up is presented in Fig. 1.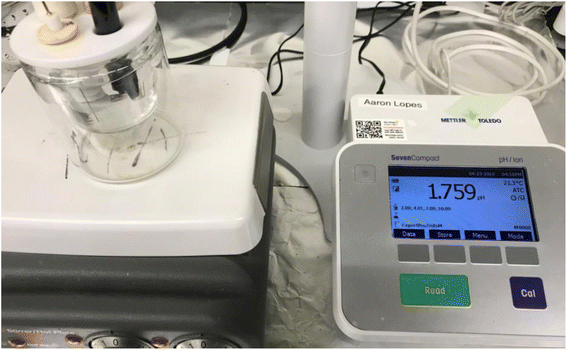 | ||
| Fig. 1 The electrical cell, clamped pellet, and pH/ion meter set-up for the EIS system used to obtain a Nyquist plot. | ||
Each pellet was clamped into the PTFE coated Pt clip attached to the working electrode for the run. The electrolyte pH was then adjusted to each pellet's PZC value using a 1 M or 5 M HCl or NaOH solution. The following settings and conditions were used during each run to obtain a Nyquist plot:
* DC voltage: open circuit potential (OCV)
* AC voltage: 5 mV
* Electrolyte: 0.01 M KCl
* Measured at the point of zero charge pH for each pellet: (obtained using 1 M or 5 M HCl or NaOH solution)
* Frequency range: 100![[thin space (1/6-em)]](https://www.rsc.org/images/entities/char_2009.gif) 000 to 0.1 Hz
000 to 0.1 Hz
* OCV current: 0.35 A
2.3 Development of magnetic separation method for anatase titania
The presence of particles in both 0.01 N HCl solution and deionized water suggested a second factor responsible for the particles remaining in solution. To determine if the presence of ambient light during settling was responsible for the particles remaining in solution a metal cup was used to cover the tube on day 53. This excluded all the ambient light from reaching the tube allowing a test of this possibility. The total run time for this experiment was 77 days.
The concentrated particles were then transferred from the centrifuge tube using the Gilson 200 μL pipettor to place small drops of the concentrated sample in DI water onto a clean glass microscope slide. Then the loaded slide was placed on the warming plate (T = 50 °C), with the top of a glass Petri dish covering it to minimize contamination from the atmosphere. Once the drops had dried, the powder was scraped off the microscope slide using the flat end of a spatulate into a glass sample jar for collection. The entire process of collecting ∼325 mg of magnetically separated anatase titania took approximately 2 years.
3 Results
3.1 Changes in charge transfer resistance with decreasing particle size
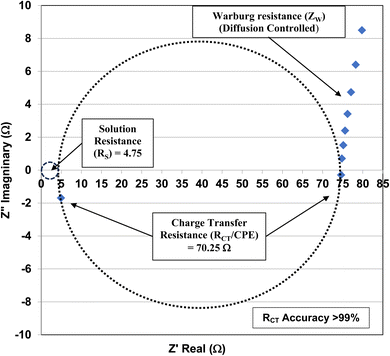 | ||
| Fig. 2 The Nyquist plot for the anatase titania pellet with an average primary particle diameter of 5.31 nm at its pHPZC = 1.75. | ||
The element in a circuit diagram typically used in parallel with a negative RCT is a constant phase element (CPE) which accounts for the negative (RCT/CPE).19–23 The Warburg Impedance (ZW = ¼σWω−1) (Ω), where σW = Warburg coefficient is identified by the straight line at 45°. It evaluates the species mass diffusion transfer from the bulk to the metal surface. This physical phenomenon depends on the speed with which a metal ion can be transferred from the surface to the bulk solution and how fast an electron acceptor can be transferred from the bulk structure to the metal surface to consume electrons.24–27 Since the Warburg portion of the curve presents a positive set of values (+Z′′) in a separate frequency range than the RCT/CPE element this indicated it was a separate component in the equivalent circuit diagram presented in Fig. 3.28,29
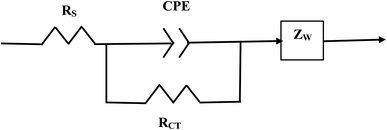 | ||
| Fig. 3 The equivalent circuit for the Nyquist Plot/system in Fig. 2. | ||
Charge Transfer Resistance (RCT) values for each powder were obtained from Nyquist plots like the one found in Fig. 3. Each sample was measured at its point of zero charge [Table 1]. Error values were determined for the pHPZC, and charge transfer values using each manufacturers equipment error specifications. For the Hanna Instrument (HI) pH meter/oxygen reduction potential (ORP) 2214 meter (ref. 30) is pH ± 0.4 °C−1. Temperature variation at each system's equilibrium temperature was pH ± 0.1 °C, giving an error of ± 0.04 pH for each titration run. Based on the documentation for the Gamry Instruments 600 Potentiostat/Galvanostat/ZRA25,31,32 error for the measured resistance was less than 1%. The values for each measured charge transfer resistance are presented in Table 1 and were calculated assuming a 0.9% error. Error values for the average primary particle diameter were calculated from results obtained by Leffler et al.16
| Average particle diameter variation/error (nm) | Point of zero charge (pH) | Charge transfer resistancec (Ω) | Vendor information |
|---|---|---|---|
| a U.S. Nanomaterial Research.b Spring Sky Nanomaterials.c This work. | |||
| 5.3069 ± 0.0237 | 1.75 ± 0.04 | 70 ± 0.63 | US3838a |
| 12.689 ± 0.1819 | 2.48 ± 0.04 | 199 ± 1.791 | US3490a |
| 16.131 ± 0.534 | 3.04 ± 0.04 | 284.5 ± 2.561 | US3492a |
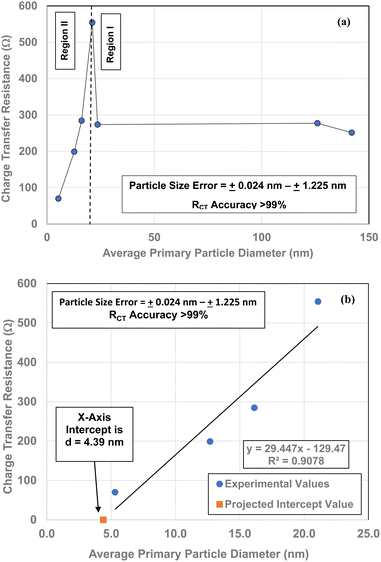
| 21.108 ± 1.225 | 4.25 ± 0.04 | 554 ± 4.989 | US3493a |
| 23.5379 ± 0.656 | 5.47 ± 0.04 | 273.7 ± 2.463 | 7910DLb |
| 126.002 ± 0.760 | 7.15 ± 0.04 | 277.3 ± 2.496 | US3411a |
| 142.614 ± 1.064 | 7.19 ± 0.04 | 251.4 ± 2.263 | US1152a |
Each of the measured powders RCT/CPE were then plotted against their average primary particle diameter in Table 1 [Fig. 4(a)]. Above a diameter of 23.54 nm, the charge transfer resistance remains essentially constant. There is then a significant increase in the resistance at d = 21.108 nm. Below d = 21.108 the RCT/CPE decreases almost linearly. Like the work by Salari et al.3 the projected average particle diameter in Fig. 4(b), where RCT/CPE goes to zero, has diameter of ∼4.39 nm. The results in Fig. 4(a) also suggest a surface structural change is responsible for the decrease in the materials RCT/CPE, not their average primary particle diameter since RCT/CPE remains constant as particle diameters increase from 23.54 nm to 142.614 nm. If this is the case, then it might be possible to obtain particles that present no RCT/CPE.
3.2 Test for dry magnetic separation
A thin layer of powder (d = 12.69 nm) was placed on the Grade N48 magnet and examined for any movement or change in shape due to the magnetic field. There was no apparent effect of the magnetic field on the powder. Therefore, it was determined that a dry separation method was not feasible, possibly because of the high surface charge and particle agglomeration of both the strong and weak diamagnetic particles which might have been preventing movement.3.3 Initial results indicating an effect of a magnetic field on anatase titania in deionized water
It was found that when the anatase titania powder (d = 12.689 nm) in DI water was placed on the Grade N48 magnet, small thread/needle like shapes composed of particles formed. They were perpendicular to the base of the potash tube and remained during the time the tube sat on the magnet. When the tube was removed from the magnet, the threads/needles slowly fell over into the powder at the base of the tube and broke apart. This procedure was repeated multiple times, with the same result.3.4 Magnetic settling in 0.01 N HCl
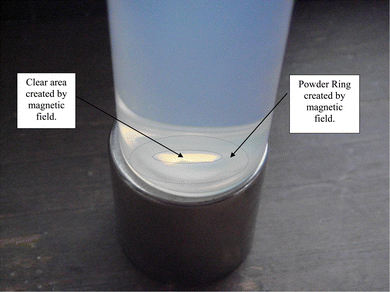
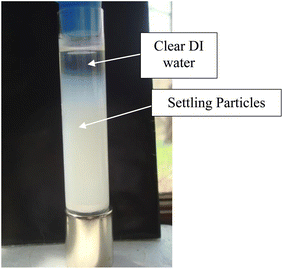
Magnetically separated particles in 0.01 N HCl exposed to ambient light [Appendix A.1] were found to partially settle. At the base of the Potash A tube on day 30 a powder ring was present indicating that a portion of the powder population had been forced out of the strongest region of the vertical magnetic field during settling [Fig. 15]. The powder remaining in solution at the end of the run, on day 43, was evenly dispersed in the 0.01 N HCl [Fig. 16]. The particles showed no evidence of the magnetic field affecting as to how they were distributed in solution. This suggested that a second variable was responsible for the dispersed particles remaining in solution [Fig. 16].At the base of the Potash tube, before the solution was removed [Fig. 17], concentric powder circles were present. Between these circles and at the center of the smallest circle no powder was present. This indicated the patten in which the particles had been rejected from the magnetic field during settling. The clear regions demonstrated that particles dispersed in 0.01 N HCl were sufficiently diamagnetic to be affected by the Grade N48 magnetic field. After the removal and evaporation of the solution [Fig. 18] only one concentric powder circle remained.
3.5 Settling of anatase titania in deionized water with No magnetic field present
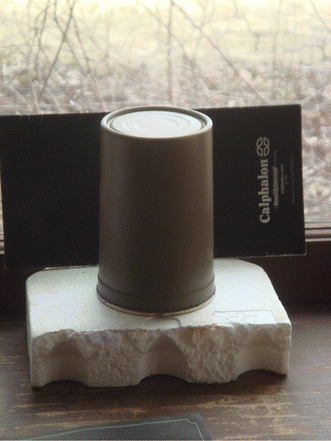
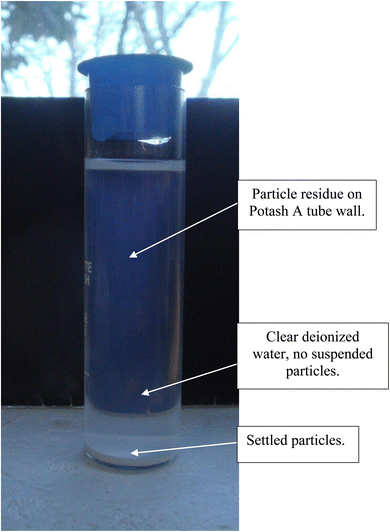
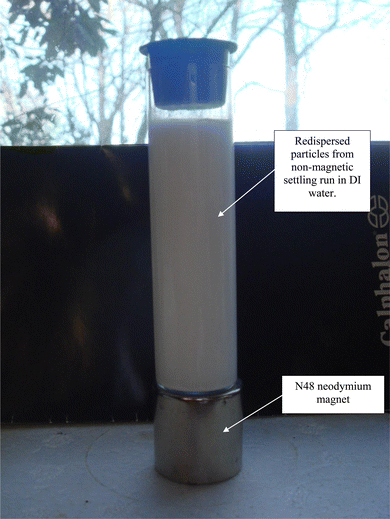
After 21 days of settling without the presence of a magnetic field, most of the fully dispersed particles [Appendix A.2, Fig. 19 and 20] were observed to have settled to the base of the Potash A tube. A small fraction of these particles though was evenly distributed in the DI water, when examined on days 26, 36 and 46. The density of these suspended particles in the solution remained constant until the end of the run at day 46. Based on the length of time the material had to settle, it became evident that these dispersed particles were permanently suspended in the DI water. As anatase titania is photoelectric, it was hypothesized that the surface charge, produced by exposure to ambient light, might be responsible for the continued suspension in the solution.To test this hypothesis, a metal can was placed over the Potash A tube [Fig. 21] and then checked 10 days later. At this time the water was significantly clearer, due to the settling of a large percentage of the suspended particles. At the end of the run, with the metal can in place (day 41) the DI water was found to be completely clear [Fig. 22]. The only remaining particles not settled were found as a residue on the side of the Potash A tube. The entire experiment, without and with a metal cup excluding ambient light, extended over 87 days [Fig. 23].
3.6 Magnetic separation in deionized water with all ambient light excluded
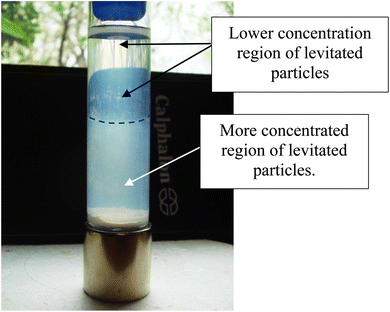
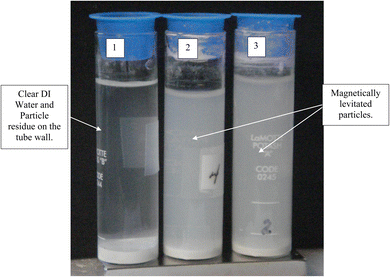
Magnetic separation in deionized water with ambient light excluded made it possible to obtain only particles susceptible to the magnetic field. Appendix A.3 demonstrates the separation process over the 15 days period which was determined to be required for a full separation. An interesting note, Fig. 24 demonstrates a region of clear DI water at the top of the tube on day 4, which had filled in with particles by day 8 Fig. 25. This is further evidence that the more strongly diamagnetic particles were pushed upward into this region, and sitting higher in the magnetic field, than those below them. This mimics what was seen for superconducting powders under dry conditions in a cooling chamber.17 Fig. 26 demonstrates that particles susceptible to levitation are most concentrated in the strongest region of the magnetic field.A series of runs on the same powder population were executed. This was accomplished by removing the magnetically levitated particles at the end of each run using the 200 μL Gilson pipettor. The settled particles were redispersed by recapping and agitating the tube. The tube was then set back on the magnet and covered by the cylindrical cardboard box to exclude all ambient light. The last run was determined [Fig. 27] when the fully dispersed particles had settled out of the DI water leaving it clear. This typically took approximately an hour. Any remaining particles were located at either the bottom of the tube or as residue on its walls. The particles remaining as residue also indicated that their surfaces likely possessed a high static charge. This is interesting, as there was no available light to engage electron production at the surface through the photoelectric effect.
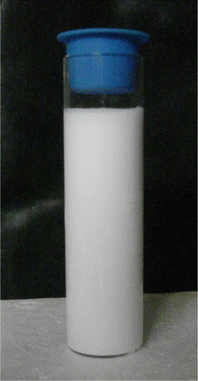
An examination of the parent population, from which the magnetically separated powder was obtained, revealed a significant difference in their color [Fig. 5(a) and (b)] when dried. The parent population remained bright white, indicating it had a larger bandgap than the magnetically separated powder which exhibited a vibrant sky-blue color.33 Since band gap is directly related to the material's bond length34 this indicates that the magnetically separated particles have longer global bond lengths than the parent particle population. Therefore, this difference in colors between the two samples confirmed that a magnetic separation had occurred.16,35
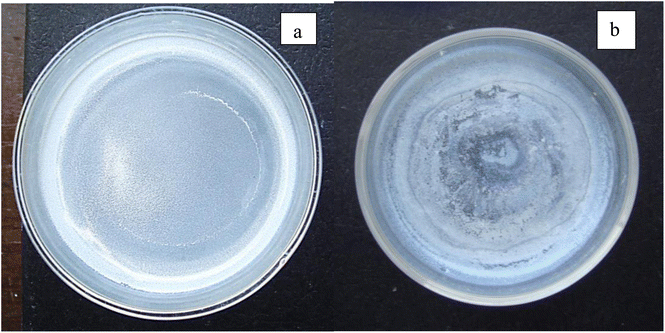 | ||
| Fig. 5 (a) After drying the parent population remained a bright white. (b) The magnetically separated powder after drying was sky blue. | ||
3.7 Effect of no ambient light or magnetic field present on the magnetically separated anatase titania particles
The magnetically separated particles, in the same DI water segregation occurred, were placed under the metal can excluding all ambient light with no magnetic field present. This resulted in the particles agglomerating and settling to the base of the potash tube. These agglomerated magnetically separated particles, in DI water, were then placed back onto the Grade N48 magnet used to levitate them. It was found that they were now unaffected by the magnetic field. It was also noted that that there was either little or no DI water in the interstitial regions between these interior particles of the agglomerated particles. This points to the importance of the presence of water fully surrounding each particle to effect magnetic levitation.When the agglomerated particles were re-exposed to ambient light with no magnetic field present, the particles slowly broke away from the agglomerate and returned to solution. The process of deagglomeration took approximately two months. This suggests that the photoelectric property of the material may play a critical role in allowing anatase titania to remain suspended in solution indefinitely outside a magnetic field [Fig. 6].
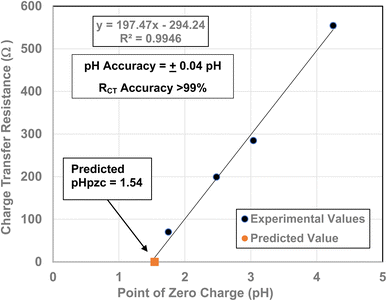 | ||
| Fig. 6 Projected point of zero charge for the material at which zero electrical resistance might occur. | ||
3.8 Charge transfer resistance values for magnetically separated anatase titania particles
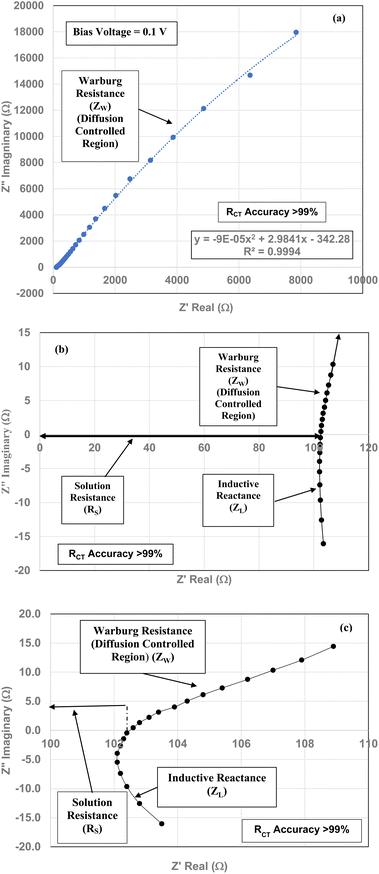
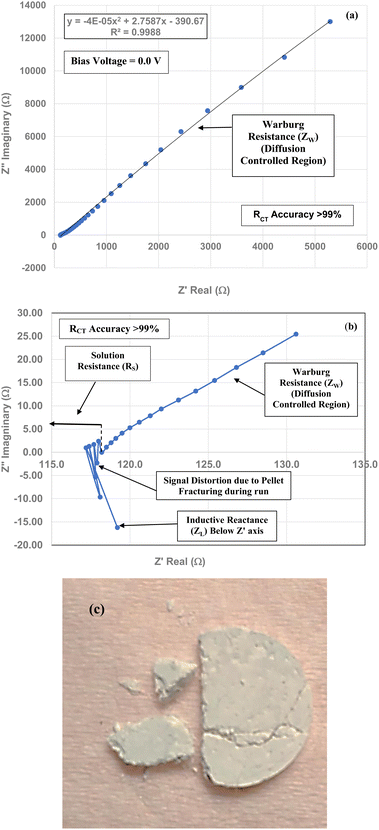
To obtain the projected pHPZC value for the magnetically separated particles, a plot of the particle sizes from 5.31 nm to 23.54 nm against their pHPZC values [Table 1] was made. A regression curve was then fitted to the plotted values. Using the equation of the fitted regression curve, a pHPZC = 1.54 was calculated at a value of RCT = 0.0 Ω [Fig. 7]. The correlation value for the fitted curve was R2 = 0.9946, indicating that the projected pHPZC value at RCT = 0.0 Ω was highly reliable.Three EIS runs were performed to obtain charge transfer results [Nyquist plots]. The first run [Fig. 7(a)–(c)] was for the magnetically separated particle pellet under 0.1 V bias. A second run was performed at 0.0 V bias [Fig. 8(a) and (b)]. In Fig. 8(b) there is signal distortion due to fracturing of the pellet [Fig. 8(c)] during the run. After completing these two runs, a third run was performed at a 0.0 V bias, where no sample was present in the Pt clip [Fig. 9(a) and (b)]. This run was executed so that the curves with and without a sample present could be compared.
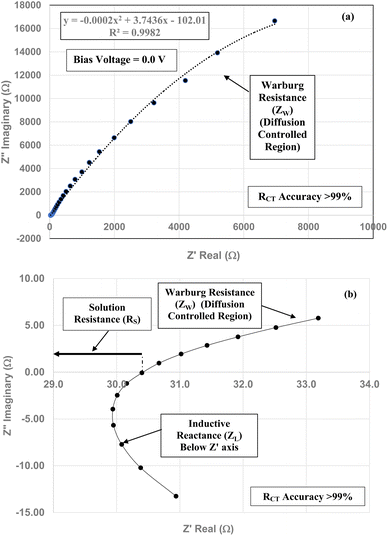 | ||
| Fig. 9 (a) The Nyquist plot of the unloaded Teflon coated Pt clip/electrode possesses the same characteristic curve as Fig. 7(a)–(c) and 8(a) and (b) over the identical frequency range. (b) Displays solution resistance (RS) and the sum of the values for the Warburg resistance above the Z′ axis and the induction portion of the curve below the Z′ axis. | ||
Above the Z′ axis the curve is at 45°, indicative of Warburg impedance.36–38 There are no semi-circles indicating RCT/CPE are not present as it was in Fig. 2. Therefore, this pellet exhibits no RCT/CPE (i.e., bulk electrical resistance/impedance). The equivalent circuit for these three runs, Fig. 7(a)–(c), 8(a), (b) and 9(a) and (b), is presented in Fig. 10.
 | ||
| Fig. 10 The equivalent circuit of the curves in Fig. 7(a)–(c) through Fig. 9(a) and (b). Solution resistance (RS) is measured from the origin to where the highest frequency point is recorded intercepting the real axis (Z′). Beyond RS on the Z′ axis are the summed values of ZL and ZW across the same frequency range. | ||
A Nyquist plot where a sample was not present (i.e. an unloaded system) was made by Lin et al.39 The plot they obtained is identical in configuration to those in Fig. 7(a)–(c) through Fig. 9(a) and (b). This further supports the analysis of these three sets of figures that the sample under test demonstrated no RCT/CPE (i.e. bulk electrical resistance) [Fig. 10].
3.9 Determination of average primary particle diameter for magnetically separated anatase titania
Multiple TEM micrographs were taken of the magnetically separated particles [Fig. 11]. Using the method developed by Leffler et al.,16 both the spherical and equivalent spherical diameters were measured by hand from the TEM micrographs. It was possible to clearly identify 68 values, where magnetically separated particle diameters ranged from 1.739 nm to 4.56 nm. This gave an average primary particle diameter of 3.30 ± 0.50 nm. This value is 1.09 nm smaller than the average diameter predicted in Fig. 4(b) (d = 4.39 nm), but still within the full range of particle sizes identified.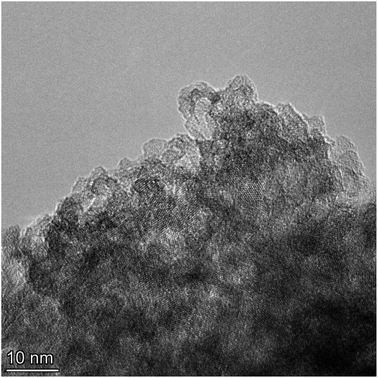 | ||
| Fig. 11 A TEM micrograph of magnetically separated particles from the parent population with an average primary diameter of 3.30 nm. | ||
In addition, the difference between the average primary particle diameter for the parent population was d = 5.31 nm. The magnetically separated average primary particle was d = 3.30 nm, ∼2 nm smaller than the parent population. This, in conjunction with the different color of the powder (i.e. sky-blue) also confirms that a separation occurred between the magnetically susceptible and non-magnetically susceptible particles.
3.10 Correlation of RCT/CPE and point of zero charge
To determine if a relationship exists between the materials point of zero charge and their RCT/CPE, these two values were plotted against one another. This was possible as all the materials measured came from the same powder populations.16 Therefore, their average primary particle diameters are identical allowing for a direct correlation between the two properties. The plot [Fig. 12] demonstrates that there is a simple linear relationship between these two values from pHPZC = 4.25 down to pHPZC = 1.54. Above a pHPZC = 4.25 the charge transfer resistance decreases to an average value of 267.5 Ω. Beyond a pHPZC = 5.47, RCT/CPE values remain constant. These results indicate a direct correlation between these two properties and suggests that the underlying changes in surface structure/properties are responsible for changes in PZC and RCT values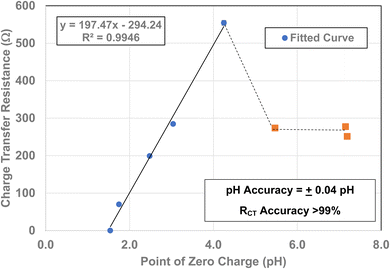 | ||
| Fig. 12 A plot of each powder population's point of zero charge16 against its RCT/CPE. The fitted curve extends from pHPZC values 1.54 to 4.25. | ||
3.11 Correlation of RCT/CPE and band gap
Leffler et al.16 demonstrated that the band gap for all seven powder populations correlates directly with the change in the materials point of zero charge. Therefore, to determine if this relationship holds for the RCT/CPE and band gap values from 5.31 nm to 23.54 nm against their average primary particle diameters were plotted alongside each other. Based on both curves there is a strong visual correlation between the two variables [Fig. 13(a)].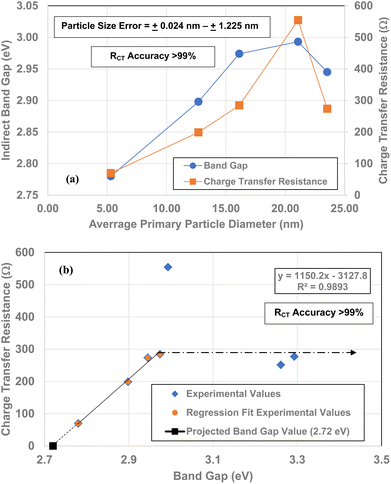 | ||
| Fig. 13 (a) Bandgap16 and RCT/CPE values plotted against their average primary particle diameter. (b) Bandgap values16 plotted against their RCT/CPE. The projected band gap value of 2.72 eV is for RCT/CPE = 0.0 Ω. | ||
When the band gap values are plotted against their RCT/CPE [Fig. 13(b)], there is a highly correlated (R2 = 0.9893) linear relationship between them from particle sizes d = 5.31 nm to 16.31 nm and d = 23.54. The particle diameter where there is an anomalous increase RCT/CPE is at d = 21.08 nm (ρ = 554.3). This is most likely the average primary particle size where the surface structure is transforming to the bond lengths and atomic positions where the RCT/CPE (d = 23.54–142.02 nm) remains constant.
3.12 Correlation of RCT/CPE with a/b and c lattice parameters
There is a direct linear correlation between each material's RCT/CPE and its band gap [Fig. 14 (a) and (b)]. As band gap is a measure of the changes in the global surface bond lengths a set of plots for the a/b and c lattice parameters16 alongside the RCT/CPE were made. As all but one data point is for the same average primary particle diameters, the plot is a direct correlation between these two values [Fig. 14(a) and (b)].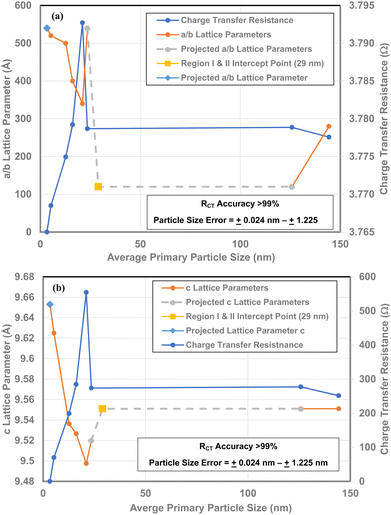 | ||
| Fig. 14 (a) Direct comparison of the RCT/CPE and a/b lattice parameters16 for all the sample populations measured. (b) A direct comparison of the RCT/CPE and the c lattice parameters16 for all the samples measured. | ||
The value at d = 29 nm is the intercept point for Regions I and II.16 For values with particle sizes greater than d = 29 nm, are in Region I where neither the measured properties nor the surface structure changes. This makes it possible to extrapolate from this data point to a measured value (d = 125.85 nm) in Region I. In Region II, each of the RCT curves very closely parallel the plots for a/b and c lattice parameters, allowing the extrapolation from the value at d = 23.54 nm to the intercept point at d = 29 nm.
It is evident from Fig. 14(a) and (b) that below a particle diameter of d = 21.08 nm both the a/b and c lattice parameters are expanding. This indicates that that as the RCT/CPE decreases below a diameter of 21.08 nm, the Ti and oxygen atoms are moving away from each other. Therefore, in conjunction with findings by Leffler et al.16 it indicates that the surface is shifting towards the internal bulk structure bond lengths and atomic positions of each crystallite.40
4 Discussion
From the results in Section 3.2 it is evident dry magnetic separation, which has been used on high temperature superconducting powders,17 does not work on the anatase titania particles. This process uses dry high temperature superconducting powders, levitating them above a magnet in a cold chamber below the materials transition temperature (TC). Whereas the method developed for anatase titania magnetic separation requires an aqueous environment [Sections 3.3 through 3.6], at ambient temperature and pressure. This pointed to a different mechanism responsible for the magnetic separation. Once the bulk of the water from around the particles was removed due to agglomeration [Section 3.7] they would not levitate. Therefore, it became evident that each of the magnetically separated particles required water to completely cover its surface.Anatase titania is weakly diamagnetic, therefore all the particles surface orbitals (i.e., currents) are paired, but were unable to affect levitation of the agglomerated material. In addition, at ambient temperature and pressure only single electrons were present in the conduction band of this material. This is evident from the EIS method used to measure RCT/CPE for each of the samples in Fig. 2, 4(a) and (b). All the samples were measured on the same EIS system [Section 2.2] at ambient temperature and pressure, under identical conditions, save PZC.
Both low and high temperature superconductors41–43 and the magnetically separated anatase titania particles [Fig. 7(a)–(b), 8(a) and (b)] conduct electricity without resistance. Yet only the first set, the low and high temperature superconductors possess Cooper pairs. Cooper pairs form just below their TC at which the material enters the superconducting state.44,45 They have either a 1 or 0 spin,46 indicating they are perfectly diamagnetic.47 Yet the surface currents (i.e., orbitals) at the anatase titania's agglomerated particle surfaces were unable to levitate the material. Therefore, this also suggests that in the low and high temperature super conductors surface currents may not be sufficient to produce the Meissner Effect (i.e., magnetic levitation).
Unpaired electrons are present, in low and high superconductors, in their conduction band, above the materials TC.48 When placed in a magnetic field, above the materials TC, the field lines pass completely through these superconductors.49 Below the transition temperature though, Cooper pairs form,44 and the magnetic field is completely excluded from the superconducting material.49,50 This suggests that the formation of Cooper Pairs may be the critical factor in fully expelling the magnetic field lines in low and high super conductors. They may act in the same manner as fully filled orbitals (i.e., diamagnetic) at the surface but also located throughout the superconductor's entire structure within its conduction band network.51 Their presence and position throughout the structure might be why the magnetic field is expelled from both the surface and interior of the superconducting material.
The first part of the mechanism leading to the magnetic separation of the anatase titania particles may be due to electric dipole–dipole interaction between the DI water and the anatase titania particles. Water has a very strong electric dipole moment (p) due to its bent structure.52 While micron sized particles of TiO2 have a weak electric dipole moment of 6.33 Deby.53 For nanoparticles of TiO2 with an average diameter d ∼3.0 nm though, Yan et al.54 demonstrated a dramatic increase in their electric dipole. They determined the particles had a time-averaged electric dipole moment fluctuating between 40 to 80 Deby at 273 K, significantly greater than the macroscopic particles.54 To illustrate how strong this electric dipole for the nanoparticles of TiO2 is, CsI is considerably above the average electric dipole moment at 11.69 Deby.55,56
This significant increase in the electric dipole moment for TiO2, with decreasing particle size, would then dramatically increase the interaction between the particles and water molecules. Also, as this is an aqueous environment water might also easily orient itself to arrange a three-dimensional network of molecules and particles of alternating charge, akin to a very dilute solution gelation structure.57 This might also explain why a small fraction of particles remained in solution, even without the presence of a magnetic field when exposed to ambient light [Section 3.4]. Since the agglomerated particles returned to solution as individual particles when re-exposed to ambient light, this suggests the material's photoelectric property may also play a part in the electric dipole–dipole interaction with water molecules.
The proximity of water molecules and anatase titania particles might then have facilitated the second part of the possible mechanism, the formation of a global magnetic dipole (μB) moment through magnetic dipole–dipole coupling (i.e., addition).58 This magnetic dipole–dipole interaction is present in magnets, where the sum of the magnetic dipoles in each domain are responsible for the strength of its global magnetic field.59 In the magnetic separation method developed, it appears to require the presence of magnetic dipole moments from multiple sources, not only the surface orbitals (i.e., surface currents) of the superconducting material. This is again underscored by the fact that the agglomerated particles would not levitate in the magnetic field by themselves, as water surrounding all the particles was missing. It might also explain why the dry powder separation method did not work. There was no water magnetic dipole to interact with both the oxygen and titanium atoms.
While a diamagnetic material, such as water, has no magnetic dipole moment outside of a magnetic field,60 it does develop one when placed in a magnetic field.61 Anatase titania is also a diamagnetic material, indicating it would have no magnetic dipole moment. But Mombru et al.62 demonstrated that the individual atoms within the structure do possess significant magnetic dipole moments. They determined that the atoms with the strongest magnetic dipole moments (μB) are the Ti atoms, for all structures of titania, when they are of the size of quantum dots with a diameter at ∼5 nm. Their μB = 4.0 individually. Values for the oxygen atoms possess a lower range of values, from μB = 0.02 to μB = 0.98.
Surface structural changes may also have contributed to a change in the particle's global magnetic dipole moment. Leffler et al.16 demonstrated that as the primary particle size of anatase titania particles above an average primary particle diameter of ∼29 nm, oxygen atoms sit above the Ti atoms. In addition, the electrons transferred to the oxygen atoms bow back, shielding the Ti atoms and possibly their surface orbitals, situated below them. This may have resulted in the cancellation of the Ti atoms magnetic dipole moments63 nearest the surface. If so, this would have reduced the overall strength of the surface magnetic dipole–dipole interactions (i.e., addition).
With decreasing primary particle size, the Ti atoms would have moved upward to the same level as the oxygen16 on the magnetically separated particles surface. In addition, the electrons shielding the Ti might have completely retracted back to surround only the oxygen. This may have resulted in their Ti atoms magnetic dipole moments no longer being cancelled by the shielding oxygen orbitals which had been situated above them. The unshielded Ti magnetic dipole moment62 at the surface might then have coupled with both those of the oxygen and water magnetic dipole moments when placed in a magnetic field. This coupling of all the individual magnetic dipole moments might then have formed a global magnetic moment strong enough to levitate the individual particles allowing for the magnetic separation to occur.
Fig. 7(a)–(c) through Fig. 9(a) and (b) demonstrate that there are no semicircles present, indicating RCT/CPE was not detected in either the magnetically separated anatase titania particles or the Pt electrode. Only solution resistance (RS), inductive reactance (ZL) and Warburg reactance (ZW) (diffusion-controlled resistance) are present in each of these Nyquist plots. The realistic minimum impedance limit measurable for a Gamry system is 10−6 Ω.64 Platinum has an electrical resistance of 10.6 × 10⁻⁸ Ω m (ref. 65) which is below the minimum detection limit of the Gamry EIS system used making it unlikely it was a component of the RS measured. Therefore, if the magnetically separated particles have any electrical resistance (i.e. RCT/CPE), they too are most likely below the detection limit of the EIS system [Section 2.2] employed.
EIS has been used successfully to characterize the high temperature superconducting system YBa2Cu3O7−δ/RbAg4I5. Two Nyquist plots for this material were recorded below its transition temperature (TC = 92 K), and one above it. Each of the Nyquist plots exhibited semi-circles, indicating that a charge transfer resistance (i.e., bulk electrical resistance) was present. Below the materials TC the average RCT are between 180 × 10−6 Ω cm2 to 190 × 10−6 Ω cm2. Above the TC the RCT increased to approximately 140 Ω cm2.43 Their work suggests that had RCT/CPE been present within the equipment's range of sensitivity66 the EIS used would have measured it in the magnetically separated particle pellet and Pt electrode.
From Fig. 12, it is evident that there is a direct linear relationship between the material's point of zero charge and RCT/CPE from pHPZC = 4.25 down to pHPZC = 1.54. This demonstrates that the surface structural/property transformation mechanism responsible for the shift in PZC values16 is also the underlying mechanism responsible for the decrease in the materials RCT/CPE at/and below an average primary diameter of 21. 08 nm [Fig. 4(a)].
Fig. 13(a) demonstrates a direct visual correlation between the indirect bandgap values and RCT/CPE from the average primary particle diameter of 5.31 nm to 23.54 nm. A plot of each material's band gap values against their RCT/CPE is presented in Fig. 13(b). The plot reveals a charge transfer resistance anomaly in the sample with a diameter 21.08 nm. The fitted line consists of particle diameters from 5.31 nm to 16.13 nm and 23.54 nm. At a diameter of 21.08 nm the charge transfer resistance increases dramatically by almost 270 Ω (ρ = 554.3 Ω), even though the bandgap value increased by only 0.019 eV. Then little more than an increase of 2.49 nm in the diameter of the next larger particle size (d = 23.54 nm), the materials RCT/CPE drops to 274 Ω and remains essentially constant up to the largest particle diameter of 142.02 nm. This suggests that at d = 21.08 nm the surface is in the process of shifting to the surface structure found at, and above d = 23.54 nm.16
The expansion of the a/b and c lattice parameters [Fig. 14(a) and (b)] below an average diameter of 21.08 nm indicates surface atoms are moving away from each other. While at the same time the metal atoms are moving upward toward the surface.16 This suggests that the controlling mechanism for RCT/CPE is linked directly to changes in the materials surface structure, not the bulk. The particles with diameters at and above 23.54 nm also support this contention, as their charge transfer resistance [Fig. 4(a), 12, 13(b), 14(a) and (b)] remains essentially constant.
For electrons to move from one particle to another, as occurs in Fig. 7(a)–(c) and 8(a) and (b), the conduction band must possess an opening at the surface. Above a diameter of 29 nm16 the oxygen atoms are situated above the level of the Ti atoms at the surface and are drawn up and over them.67 The electrons (i.e., orbitals) transferred from the Ti atoms to the oxygen bow back toward the Ti atoms partially shielding them.16 These shielding orbitals may also lie across the conduction band opening at the surface.
These shielding orbitals might also act as a potential energy barrier to electrons emerging at the surface from the conduction band. As all electrons possess a spin, they create a magnetic moment. The shielding orbitals above the Ti atom and the electrons leaving the conduction band at the surface, might then interact in the manner of two magnets of like poles. This would probably be present at all the particle surfaces for each pellet measured.
Leffler et al.'s16 work suggests that as the average primary particle diameter decreases toward d = 3.30 nm, the shielding electrons retract back until they are only present around the oxygen atoms. This might have resulted in the potential energy barrier completely disappearing from the path of the electrons emerging from the opening of the conduction band at the particles surface. If so, this mechanism would also have occurred on the surface of all the adjacent particles throughout the pellet. That would make it a simple matter for the electrons exiting the conduction band at the surface of each particle to move easily to the next opening of the closest conduction band opening on an adjacent particle surface.
The last factor which might have affected the materials RCT/CPE was a possible electro-static interaction between the potential energy barrier and a single electrons electrical charge. This might not be a factor if the potential energy barrier is not present due to the orbitals having retracted around the oxygen atom. But if some of the barrier is present, measurement at a material's point of zero charge would result in the particle's net surface charge being neutralized, possibly eliminating this interaction. This might also have reduced some of the resistance for each of the powder samples measured as well. It might also explain why the RCT/CPE measured for the magnetically separated sample was below the detection limit of the EIS system used.
There is a discrepancy between the low and high temperature superconductors, and the magnetically separated particles. Several high temperature superconductors exhibited very low, but measurable RCT/CPE (Nyquist plots),41,43 while the magnetically separated anatase titania particles did not. Appendix A.4 discusses this discrepancy and the possible insights it might afford into the BCS model.
5 Conclusions
A series of EIS measurements for anatase titania same weight pellets with decreasing average primary particle sizes were measured. Plots of their RCT/CPE values projected a particle size of 4.39 nm where this value might go to zero. To obtain this material a magnetic separation method was developed.EIS measurements were then conducted on the magnetically separated material at the same weight pellet form, in an electrolyte at the material's projected point of zero charge. These tests were performed on the pellets at bias voltages of 0.1 V and 0.0 V. The Nyquist plots for both bias conditions determined that only three types of reactance (i.e., active resistance) were present. These were, solution resistance inductive reactance, most likely caused by the Pt electrode and Warburg resistance (electrolyte diffusion-controlled region). For the unloaded run Warburg resistance most likely occurred at the Pt electrode's surface. No semi-circles were observed in any of the runs where the pellet was in the circuit, indicating that RCT/CPE (i.e., bulk structure electrical resistance) was not present in the magnetically separated particles under test, indicating the material was superconducting.
6 Future work
The one drawback of the separation method developed for this work is the removal of the particles from the aqueous environment. This process requires multiple steps to obtain dry powders. A possible method for future work was developed by Yang et al.68 They used a low power laser to create convection currents in an aqueous solution. The nanotubes then impacted and adhered to a small bubble in the aqueous solution, in the same manner used in flotation methods to obtain, concentrate, and extract valuable ores and coal from the parent population.18The advantages the method developed by Yang et al.68 is that it can be used as a bench top system to determine the ideal conditions under which the anatase titania and/or other magnetically separated materials can be harvested using full scale flotation methods. Since anatase titania possesses a positive surface charge,16 and air bubbles typically have a negatively charged surface,69 attachment and flotation are favored. An added advantage is that this method would also reduce and/or eliminate any possible contamination that the method used in this work may have caused.
Data availability
All data is available on requestConflicts of interest
All sources of funding have been declared and there are no conflict of interest in this manuscript.A Appendices
A.1 Magnetic separation of anatase titania particles exposed to ambient light in 0.01 N HCl
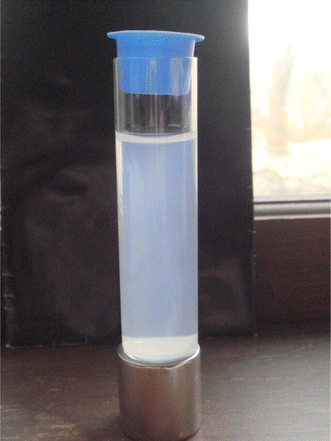 | ||
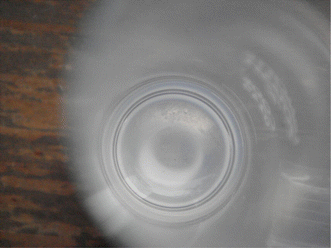
| Fig. 16 The final magnetic separation of anatase titania in 0.01 N HCl exposed to ambient light. The levitated particles are fully dispersed in the solution on day 43. | ||
A.2 Settling of anatase titania particles in “Potash A” tube without the presence of a magnetic field
 | ||
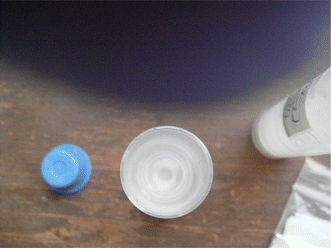
| Fig. 19 Disbursed anatase titania in deionized water for particle settling while not in the presence of a magnetic field. | ||
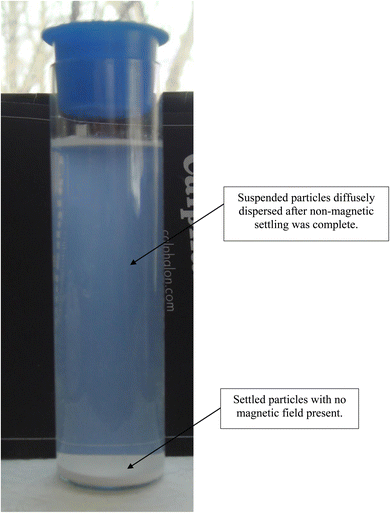 | ||
| Fig. 20 Anatase titania in deionized water while not in a magnetic field during settling while exposed to ambient light at 36 days. | ||
A.3 Magnetic separation of particles in deionized water with ambient light excluded
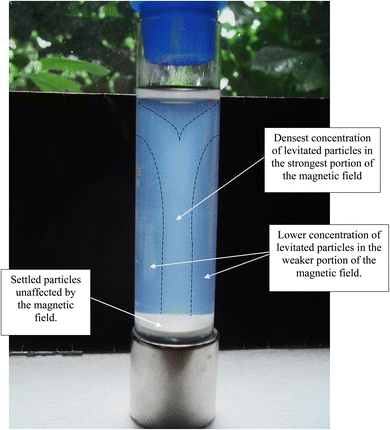 | ||
| Fig. 26 Magnetically separated anatase titania without ambient light at the end of the run, on day 15. | ||
A.4 Possible insights into the BCS theory
The findings in this work may offer possible insights into the BCS model70 for low and high temperature superconductors. These include the possible presence of a potential energy barrier at the exit/entrance of each conduction band at each particle's surface. The second is the possible way Cooper pairs interact with this barrier.There is a strong possibility of a potential energy barrier at the surface of low and high temperature superconducting materials conduction band opening for particles above a critical particle size. In this work the critical average primary particle diameter was found to be d = 3.30 nm. This would create two interactions for an emerging Cooper pair. The first is a magnetic dipole–dipole interaction created by electron spin in the surface orbitals comprising the potential energy barrier. The second is an electrostatic interaction at the potential energy barrier, as would occur for two negatively charged electrons repelling each other.
The presence of Cooper pairs in low and high temperature superconductors would eliminate the magnetic dipole–dipole interactions. These paired electrons have spins of either 1 or 0 indicating they are perfectly matched46 making them perfectly diamagnetic.47 Electrons at 180° to each other cancel out each other's magnetic dipoles.71,72 Therefore, they would most likely not have interacted with the surface orbital magnetic dipole moments within the potential energy barrier created by the materials surface structure.
The second feature, electrostatic interaction of the Cooper pairs and the potential energy barrier may explain why high temperature superconductors exhibit a very small electrical resistance,41–43 even after the onset of superconductivity. If this electrostatic interaction does occur and is responsible for the very low electrical resistance below its TC it suggests that the interaction is not a major factor in the overall electrical bulk resistance of the material. If these two interactions with a potential energy barrier do occur, then the magnetic dipole–dipole interaction is most likely responsible for most of the electrical bulk resistance in the low and high temperature superconductors above their TC.
Acknowledgements
ML wishes to thank Roy Le Clerq, Scientist at Eurofins Materials Science at the EAG Laboratories in Eindhoven, the Netherlands for his band gap measurement work, and Professor John Morris of Manchester Community College, Manchester CT for his generous contribution of lab equipment for experimental work. SLS and AM thank the National Science Foundation CBET Division under grant 1803343 for partial support of this research.References
- Corrosionpedia, https://www.corrosionpedia.com/definition/6315/charge-transfer-resistance-rct. 2024.
- L. Stolz, M. Winter and J. Kasnatscheew, Practical relevance of charge transfer resistance at the Li metal electrode/electrolyte interface in batteries?, J. Solid State Electrochem., 2023, 1–6, DOI:10.1007/s10008-023-05792-4.
- M. Salari, S. H. Aboutalebe, K. K. Konstantinov and H. K. Liu, A highly ordered titania nanotube array as a super capacitor electrode, Phys. Chem. Chem. Phys., 2011, 13, 5038–5041 RSC.
- J. B. Derr, J. Tamayo, J. A. Clark, M. Morales, M. F. Mayther, E. M. Espinoza, K. Rybicka-Jasinska and V. I. Vullev, Multifaceted aspects of charge transfer, Phys. Chem. Chem. Phys., 2020, 22(38), 21583–21629 RSC.
- L. R. Baker, Charge Transfer and Catalysis at the Metal–Support Interface, PhD thesis, University of California, Berkeley, 2012 Search PubMed.
- A. Fakharuddin, I. Ahmed, Z. Khalidin, M. M. Yusoff and R. Jose, Charge transport through split photoelectrodes in dye-sensitized solar cells, J. Appl. Phys., 2014, 115, 164509 CrossRef.
- A. Allison and H. A. Andreas, Minimizing the Nyquist-plot semi-circle of pseudocapacitive manganese oxides through modification of the oxide-substrate interface resistance, J. Power Sources, 2019, 426, 93–96 CrossRef CAS.
- K. R. Chauhan and I. Mukhopadhyay, On the electrical and interface properties of nanostructured CdTe Schottky diodes electrodeposited from an ionic medium, J. Appl. Phys., 2014, 115, 224506 CrossRef.
- V. Seiß, S. Thiel and M. Eichenlbaum, Preparation and Real World Applications of Titania CompositMaterials for Photocatalytic Surface, Air, and Water Purification:State of the Art, 2022 State of the Art, Inorganics, 2022, 10, 139–182 CrossRef.
- R. Gomez, T. Lopez, E. Ortiz-Islas, J. Navarrete, E. Sanchez, F. Tzompanztzi and X. Bokhimim, Effect of Sulfation on the photoactivity of TiO2 sol-gel derived catalysts, J. Mol. Catal. A: Chem., 2003, 193, 217–226 CrossRef CAS.
- U. Yogeswaran and S. M. Chen, A Review on the Electrochemical Sensors and Biosensors Composed of Nanowires as Sensing Material, Sensors, 2008, 8, 290–313 CrossRef CAS.
- A. K. Rai, L. T. Anh, J. Gim, V. Mathew, J. Kang, B. J. Paul, J. Song and J. Kim, Simple synthesis and particle size effects on TiO2 nanoparticle anodes for rechargeable lithium-ion batteries, Electrochim. Acta, 2013, 90, 112–118 CrossRef CAS.
- K. Ariyoshi, M. Tanimoto and Y. Yamada, Impact of particle size of lithium manganese oxide on charge transfer resistance and contact resistance evaluated by electrochemical impedance analysis, Electrochim. Acta, 2020, 364, 137292 CrossRef.
- L. Rincón, J. R. Mora, F. J. Torres and R. Almeida, On the activation σ-bonds by electric fields: A Valence Bond perspective, Chem. Phys., 2016, 477, 1–7 Search PubMed.
- H. Lin, C. P. Huang, W. Li, C. Ni, S. Ismat Shah and Y. H. Tseng, Size dependency of nanocrystalline TiO2 on its optical property and photocatalytic reactivity exemplified by 2-chlorophenol, Appl. Catal., B, 2006, 68, 1–11 Search PubMed.
- M. Leffler, A. Mirich, J. Fee, S. March and S. L. Suib, (), Part I: A Study of the Underlying Factor(s) Effecting Change in the Point of Zero Change of Anatase Titania, Results Mater., 2024, X1–X20 Search PubMed.
- I. G. Talmy, A. Martin and K. P. Scharnhorst, Method for the Selecting Superconducting Powders, US Pat., 5,047,387, 1991 Search PubMed.
- Principles of Mineral Processing, ed. M. C. Fuerstenau and K. M. Han, Society for Mining, Metallurgy and Exploration, Inc., Littleton, Colorado, USA, 2003 Search PubMed.
- S. Gupta, In a Nyquist Equivalent Circuit what Does it Mean to Have a Negative Resistance, Kautilya Institute of Technology and Engineering and School of Management, 2023, https://www.researchgate.net/post/ Search PubMed.
- S. V. Gnedenkov, S. L. Sinebruukhov, V. V. Zheleznov, D. P. Opra, E. I. Voit, E. B. Modin, A. A. Sokolov, A. Y. Ustinov and V. I. Sergienko, Effect of Hf-doping on electrochemical performance of anatase TiO2 as an anode material for lithium storage, R. Soc. Open Sci., 2018, 5, 171811 Search PubMed.
- L. A. Dobrzanski, M. M. Szindler, M. Szindler, K. Lukaszkowicz, A. Drygala, M. Prokopiuk and M. Prokopiuk vel Prokopowicz, Nanocrystalline TiO2 Powder Prepared by SOL-GEL Method For Dye-Sensitized Solar Cells, Arch. Metall. Mater., 2016, 61(2), 833–836 Search PubMed.
- E. Locorotondo, L. Pugi, L. Berzi and M. Pierini, Modeling and Simulation of Constant Phase Element for Battery Electrochemical Impedance Spectroscopy, IEEE 5th International forum on Research and Technology for Society and Industry (RTSI), 2019, pp. 225–230 Search PubMed.
- S. Holm, T. Holm and O. G. Martinsen, Simple circuit equivalents for the constant phase element, PLoS One, 2021, 16(3), 1–12 Search PubMed.
- A. Bonnel and F. Dabosi, Corrosion Study of a Carbon Steel in Neutral Chloride Solutions by Impedance Techniques, J. Electrochem. Soc., 1983, 753–763 CrossRef.
- Gamry, Basics of Electrochemical Impedance Spectroscopy, 2024, Retrieved from https://www.gamry.com/application-notes/EIS/basics-of-electrochemical-impedance-spectroscopy/ Search PubMed.
- T. Hong, Y. H. Sun and W. P. Jepson, Study on Corrosion Inhibitor in Larger Pipeline under Multiphase Flow using EIS, Corros. Sci., 2002, 101–112 CrossRef.
- Z. Yougui, K. F. Khaled and S. S. Abdel-Rehim, Electrochemical investigation of corrosion and corrosion inhibition of iron in hydrochloric acid solutions, Arab. J. Chem., 2011, 4, 397–402 CrossRef.
- K. F. Khaled and S. S. Abdel-Rehim, Electrochemical investigation of corrosion and corrosion inhibition of iron in hydrochloric acid solutions, Arab. J. Chem., 2011, 4, 397–402 CrossRef CAS.
- R. Attias, B. Dlugatch, M. S. Chae, Y. Goffer and D. Aurbach, Changes in the interfacial charge-transfer resistance of Mg metal electrodes, measured by dynamic electrochemical impedance spectroscopy, Electrochem. Commun., 2021, 124, 106952 CrossRef CAS.
- Hanna Instrument (HI) 2214, Instruction Manual, 2016, https://www.hannainst.
- Gamry Instruments, EIS of Difficult Samples, 2024, https://www.gamry.com/.
- D. J. Signore, Basics of Electrochemical Impedance Spectroscopy, Gamry Instruments, 2005 Search PubMed.
- M. Leffler, J. Fee, S. March, Y. Wu and Steven L. Suib, Introduction to Inorganic Chemistry, LibreTexts, Wikibook, Penn State University, 2023 Search PubMed.
- A. Miglio, C. P. Heinrich, W. Temel, G. Hautier and W. G. Zeier, Local Bonding Influence on the Band Edge and Band Gap Formation in Quaternary Chalcopyrites, Advanced Science, 2017, 4(9), 1700080 CrossRef PubMed , https://www.advancedscience.com..
- E. Fritsch and G. R. Rossman, An Update on color in Gems. Part 3: Colors Caused by Band Gaps and Physical Phenomena, Gems & Gemology, Summer, 1988, 81–102 Search PubMed.
- H. S. Magar, R. Y. A. Hassan and A. Mulchandani, Electrochemical Impedance Spectroscopy (EIS): Principles, Construction, and Biosensing Applications, Sensors, 2021, 21, 6578–6599 CrossRef CAS PubMed.
- N. O. Laschuk, E. B. Easton and O. V. Zenkina, Reducing the resistance for the use of electrochemical impedance spectroscopy analysis in materials chemistry, RSC Adv., 2021, 11, 27925–27936 RSC.
- A. R. C. Bredar, A. L. Chown, A. R. Burton and B. H. Farnum, Electrochemical Impedance Spectroscopy of metal Oxide Electrodes for Energy Applications, ACS Appl. Energy Mater., 2020, 3(1), 66–98 CrossRef.
- Y. D. Lin, S. I. Zida, C. C. Yang and Y. L. Khung, VEGF Detection via Impedance Spectroscopy on Surface Functionalized Interdigitated Biosensor, J. Funct. Biomater., 2023, 14, 365–379 CrossRef PubMed.
- C. Q. Sun, L. Li, B. K. Tay and H. Huang, An extended ‘quantum confinement’ theory: Surface-coordination imperfection modifies the entire band structure of a nanosolid, J. Phys. D: Appl. Phys., 2001, 34, 3470 CrossRef.
- C. Safranski, Resistance of the Superconducting Material YBCO, Senior Project, Department of Physics, California Polytechnic State University, San Luis Obispo, California, 2010 Search PubMed.
- N. Banno, Low-temperature superconductors: Nb3Sn, Nb3Al, and NbTi, Superconductivity, 2023, 6, 100047 CrossRef.
- A. Pinkowski, K. Juttner and W. J. Lorenz, Low-Temperature EIS measurements on high TC superconductor/solid electrolyte interfaces, J. Electroanal. Chem., 1990, 287, 203–213 CrossRef.
- E. Hudson, MIT Physics Annual, 2008 Search PubMed.
- L. N. Cooper, Bound Electron Pairs in a Degenerate Fermi Gas, Phys. Rev., 1956, 194(4), 1189–1190 CrossRef.
- R. Wengenmayr, Superconductivity Is Pair Work, Physics & Astronomy Superconductivity, Max Planck Research, Institute of Solid-State Research, 2011, pp. 49–55 Search PubMed.
- L. Li, Y. Wang, S. Komiya, S. Ono, Y. Ando, G. D. Gu and N. P. Ong, Diamagnetism and Cooper pairing above TC in cuprates, Phys. Rev. B: Condens. Matter Mater. Phys., 2010, 81, 054510 CrossRef.
- F. W. Sears, M. W. Zemansky and H. D. Young, University Physics, Addison-Wesley Publishing Company, Reading, Massachusetts * Menlo Park, California * London * Amsterdam * Don Mills, Ontario * Sydney, 5th edn, 1980 Search PubMed.
- C. Kittel, Introduction to Solid State Physics, John Wiley & Sons, Inc., New York, Chichester, Brisbane, Toronto, Singapore, 7th edn, 1996 Search PubMed.
- Britannica, The Editors of Encyclopedia. Meissner effect, Encyclopedia Britannica, https://www.britannica.com/science/Meissner-effect, 14 Aug. 2023 Search PubMed.
- J. Berashevich, O. Semeniuk, J. A. Rowlands and A. Reznik, Anisotropy of Carrier effective masses in bulk α-PbO, Europhys. Lett., 2012, 99, 47005 CrossRef.
- N. M. Putintsev and D. N. Putintsev, Electric Dipole Moment of the Water Molecule and Effective Charges, 19th IEEE International Conference on Dielectric Liquids (ICDL), Manchester, United Kingdom, 2017, pp. 25–29 Search PubMed.
- P. Kania, M. Hermanns, S. Brunken, H. S. P. Muller and T. F. Giesen, Millimeter-wave spectroscopy of titanium dioxide, TiO2, J. Mol. Spectrosc., 2011, 268, 173 CrossRef.
- W. Yan, S. Li, Y. Zhang and Y. Qiang, Effects of Dipole Moment and Temperature on the Interaction Dynamics of Titania Nanoparticles during Agglomeration, J. Phys. Chem. C, 2010, 114, 10755–10760 CrossRef.
- X. Liu, G. Meijer and J. Perez-Rios, A data-driven approach to determine dipole moments of diatomic molecules, Phys. Chem. Chem. Phys., 2020, 22, 24191–24200 RSC.
- T. Story Jr and A. J. Hebert, Dipole moments of KI, RbBr, CsBr, and CsI by the electric deflection method, Chem. Phys., 1976, 64, 855–858 Search PubMed.
- M. Bischoff, Y. Kim Na, J. B. Joo and A. Marchioro, Water Orientation at Anatase TiO2 Nanoparticle Interface: A Probe of surface pKa Values, J. Phys. Chem. Lett., 2022, 13, 8677–8683 CrossRef PubMed.
- M. Obata, M. Christivana and T. Oda, Investigation of magnetic dipole-dipole interaction using magnetic density on solid oxygen based on first-principles approach, AIP Adv., 2018, 8, 10419 CrossRef.
- K&J Magnetics, in All About Magnetization Direction, 2023, pp. 1–8, https://www.kjmagnetics.com/blog.asp?p=magnetization-direction Search PubMed.
- G. Franchetti, F. Zimmerman and M. A. Rehman, Trapping of neural molecules by beam electromagnetic field, Phys. Rev. Accel. Beams, 2021, 24, 054001 CrossRef.
- M. Kohno, T. Kamachi and K. Fukui, Intermolecular binding between bulk water and dissolved gases in earth's magnetic field, PLoS One, 2022, 17(5), 1–12 CrossRef PubMed.
- D. Mombru, M. Romero, R. Faccio, M. A. Tumelero and A. W. Mombru, Extremely Large Magnetic-Field-Effects on the Impedance Response of TiO2 Quantum Dots, Sci. Rep., 2019, 9(5322), 1–11 Search PubMed , https://www.nature.com/srep/.
- J. E. Hirsch, Spin Meissner effect in superconductors and the origin of the Meissner effect, Europhys. Lett., 2008, 81, 67003 CrossRef.
- Application Note, Low Impedance EIS at Its Limits Gamry Reference 30k Booster, Gamry Instruments, 2024, https://www.gamry.com/ Search PubMed.
- R. C. Weast, D. R. Lide, M. J. Astle and W. H. Beyer, CRC Handbook of Chemistry and Physics, CRC Press, Inc., Boca Raton, FL, 70th edn, 1989- 1990 Search PubMed.
- Application Note, Low Impedance EIS at Its Limits Gamry Reference 30k Booster, Gamry Instruments, 2024, https://www.gamry.com/ Search PubMed.
- D. T. Livey and P. Murray, Surface Energies of Solid Oxides and Carbides, J. Am. Ceram. Soc., 1956, 39(11), 363–372 CrossRef.
- X. Yang, R. Xu, L. Wen, Z. Lou, Q. Chen and B. Li, Light-induced thermal convection for collection and removal of carbon nanotubes, Fundam. Res., 2022, 2, 59–65 CrossRef.
- S. Ren, Effect of Water Chemistry on Zeta Potential of Air Bubbles, Int. J. Electrochem. Sci., 2013, 8, 5828–5837 CrossRef.
- J. Bardeen, L. N. Cooper and J. R. Schrieffer, Theory of Superconductivity, Phys. Rev., 1957, 108(3), 1175–1204 CrossRef.
- R. H. Pettrucci, General Chemistry: Principles and Modern Applications, Pearson Prentice Hall, Upper Saddle River, 9th edn, 2007 Search PubMed.
- A. Sherman, S. J. Sherman and L. Russikoff, Basic Concepts of Chemistry, Houghton Mifflin Company, Boston, MA, 5th edn, 1992, ure.com/ Search PubMed.
| This journal is © The Royal Society of Chemistry 2024 |

