 Open Access Article
Splitting and authentication of the newest retrieved cellulose-rich organic fiber from the exterior layer of Bangladeshi palmyra seed sprouts
Fahmida-E- Karim *a,
Afsar Uddinb,
Md. Redwanul Islam
 a and
Shahidul Islamb
aDepartment of Textile Engineering, Ahsanullah University of Science and Technology (AUST), Dhaka, Bangladesh
bDepartment of Textile Engineering, BGMEA University of Fashion and Technology (BUFT), Dhaka, Bangladesh
First published on 24th September 2024
Abstract
The upward trajectory of plant-based cellulosic fiber originating from renewable sources is crucial to visualizing a sustainable future. This article reports a freshly developed and distinctive natural fiber derived from palmyra seed sprout fibers (PSSF) by employing hot water retting. The hygroscopic behavior (moisture regain and content) density, bundle fiber strength, burning behavior, and chemical composition of the fiber are determined using ASTM D1909, ASTM D2654, ASTM D891-18, ASTM D1445, ASTM D1230-22, and TAPPI standards, respectively. Crystallinity, fiber configuration, biological groups, flame behavior, and temperature responsiveness are determined using XRD, SEM, FTIR, burn test, and TGA tests. The reported cellulose-rich textile fiber that contains 64% cellulose with average moisture recovery and content percentages of 14.38% and 12.56%, respectively. The envisioned fiber has an average tensile strength of 11.05 g tex−1, a breaking extension of 1.8 mm, and a crystallinity of 38%. The highest temperature at which the fiber begins to deteriorate is 474 °C. This noble fiber can be utilized to create biological materials, cellulose nanoparticles, composites reinforced with fibers, and more.
1. Introduction
Sustainable fibers are those that are collected and separated in ways that mitigate their negative impact on the environment and the community.1 These fibers are frequently produced by employing conscientious manufacturing practices that provide acceptable working conditions and social wellbeing.2 When it comes to resource, energy, and pollutant consumption, they typically have little environmental impact.3 Sustainable natural fibers are typically favored over synthetic alternatives because they are biodegradable, have a smaller carbon impact, and may be used in circular economy activities.1,3 Considering the continual growth in the popularity of natural cellulosic fiber in recent years, both academic and commercial researchers are increasingly studying innovative natural fibers and their possible uses.4,5 They are particularly fascinating because of their unique features, which make them suitable for a wide range of sophisticated fibrous applications, such as reinforcement in composites, textiles, cellulose nanomaterials, activated or conductive carbon or nanotubes, biomaterials, and so on.6,7 Natural fibers have specific attributes such as tremendous strength, excellent heat resistance, biodegradability, recyclability, low cost, wide availability, and zero toxicity.8 Flax, hemp, areca, cotton, bagasse–jute, kapok, luffa, maize, coir, luffa, pineapple, and other materials are known as natural fibers in both traditional and modern contexts.9,10 Organic cotton, hemp, and linen are among the sustainable natural fibers that are used to make clothing, textiles, and home decor. Since these fibers are grown without the use of harmful pesticides, genetically modified organisms (GMOs), or extended amounts of water consumption, they are more environmentally friendly than traditional fibers.4,5,11 Their life cycle has less of an impact on the environment because they are also biodegradable. Plastic-based materials in packaging can be replaced by these natural fibers.12,13 Jute, a naturally occurring fiber derived from the jute plant, may be used to make biodegradable sacks, bags, and packaging products.1,2 Additionally, these fibers can be used in building construction materials as well as reinforcement materials. For example, bamboo is a naturally occurring fiber that grows swiftly and may be used to make furniture, wall panels, and flooring.12,14Worldwide, there are over 5000 different types of date palms, demonstrating the date palms' biodiversity. Many more varieties are found in other countries, with botanical descriptions indicating that there are around 1000 cultivars in Algeria, 400 in Iran, 370 in Iraq, 250 in Tunisia, 244 in Morocco, and 400 in Sudan.15,16 With fruit measuring up to 100 mm by 40 mm, date palm trees (Phoenix dactylifera L.) are the tallest species of Phoenix trees, reaching heights of over 30 meters. The fruits are highly palatable and nourishing.17 Date palms may adapt to a variety of situations thanks to their unique features. They are not erinaceous, although date palm trees may grow well in sand. Their roots have air gaps, which allows them to grow successfully in areas where soil water is near the surface. Date palm trees thrive best in higher quality soil and water, yet they can tolerate salinity rather well. Date palms are not xerophyte plants; although their leaves can withstand hot, dry weather, they still need lots of water.17,18 The date palm tree produces a large number of offshoots at its base. Something that distinguishes the date palm tree are the numerous offshoots that grow at the base of its trunk. The date palm tree's stalk is covered with dependably dull leaf bottoms. On top, it features a magnificent display of tall, pinnately divided leaves with needle-sharp fronds. There are usually 10 to 20 new leaves produced annually. The date palm's leaves are supported by a thick, fibrous, cylindrical sheath that reticulates around the base of the leaves. Together, they form a tight enclosure around the terminal bud.19
The intended objective of this research is to collect fibers from the outer layer of PSSF and determine and analyze their quality in order to present them as a renewable fiber derived from nature. No researches related to this topic were discovered, proving the research's originality. These features are then compared to those of other lignocellulosic fibers found in nature like jute, cotton, flax, Napier grass, etc.20 This comparative study sought to determine whether these materials are suitable for use as reinforcement in thermosetting and thermoplastic polymers for a variety of applications such as food packaging, medical devices, and structural engineering components.
2. Materials and methods
2.1 Palmyra seed sprout collection
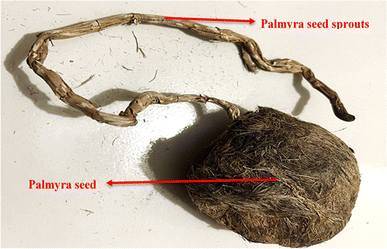
Palmyra sprouts are collected from a village near Kapasia, Gazipur, Dhaka. The seeds are kept on average for 4 to 6 months depending on the sprout's fiber maturity. The tested samples were kept for more than 5 months after they were collected. Fig. 1 shows the raw seed as well as the placement of the seed sprouts.2.2 Fiber extraction process
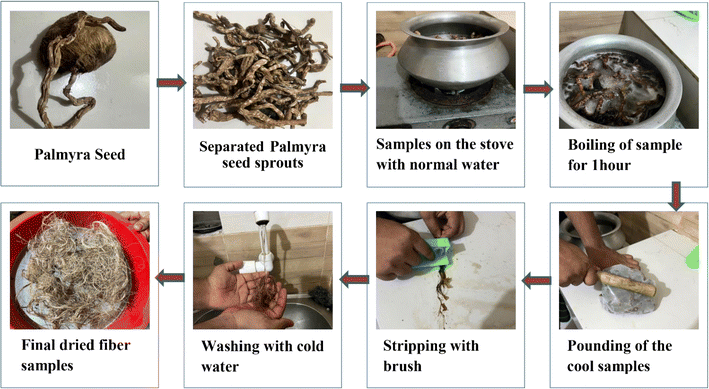
After collecting the palmyra seeds the sprouts were cut and separated. The PSSF were boiled in water at 100 °C for 1 hour and then the samples were cooled until the room temperature was reached. Subsequently the boiled sprouts were pounded with a medium weight object; as a consequence, the peels became soft and cleaned with normal water 4 to 5 times. Lastly the cleaned samples were kept at room temperature for 24 hours and they dried. The extraction flowchart is shown below in Fig. 2.2.3 Methods of fiber characterization
In those equations, W = weight of water in the samples, D = oven dry weight of the samples, MR = value of moisture regain, and MC = value of the content of moisture.
In this instance, ρw denotes the density of water (0.997 g cm−3 at 25), ρPalmyra represents the density of fiber in g cm−3, and m1 represents the mass of the basic pycnometer, m2 the mass of the pycnometer along with fiber, m3 the mass of the pycnometer filled with water, and m4 the mass of the pycnometer filled with both fiber and water.
3. Results and discussion
3.1 FTIR analysis
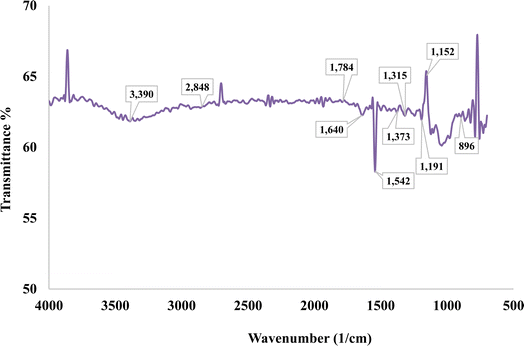
An infrared (IR) spectrum acquired by Fourier Transform Infrared (FTIR) spectroscopy is shown in Fig. 3, which shows transmittance (%) as a function of wavenumber (cm−1). There are many significant absorption bands in the spectrum, which correspond to distinct molecular vibrations. Among the notable peaks are those located at 3390 cm−1, 2848 cm−1, 2506 cm−1, 1934 cm−1, 1640 cm−1, 1315 cm−1, 1487 cm−1, 1542 cm−1, 1373 cm−1, 1191 cm−1, 1152 cm−1 and 896 cm−1. The large peak at around 3390 cm−1 is usually linked to O–H stretching vibrations, which frequently signify the existence of water or hydroxyl groups.Fig. 3 demonstrates the FTIR spectrum of PSSF. The fiber's peak regions of the corresponding functional group specifies are shown in Table 1.
| Peak locations wavenumber (cm−1) | Allocations | Reference |
|---|---|---|
| 3390 | Wide peak for the –OH bond's H-bonded stretching vibration | 27 |
| 2848 | Vibration of C–H stretching for cellulose and hemicellulose | 28 |
| 1784 | Carbonyl groups (C![[double bond, length as m-dash]](https://www.rsc.org/images/entities/char_e001.gif) O) present in lignin and hemicellulose O) present in lignin and hemicellulose |
9 |
| 1640 | Significant peak for natural cellulose's water absorption | 29 |
| 1542 | Low peak intensity for lignin's C![[double bond, length as m-dash]](https://www.rsc.org/images/entities/char_e001.gif) C groups C groups |
30 |
| 1446 | Bending vibration of CH2 groups in cellulosic matter | 9 |
| 1373 | C–H oscillation | 31 |
| 1315 | As a result of the O–H bending | 32 and 33 |
| 1152 | C–O stretching and acetyl group vibration in lignin | 34 |
| 1038 | C–OH oscillation | 3 and 32 |
| 896 | β-Glycoside bonding | 9 |
In the context of cellulose and hemicellulose, the C–H stretching vibration peak is located at 2848 cm−1.28 Numerous authors state that the peaks at 1786 cm−1 correlate to the carbonyl groups (C![[double bond, length as m-dash]](https://www.rsc.org/images/entities/char_e001.gif) O) of lignin and hemicellulose.9,31,32,34 At around 1640 cm−1, the water absorption of natural cellulose fiber peaked significantly.29 A signal with incredibly low intensity at 1542 cm−1 indicated the C
O) of lignin and hemicellulose.9,31,32,34 At around 1640 cm−1, the water absorption of natural cellulose fiber peaked significantly.29 A signal with incredibly low intensity at 1542 cm−1 indicated the C![[double bond, length as m-dash]](https://www.rsc.org/images/entities/char_e001.gif) C groups of lignin. A correlation was found between the peak at 1373 cm−1 and the C–H bending vibration. The peak occurs at 1315 cm−1 due to O–H bending.31 The C–O stretching vibration of the acetyl group in lignin was measured at 1152 cm−1. Peaks in the concentration of cellulose and hemicellulose in the fingerprint area, ranging from 1090 to 1200 cm−1, were attributed to C–O–C vibration. It was believed that C–OH vibration was responsible for the peak at 1038 cm−1, and β-glycoside linkage was responsible for the peak at 896 cm−1.28,31,34 This fiber's high cellulose content was verified by the FTIR peak patterns.30 The C–O stretching vibration of the acetyl group in lignin was measured at 1241 cm−1. The cause of the cellulose and hemicellulose peaks at around 1100–1200 cm−1 is C–O–C vibration.3
C groups of lignin. A correlation was found between the peak at 1373 cm−1 and the C–H bending vibration. The peak occurs at 1315 cm−1 due to O–H bending.31 The C–O stretching vibration of the acetyl group in lignin was measured at 1152 cm−1. Peaks in the concentration of cellulose and hemicellulose in the fingerprint area, ranging from 1090 to 1200 cm−1, were attributed to C–O–C vibration. It was believed that C–OH vibration was responsible for the peak at 1038 cm−1, and β-glycoside linkage was responsible for the peak at 896 cm−1.28,31,34 This fiber's high cellulose content was verified by the FTIR peak patterns.30 The C–O stretching vibration of the acetyl group in lignin was measured at 1241 cm−1. The cause of the cellulose and hemicellulose peaks at around 1100–1200 cm−1 is C–O–C vibration.3
3.2 Moisture regain and content analysis
A fiber's composition was greatly influenced by the amount of water it contained. A textile's ability to hold onto body heat under various climate conditions has a significant impact on how comfortable it may be. Moisture control is an essential component of performance in this regard. Textile properties like elasticity, friction, fiber diameter, and tensile strength are all affected by changes in moisture content. A textile may become weaker, more brittle, and fragile when its equilibrium relative humidity decreases. This moisture loss to the environment is minimized by preserving air humidity while processing the fibers.35 The moisture content% and moisture recovery chart for the samples are shown in Table 2.| Sample no. | Amount of sample (W + D) (g) | Amount of oven dry sample (g) (D) | Amount of water (g) (W) | Moisture regain (MR%) | Average moisture regain (%) | Moisture content (MC%) | Average moisture content (%) |
|---|---|---|---|---|---|---|---|
| Sample 1 | 1 | 0.8693 | 0.1307 | 15.03 | 14.38% | 13.07 | 12.56% |
| Sample 2 | 1 | 0.8865 | 0.1135 | 12.80 | 11.35 | ||
| Sample 3 | 1 | 0.8742 | 0.1258 | 14.39 | 12.58 | ||
| Sample 4 | 1 | 0.8712 | 0.1288 | 14.78 | 12.88 | ||
| Sample 5 | 1 | 0.8703 | 0.1297 | 14.90 | 12.97 | ||
| Standard deviation | 0.9150 | 0.7061 | |||||
| Coefficient of variation | 6.37% | 5.63% | |||||
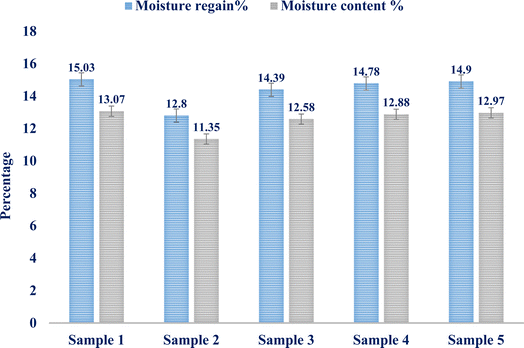
The study reveals that the average moisture content and recovery are 12.56% and 14.38%, respectively. Five distinct samples weighing one gram apiece from the isolated fibers are used to get the results. The two findings' standard deviations, 0.7061 and 0.915, respectively, indicated that the fiber samples' moisture content and moisture regain values are quite similar. The error values for the five tested samples' moisture content% and moisture recovery% are shown in the bar diagram in Fig. 4.
3.3 Fiber strength analysis
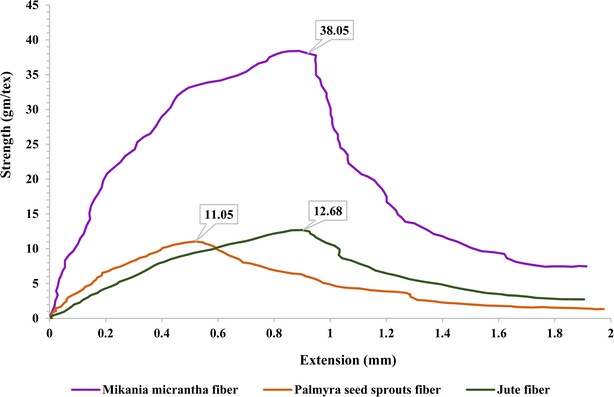
Fig. 5 below depicts the tensile strength of the extracted fiber. The graph's y-axis is labeled “strength (g tex−1)” and the x-axis is labeled “extension (mm).” The orange curve demonstrates the tensile behavior of palmyra seed sprout fiber. This fiber's strength increases steadily until it reaches its peak, after which it gradually declines. The average strength of PSSF is 11.5 g tex−1 along with 1.8 mm extension. This value is near to that of jute fiber and lower than that of the other natural fiber extracted from Mikania micrantha.3,36 Mikania micrantha fiber seems to be the strongest fiber in terms of tensile strength since it has the highest maximum strength among the three fibers. Although the maximum strength of PSSF is lower, their fiber peaks at a shorter extension, indicating a quicker response to tensile stress. As demonstrated by the available data, Mikania micrantha fiber appears to be the best choice for applications requiring high tensile strength and extensive extension before breaking. Jute fiber's moderate strength and extension make it an excellent choice for applications needing a balance of flexibility and strength. The fiber from PSSF has the lowest peak strength and extension, making it suitable for less demanding applications.3.4 XRD analysis
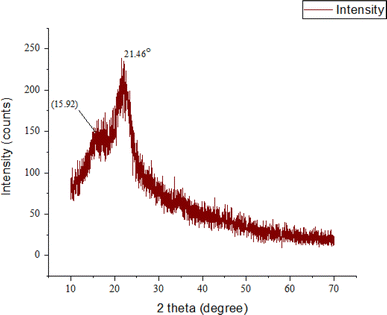
Iα and Iβ are the two kinds of natural cellulose. Some plant fibers that have a higher availability of Iβ than others are cotton, jute, flax, and hemp.37 By removing water and creating oxygen bridges between C-1 and C-4, beta cellulose is created. In this case, the stacking of parallel hydrogen-bonded sheets is maintained in part via a van der Waals contact.38 The graph in Fig. 6 depicts the X-ray diffraction (XRD) pattern of natural fiber retrieved from palmyra seed sprouts. The x-axis is labeled “2 theta (degree)” and encompasses 0 to 70 degrees, while the y-axis is labeled “intensity (counts)”. The graph displays peaks at multiple vantage points (2θ) representing the sample's crystalline areas. The pattern shows two conspicuous peaks: 2θ ≈ 15.92°, which is wide and intense, and 2θ = 21.46°, the tallest and sharpest peak, indicating a strong crystalline phase. This peak identifies the predictable diffraction of cellulose-I. The 38% crystallinity index (CI) implies that 62% of the natural fiber extracted from PSSF is amorphous and 38% crystalline. Fibers with higher crystalline structure areas show greater mechanical stability and stiffness. The fiber's mechanical strength and stiffness are modest, with this CI. It also denotes that the fiber is thermally stable and may withstand a large temperature range before disappearing. The fiber has a greater heterogeneous component (62%) than more crystalline polymer chains, making it more prone to swelling and disintegration in certain solvents. The fiber's reduced crystallinity index implies that it would be considered as an adequate choice for bio-composite materials that require a certain ratio.38 The tested and proven natural fiber CIs are contrasted in Table 3.| Name of the fibers | PSSF | Mikania micrantha | Jute | Cornhusks | Cotton stalk | Napier grass | Sugar cane straw | Sorghum stems | Flax | Hemp |
|---|---|---|---|---|---|---|---|---|---|---|
| Cellulose% | 64 | 56.42 | 64.4 | 80–87 | 79 | 45.66 | 33.5 | 65 | 62–71 | 67–75 |
| Hemicellulose% | 8 | 21.42 | 12 | — | — | 33.67 | — | 16–18 | 16–18 | |
| Lignin% | 24 | 15.78 | 11.8 | — | 13.7 | 20.60 | 25.8 | 6.5 | 3–4.5 | 3–5 |
| Crystallinity index | 38 | 72 | 71 | 48–50 | 47 | — | — | — | 80 | 88 |
| Extraction process | Boiling water, 100 °C | 5% NaOH, 90–100 °C | Water | 5% NaOH | 2N NaOH, boiling temperature | Chemical | — | 2% NaOH | — | — |
| References | Present work | 3 | 12 | 39 | 40 | 41 | 34 | 42 | 43 | 43 |
3.5 TGA and DSC analysis
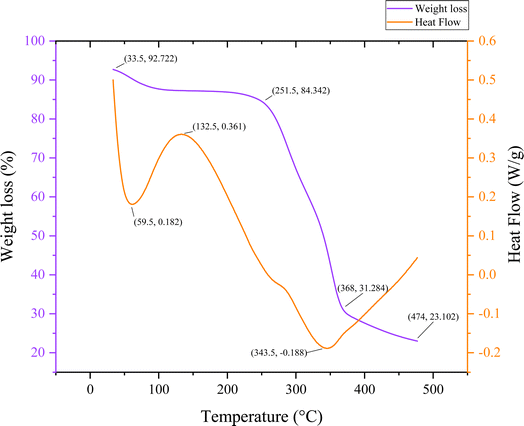
Fig. 7 below shows the palmyra seed sprout fiber sample's thermogravimetric behavior along with the values found from differential scanning calorimetry. The PSSF's mass change as a function of temperature or time is displayed in this graph. The weight reduction as a percentage of the sample's starting weight is displayed on the graph's left y-axis. The heat flow in watts per gram (W g−1) is displayed on the graph's right y-axis. The temperature in degree celsius (°C) is displayed on the x-axis. Small circles are displayed to represent the data points on the graph. Connecting the data points are lines as well. The weight of the sample reduces with increasing temperature, as the line graph illustrates. This implies that as it is heated, the sample is disintegrating. A more intricate heat flow curve is shown.Initially the weight reduction starts significantly at 100 °C, reaching 87.7%; this is probably because moisture or volatiles evaporate at that temperature. With a heat flow of 0.182 W g−1 and a first endothermic peak at 59.5 °C, dehydration is suggested. In the intermediate phase, subsequent material changes, maybe a phase shift, are indicated by a large endothermic event at 132.5 °C (0.361 W g−1). Effective decomposition is indicated by the weight loss of 84.342% at 251.5 °C. An exothermic peak at 343.5 °C (−0.188 W g−1), indicating further breakdown, is the most notable thermal event. The weight reduction is substantial by 368 °C (31.284%), which denotes that the decomposition starts. Finally the material continues to decompose or convert at 474 °C as evidenced by its weight loss of 23.102% and heat flow of −0.2 W g−1.
The compatibility of PSSF with the other fibers is illustrated in Table 4, which compares the thermal behavior of the multiple fibers listed below.
| Fiber name | PSSF | Mikania micrantha | Prosopis juliflora | Azadirachta indica | Phaseolus vulgaris | Heteropogon contortus | Saccharum bengalense grass | Jack tree fiber |
|---|---|---|---|---|---|---|---|---|
| Preliminary decomposition temperature (°C) | 100 °C | 103 °C | 66.2 °C | 97 °C | 91.2 °C | 90 °C | 100 °C | 104.5 °C |
| Imminent disintegration temperature (°C) | 474 °C | 477 °C | 351.3 °C | 321.2 °C | 328.5 °C | 337.7 °C | 600 °C | 565 °C |
| Reference | This work | 3 | 44 | 45 | 46 | 47 | 48 | 27 |
3.6 SEM analysis
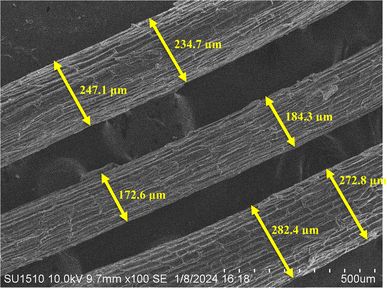
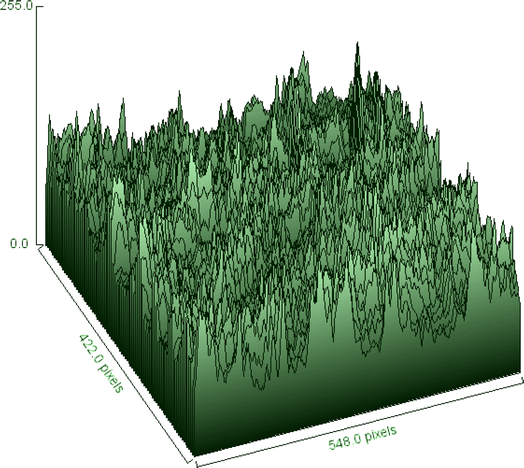
The surface morphology of the sample may be seen intuitively in the SEM image, and its surface roughness and texture can be represented statistically in the 3D surface plot. When these resources are combined, they enable an exhaustive analysis of the sample, which is useful for research applications where surface properties are critical, as well as material characterization and integrity management.34 At a 100-fold magnification, Fig. 8 provides a thorough look of the sample. The view is around 500 micrometers (μm) broad, according to the scale bar at the bottom right. Similar to the tested fiber's surface ridges, the surface seems to be composed of parallel, elongated structures. These formations have a rough texture that resembles a layered surface. Fiber diameters vary from one another.The fiber diameter is 232.3 μm on average. Lignin and hemicellulose, which make up the PSSF's outer layer, are surface binding components. Surface roughness enhances the contact surface area, which improves fiber adhesion to the matrix in composite applications.48 In Fig. 9, the 3D surface map portrays the sample's surface as visible in the SEM photograph.
The z-axis displays the intensity or height information, which most likely correlates to the grayscale values in the SEM image, while the x and y axes display the image's pixel dimensions. The surface map depicts height fluctuations over the fiber's surface, with peaks and valleys representing places with higher and lower electron emission, respectively. Differences in electron density, which are connected with intensity values, are related to fiber surface properties such as texture, roughness, and perhaps composition. The end result is that the fiber surface is appropriate for bonding with the matrix for composite reinforcement.
3.7 Chemical composition analysis
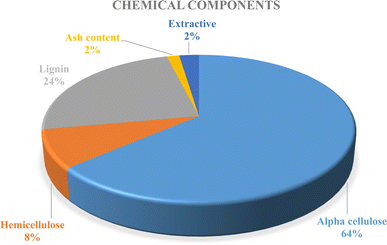
Determining the chemical behavior of any kind of substance requires identification. Properties, structure, characteristics, and processing capabilities of fiber are all influenced by its composition. Larger quantities of lignin, hemicellulose, and α-cellulose were detected in the fiber obtained from palmyra seed sprouts. It is made up of 24.36% lignin, 08.74% hemicellulose, and 64.74% alpha-cellulose. Elevated cellulose concentration promotes high-value uses and facilitates simple processing for many uses. It can enhance the crystalline features, mechanical properties, biodegradability, hydrolysis resistance, and thermal stability of a material, among other attributes. Small amounts of hemicellulose and lignin are present in any fiber appropriate for high-value composite applications, helping to regulate the fibers' stiffness and bundling. The ash content was 1.58%, moisture content was 12.58%, and extractive percentage was 2.88%, according to the results. The pie chart represents the percentage of the chemical components in Fig. 10 below.3.8 Fiber density measurement
Based on the molecular weight and intermolecular tensions inside the fiber, a fiber's mass per unit volume determines its density. The configuration of the fibers and their molecular makeup affect density. Because of their innate cellular structures, natural fibers like wool and cotton typically have a range of densities, while synthetic fibers may be made to have a particular density by regulating the polymerization approach. Fiber tensile strength, elasticity, and durability are mechanical qualities that are influenced by density. Strength and resistance to deterioration are increased in higher density fibers because their molecules are usually packed closer together. A pycnometer examination of the recently extracted fiber from PSSF revealed a density of 1.3354 g cm−3. The coefficient of variation is 2.3%. The data are represented in Table 5. Compared to other fibers like cotton, jute, flax, etc., this fiber has a lesser density.49 This suggests that it could be a wise choice for creating fiber-reinforced composites.| Sample no. | Density (g cm−3) | Average (g cm−3) |
|---|---|---|
| Sample 1 | 1.3759 | 1.3354 |
| Sample 2 | 1.3194 | |
| Sample 3 | 1.3567 | |
| Sample 4 | 1.2985 | |
| Sample 5 | 1.3267 | |
| Standard deviation | 0.0307 | |
| Coefficient of variation | 2.30% | |
3.9 Responses of the burn test
The PSSF manifested instantaneous combustion, and sparking within seconds upon contact with the flame. A bright yellow flame was encountered, pointing to a quick combustion process. The burning process produced an odd fragrance that was similar to burning wood or leaves, which is a characteristic of an organic cellulose material.50 After burning, the fibers turned into a light, fluffy gray ash. This ash broke easily in the hands and was quite brittle. The smoke generally appeared gray or white during the fire. Most importantly, the absence of a fume threat from the smoke indicated that there were no hazardous byproducts. These results have implications for quality control in cellulose-based goods, textile analysis, forensic investigations, and identification.4. Conclusion
Cellulose, a highly prevalent basic constituent in the textile industry, has a variety of applications, including fiber-reinforced composite materials, medical textiles, clothing, and others. The goal of cellulose-based research has always been to identify new sources. The research also introduced and characterized palmyra seed sprouts, a novel cellulosic fiber. Following retting with water, the substance was evaluated. The chemical analysis suggests that it has more cellulose (64%). The XRD and FTIR data support the comparison of the fibers to other cellulosic fibers. SEM testing confirmed an excellent morphology. The fiber is thermally stable up to 251 °C, with significant deterioration happening between 251 °C and 368 °C, according to thermogravimetric experiments. This breakdown pattern shows the fiber's cellulose content and crystal structure. This fiber offers a moderate density, strength, and elongation. This fiber's potential as a reinforcement for bio-composite materials, cellulose nanoparticles, and biomaterials is being intensively researched.Data availability
The datasets used and/or analyzed during the current study available from the corresponding author on reasonable request.Author contributions
Fahmida-E. Karim: conceived and designed the experiments; wrote and revised the paper. Md Redwanul Islam: analyzed and interpreted the data. Afsar Uddin: performed the experiments. Shahidul Islam: contributed reagents, materials, analysis tools or data.Conflicts of interest
The authors declare that they have no known competing financial interests or personal relationships that could have appeared to influence the work reported in this paper.References
- S. Palamutcu, Sustainable Textile Technologies, 2017, pp. 1–22 Search PubMed.
- M. M. Devarajan, G. Kumaraguruparan, K. J. Nagarajan and C. Vignesh, Int. J. Biol. Macromol., 2024, 254, 127848 CrossRef CAS PubMed.
- F.-E. Karim, M. R. Islam, R. Ahmed, A. B. Siddique and H. A. Begum, Heliyon, 2023, 9, e19360 CrossRef CAS PubMed.
- H. Nawaz, X. Zhang, S. Chen, T. You and F. Xu, Carbohydr. Polym., 2021, 267, 118135 CrossRef CAS PubMed.
- B. M. Bright, B. J. Selvi, S. Abu Hassan, M. M. Jaafar, S. Suchart, S. Mavinkere Rangappa and B. Kurki Nagaraj, J. Nat. Fibers, 2022, 19, 9373–9383 CrossRef CAS.
- M. T. Selvan, M. Ramesh, A. F. Sahayaraj, H. J. Prabu and K. J. Nagarajan, Int. J. Biol. Macromol., 2024, 270, 132492 CrossRef CAS PubMed.
- S. T. K. Rajan, K. J. Nagarajan, V. Balasubramani, K. Sathickbasha, M. R. Sanjay, S. Siengchin and A. N. Balaji, Int. J. Adhes. Adhes., 2023, 126, 103492 CrossRef CAS.
- N. Sgriccia, M. C. Hawley and M. Misra, Composites, Part A, 2008, 39, 1632–1637 CrossRef.
- F.-E. Karim, M. R. Islam, M. H. Supto, A. A. M. Rafi, T. R. Tanni and H. A. Begum, Clean. Eng. Technol., 2024, 19, 100736 CrossRef.
- J. Biagiotti, D. Puglia and J. M. Kenny, J. Nat. Fibers, 2004, 1, 37–68 CrossRef CAS.
- A. Karimah, M. R. Ridho, S. S. Munawar, Ismadi, Y. Amin, R. Damayanti, M. A. R. Lubis, A. P. Wulandari, Nurindah, A. H. Iswanto, A. Fudholi, M. Asrofi, E. Saedah, N. H. Sari, B. R. Pratama, W. Fatriasari, D. S. Nawawi, S. M. Rangappa and S. Siengchin, Polymers, 2021, 13, 4280 CrossRef CAS PubMed.
- E. Awwad, B. Hamad, M. Mabsout and H. Khatib, 2nd Int. Conf. Sustain. Constr. Mater. Technol., 2010, pp. 575–582 Search PubMed.
- G. R. Raghav, K. J. Nagarajan, M. Palaninatharaja, M. Karthic, R. A. Kumar and M. A. Ganesh, Int. J. Biol. Macromol., 2023, 249, 126119 CrossRef CAS PubMed.
- M. R. Sanjay, G. R. Arpitha, L. L. Naik, K. Gopalakrishna and B. Yogesha, Nat. Resour., 2016, 7, 108–114 CAS.
- A. M. A. Osman, Acta Hortic., 1984, 231–238 CrossRef.
- D. A. Demason and W. W. Thomson, Bot. Gaz., 1981, 142, 320–328 CrossRef.
- A. A. Jaradat and A. Zaid, Food, Agric. Environ., 2004, 2, 208–217 Search PubMed.
- M. Chandrasekaran and A. H. Bahkali, Saudi J. Biol. Sci., 2013, 20, 105–120 CrossRef CAS PubMed.
- M. I. Hussain, M. Farooq and Q. A. Syed, Food Biosci., 2020, 34, 100509 CrossRef CAS.
- V. Balasubramani, K. J. Nagarajan, M. Karthic and R. Pandiyarajan, Int. J. Biol. Macromol., 2024, 259, 129273 CrossRef CAS PubMed.
- Standard Test Methods for Moisture in Textiles, 2023, https://www.astm.org/d2654-22.html Search PubMed.
- Standard Test Method for Breaking Strength and Elongation of Cotton Fibers (Flat Bundle Method), https://www.astm.org/d1445-05.html Search PubMed.
- L. Segal, J. J. Creely, A. E. Martin and C. M. Conrad, Text. Res. J., 1959, 29, 786–794 CrossRef CAS.
- A. D. O. Betene, F. E. Betene, F. Martoïa, P. J. J. Dumont, A. Atangana and P. M. A. Noah, J. Miner. Mater. Charact. Eng., 2020, 08, 205–222 CAS.
- Standard Test Methods for Specific Gravity, Apparent, of Liquid Industrial Chemicals, https://www.astm.org/d0891-18.html Search PubMed.
- Standard Test Method for Flammability of Apparel Textiles 1, https://cdn.standards.iteh.ai/samples/112408/9887694ba6e545e0b446d3e4b8117f74/ASTM-D1230-22.pdf Search PubMed.
- S. Hossain, M. A. Jalil, T. Islam and M. M. Rahman, Heliyon, 2022, 8, e11667 CrossRef CAS PubMed.
- A. Azanaw, A. Haile and R. K. Gideon, Cellulose, 2019, 26, 795–804 CrossRef CAS.
- P. Senthamaraikannan, M. R. Sanjay, K. S. Bhat, N. H. Padmaraj and M. Jawaid, J. Nat. Fibers, 2019, 16, 1124–1131 CrossRef CAS.
- G. Rajeshkumar, G. L. Devnani, J. P. Maran, M. R. Sanjay, S. Siengchin, N. A. Al-Dhabi and K. Ponmurugan, Cellulose, 2021, 28, 5373–5385 CrossRef CAS.
- S. Indran and R. E. Raj, Carbohydr. Polym., 2015, 117, 392–399 CrossRef CAS PubMed.
- P. Manimaran, P. Senthamaraikannan, M. R. Sanjay, M. K. Marichelvam and M. Jawaid, Carbohydr. Polym., 2018, 181, 650–658 CrossRef CAS PubMed.
- R. Dalmis, S. Köktaş, Y. Seki and A. Ç. Kılınç, Cellulose, 2020, 27, 127–139 CrossRef CAS.
- S. M. Costa, P. G. Mazzola, J. C. A. R. Silva, R. Pahl, A. Pessoa and S. A. Costa, Ind. Crops Prod., 2013, 42, 189–194 CrossRef CAS.
- A. Célino, S. Fréour, F. Jacquemin and P. Casari, J. Appl. Polym. Sci., 2013, 130, 297–306 CrossRef.
- J. Gassan and A. K. Bledzki, J. Appl. Polym. Sci., 1999, 71, 623–629 CrossRef CAS.
- H. Zhao, J. Kwak, Z. Conradzhang, H. Brown, B. Arey and J. Holladay, Carbohydr. Polym., 2007, 68, 235–241 CrossRef CAS.
- B. A. N. and N. K. J., Carbohydr. Polym., 2017, 174, 200–208 CrossRef PubMed.
- N. Reddy and Y. Yang, Green Chem., 2005, 7, 190 RSC.
- N. Reddy and Y. Yang, Bioresour. Technol., 2009, 100, 3563–3569 CrossRef CAS PubMed.
- K. O. Reddy, C. U. Maheswari, M. Shukla and A. V. Rajulu, Mater. Lett., 2012, 67, 35–38 CrossRef CAS.
- N. Reddy and Y. Yang, J. Agric. Food Chem., 2007, 55, 5569–5574 CrossRef PubMed.
- G. Gedik, Cellulose, 2021, 28, 6899–6915 CrossRef.
- S. S. Saravanakumar, A. Kumaravel, T. Nagarajan, P. Sudhakar and R. Baskaran, Carbohydr. Polym., 2013, 92, 1928–1933 CrossRef PubMed.
- P. Manimaran, P. Senthamaraikannan, K. Murugananthan and M. R. Sanjay, J. Nat. Fibers, 2018, 15, 29–38 CrossRef.
- B. Gurukarthik Babu, D. Prince Winston, P. SenthamaraiKannan, S. S. Saravanakumar and M. R. Sanjay, J. Nat. Fibers, 2019, 16, 1035–1042 CrossRef.
- N. R. J. Hyness, N. J. Vignesh, P. Senthamaraikannan, S. S. Saravanakumar and M. R. Sanjay, J. Nat. Fibers, 2018, 15, 146–153 CrossRef CAS.
- R. Vijay, D. L. Singaravelu, A. Vinod, I. D. F. Paul Raj, M. R. Sanjay and S. Siengchin, J. Nat. Fibers, 2020, 17, 1739–1747 CrossRef CAS.
- I. Elfaleh, F. Abbassi, M. Habibi, F. Ahmad, M. Guedri, M. Nasri and C. Garnier, Results Eng., 2023, 19, 101271 CrossRef CAS.
- M. N. Azman Mohammad Taib, T. S. Hamidon, Z. N. Garba, D. Trache, H. Uyama and M. H. Hussin, Polymer, 2022, 244, 124677 CrossRef CAS.
| This journal is © The Royal Society of Chemistry 2024 |

