 Open Access Article
Tracking and recording of intracellular oxygen concentration changes in cell organelles: preparation and function of azide-modified fluorescent probes†
Hiroki Makanai,
Miei Kanda,
Sae Harada,
Tatsuya Nishihara and
Kazuhito Tanabe
 *
*
Department of Chemistry and Biological Science, College of Science and Engineering, Aoyama Gakuin University, 5-10-1 Fuchinobe, Chuo-ku, Sagamihara, 252-5258, Japan. E-mail: tanabe.kazuhito@chem.aoyama.ac.jp
First published on 18th June 2024
Abstract
Tracking hypoxic environments and changes in oxygen levels contribute to the elucidation of pathological mechanisms. In this study, we attempted to design molecular probes that can be activated to show fluorescence under hypoxic conditions and that can move to specific cell organelles. Considering that azide groups were selectively reduced to primary amines by reductases under hypoxic conditions, we prepared Hoechst and fluorophore Cy-5 derivatives with azide groups (Hoechst-N3 and Cy-N3) as hypoxia probes. Hoechst-N3 and Cy-N3 showed weak fluorescence, but once activated in the cytosol of hypoxic cells, they exhibited robust fluorescence and then moved to their target organelles, the cell nucleus and mitochondria. In addition, when these probes were administered to the cells in the proper sequence, each probe was activated in response to the intracellular oxygen concentration at that point and exhibited oxygen concentration-dependent fluorescence at the target organelle. By measuring the fluorescence intensity of the cell nucleus and mitochondria, we successfully traced the history of changes in intracellular oxygen levels. Thus, we achieved tracking and recording of oxygen status in the cells.
Introduction
Oxygen molecules are functional substances that actively work in living systems. Fluctuation of oxygen levels in cells significantly affects their functions such as cell growth, differentiation, and signaling.1–3 One of the most important behaviors of molecular oxygen in cells is that fluctuations in its levels can profoundly affect resistance to therapy, especially radiotherapy for cancer.4–6 Tumor hypoxia is closely associated with the malignant phenotype of cancer cells, resistance to cancer radiotherapies, and a high mortality rate among patients with cancer.7–9 Therefore, tracking the oxygen status has been imperative to understand the cellular functions and provide appropriate medical treatment.Organelle-targeted fluorescent probes have been designed to visualize cellular chemical messengers and functions with a high degree of accuracy, making them valuable tools for studying biochemical reactions and events in each organelle.10–16 Several probes have been designed to monitor oxygen status in specific organelles. For example, Tobita and coworkers reported mitochondria-targeted phosphorescent probes bearing cationic iridium complexes.11 Our group prepared cell nucleus-targeted phosphorescent probes using the Hoechst molecule and ruthenium complexes.15 These conventional probes interact directly with oxygen molecules and exhibit oxygen-responsive phosphorescence, and they could detect the real-time oxygen status in cells. However, emission intensity of these probes changed instantly when oxygen concentration changes, and thus, they could not detect the history of changes in intracellular oxygen levels in spite that functional behavior of tumor cells as well as the cope with therapeutic insults, differ depending upon the extent and history of the oxygen variation.17
Herein, we newly designed fluorescent probes, which were selectively activated by reductases in hypoxic cells (Fig. 1), to show the history of changes in intracellular oxygen levels. After their activation in cytosol of hypoxic cells, the probes were transported to their target organelles. Thus, these probes accumulated in their target organelles while retaining information on intracellular oxygen levels. Given that the azide groups were reduced to primary amines by reduction enzymes in hypoxic cells18,19 and often quenched fluorescence emission,20 we designed a derivative of the nuclear-staining reagent Hoechst21 with an azide group (Hoechst-N3) as hypoxia indicator in the cell nucleus. We also prepared a fluorescent Cy5 derivative with the azide group (Cy-N3) as a hypoxia indicator in mitochondria. Cy5 derivatives were known to accumulate in mitochondria because of their positive charge.22 Both probes showed negligible fluorescence due to the quenching effect of azide group. However, they were reduced to fluorophores with primary amines once activated in cytosol of hypoxic cells, leading to bright fluorescence emission. After activation, the probes moved to their target organelles, cell nucleus and mitochondria, respectively. Both probes were not reversible and retained a distinct bright fluorescence once activated. Eventually, tracking and recording the history of changes in intracellular oxygen levels were possible with the proper use of each probe and observing the fluorescence emission in the cell nucleus and mitochondria.
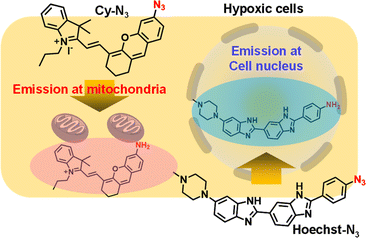 | ||
| Fig. 1 Illustration of hypoxia probes that were accumulated in cell nucleus (Hoechst-N3) and mitochondria (Cy-N3). | ||
Results and discussion
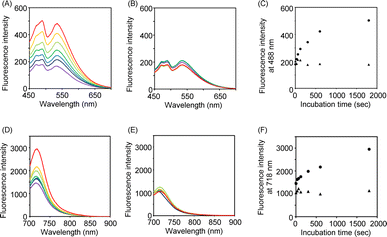
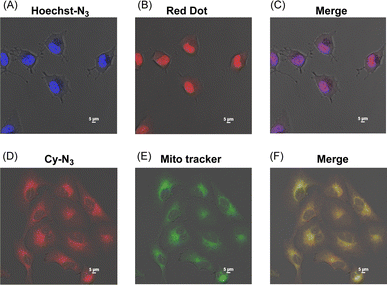
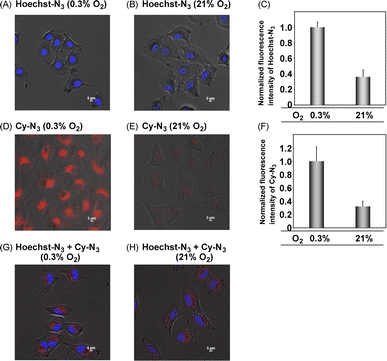
As shown in Scheme 1, we synthesized Hoechst-N3 by azidation of Hoechst derivatives bearing amino group (Hoechst-NH2).23 On the other hand, Cy-N3 was prepared according to a previously reported procedure.24 Initially, we monitored the reactions of Hoechst-N3 and Cy-N3 in the presence of NADPH and rat liver microsome, which work as reducing agents. We measured the changes in their emission spectra in phosphate buffer solution (pH 7.4) during the enzymatic activation under hypoxic or aerobic conditions. Fig. 2 shows representative emission spectra of Hoechst-N3 and Cy-N3. Before activation by enzyme, these probes showed weak fluorescence (the quantum yield of fluorescence emission for Hoechst-N3 and Cy-N3 were estimated to be 0.13 and 0.01, respectively). Intense fluorescence of Hoechst-N3 was observed around 450–550 nm upon enzymatic activation under hypoxic conditions (0% O2), whereas the activation at higher oxygen concentration (21% O2) led to a lower fluorescence intensity. We also confirmed that enzymatic treatment of Hoecsht-N3 under 10% O2 conditions resulted in a negligible activation and lead to a weak fluorescence (Fig. S1†). Similar hypoxia-selective fluorescence was observed around 720 nm for Cy-N3. These findings strongly indicate that Hoechst-N3 and Cy-N3 could be activated only in hypoxic cells.We next applied Hoechst-N3 and Cy-N3 to live cell imaging of human lung adenocarcinoma cell line A549 to evaluate their specific accumulation and emission in target organelles. We employed A549 cells because several reductases are known to be activated in these cells selectively under hypoxic conditions.25 The cells were incubated with Hoechst-N3 or Cy-N3 under hypoxic conditions and then subjected to confocal microscopy. As shown in Fig. 3, both fluorophores exhibited robust emission in the cells. Co-staining with RedDot or mitotracker revealed that Hoechst-N3 accumulated in the nucleus, while that Cy-N3 accumulated in mitochondria. The co-localization coefficients for Hoechst-N3 to RedDot and Cy-N3 to mitotracker were estimated to be 0.79 and 0.81, respectively. Additional experiments revealed that these probes showed negligible cytotoxicity toward A549 cells (Fig. S2†) and the minimum concentration of these probes required for biological imaging was 1 μM for both probes (Fig. S3†). Considering their behavior during the enzymatic activation, we applied them to cellular imaging of A549 cells that were cultured under hypoxic or aerobic conditions. As shown in Fig. 4, administration of Hoechst-N3 or Cy-N3 allowed bright fluorescence at their target, cell nucleus or mitochondria in hypoxic cells. On the other hand, increasing oxygen concentration from 0.3% to 21% resulted in a weak emission. Thus, the oxygen concentration-dependent emission of these fluorescent probes at their targets was observed. In separate experiments, we confirmed that the fluorescence emissions of reduction product of these probes were not affected by the oxygen concentration in the cells (Fig. S4†). We next conducted a simultaneous staining of mitochondria and nucleus in hypoxic cells using these probes. Both probes were administered to the hypoxic or aerobic cells, and then, the cells were subjected to microscopic evaluation (Fig. 4G and H). Although aerobic cells showed weak emission in cell nucleus and mitochondria, strong emission was observed in both target organelles in hypoxic cells. We also demonstrated similar cellular imaging of human colorectal cancer cell line HCT116 and human embryonic kidney (HEK)-293 cells using Hoechst-N3 and Cy-N3, and confirmed the hypoxia-selective emission in the cell nucleus and mitochondria after the administration of these probes (Fig. S5 and S6†).
We next attempted to identify the location of the enzymatic activation of these probes, Hoechst-N3 and Cy-N3, in the cells. For this purpose, Hoechst-N3 and Cy-N3 were administered to A549 cells, and then the cells were incubated for 30 min under aerobic conditions. After incubation, the medium was replaced with a fresh one, which was purged by nitrogen gas, and thus, cellular oxygen concentration was decreased. Microscopic evaluation revealed that the mitochondrial emission was enhanced, while nuclear emission intensity changed negligibly even after a decrease in intracellular oxygen levels (Fig. 5). These results strongly suggest that these probes were activated intracellularly and moved to their targets through the following processes; it seems that neither Hoechst-N3 nor Cy-N3 was activated in the cell nucleus, but that they were activated in cytosol. After activation of both probes in the cells, Hoechst-N3 moved to cell nucleus promptly, while Cy-N3 accumulated in mitochondria relatively slowly. Therefore, a decrease in oxygen levels led to an enhancement of mitochondrial emission, while negligible change in nuclear emission was observed even after the intracellular oxygen levels were decreased by a replacement of the medium having a low oxygen concentration. To investigate further the location of Hoecst-N3 and Cy-N3 activation, cell deoxygenation using prominent mitochondrial uncouplers was assessed. The uncouplers increase the consumption of cellular molecular oxygen because they uncouple the respiratory chain and oxidative phosphorylation in the mitochondria to increase the rate of respiration. After incubation with both Hoecht-N3 and Cy-N3 for 30 min, the cells were stimulated by valinomycin as a mitochondrial uncoupler (Fig. S7†). A clear enhancement of emission was observed in mitochondria, but not in the cell nucleus. Thus, Hoecsht-N3 rapidly moved to the nucleus and was largely unaffected by changes in oxygen concentration, whereas Cy-N3 was strongly affected by deoxygenation and was reduced due to its slow transfer to the mitochondria.
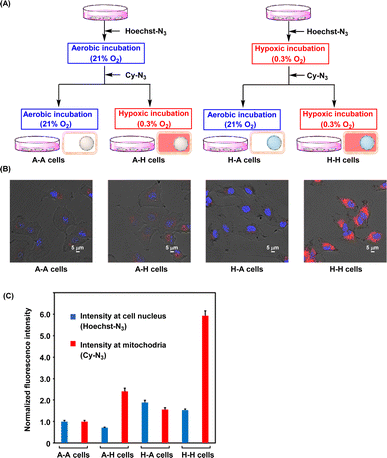
The oxygen levels in solid tumor tissue were found to change significantly because of blood flow fluctuations.26,27 Changes in oxygen concentration in the tissue impact therapeutic resistance, especially to radiotherapy,4–6 and therefore, understanding the oxygen status in tumor cells is important for proper medical treatment. As mentioned above, Hoechst-N3 and Cy-N3 were activated in the hypoxic cells. Thus, we examined these probes to apply recording whether the cells were once hypoxic. As shown in Fig. 6A, we prepared four types of cells, A–A, A–H, H–A, and H–H cells, using these probes, and the cells were subjected to microscopy. First, the A–A cells were prepared as follows. The A549 cells were incubated with Hoechst-N3 for 15 min under aerobic conditions, and then, Cy-N3 was administered. The resulting cells were further incubated under aerobic conditions for 30 min. The A–A cells were expected to show weak emission at both cell nucleus and mitochondria. Second, the A–H cells were prepared as follows. Initial incubation with Hoechst-N3 under aerobic conditions for 15 min and following incubation with Cy-N3 for 30 min under hypoxic conditions were conducted. The A–H cells were expected to show weak emission at cell nucleus, but the emission at mitochondria was expected to be bright. Third, for preparation of H–A cells, Hoechst-N3 was administered to the cells, which were incubated for 15 min under hypoxic conditions. Then, Cy-N3 was added and the cells were further incubated for 30 min under aerobic conditions. The H–A cells were expected to fluoresce at cell nucleus, while emission at mitochondria was expected to be weak. Finally, for preparation of H–H cells, hypoxic incubation of the cells in the presence of Hoechst-N3 was conducted for 15 min, and then Cy-N3 administration and further incubation under hypoxic conditions were implemented. Bright emission at both mitochondria and cell nucleus in H–H cells was expected. The images of these four types of cells were shown in Fig. 6B. As expected, the emission in the nucleus and mitochondria changed along with the change in oxygen concentration. Thus, determining the history of changes in the oxygen levels of living cells is possible based on the emission patterns of these molecular probes.
Conclusions
In summary, we prepared two types of hypoxia probes with azide groups as hypoxia-responsive units. These probes, Hoechst-N3 and Cy-N3, were reduced by intracellular enzymes, which selectively converted the azide group of these probes into primary amines under hypoxic conditions. Hoechst-N3 was activated intracellularly under hypoxic conditions and then accumulated in the cell nucleus. On the other hand, Cy-N3 accumulated at mitochondria after intracellular activation. Thus, they fluoresced at their targets in hypoxic cells. These probes could be used to record the oxygen status. When administered in the proper order, each probe was activated in response to cytoplasmic oxygen levels and accumulated in each target. In other words, by measuring the emission intensity of the cell nucleus and mitochondria, it was possible to estimate the history of oxygen concentration change in the cells. Thus, the probes designed in this study act as hypoxia indicator. The application of these probes to identification of oxygen status in vivo in progress.Experimental section
Synthesis of Hoechst-N3
Hoechst-NH2 (18 mg, 4.25 × 10⁻⁵ mol) was dissolved in 6 M aq. HCl (200 μL), and NaNO2 (14 mg, 2.0 mmol) in H2O (1.0 mL) was added to the solution. The mixture was stirred at 0 °C for 30 min, and then, NaN3 (14 mg, 2.2 mmol) in H2O (1.0 mL) was added to the solution. The resulting solution was further stirred for 30 min at 0 °C and then, stirred for 30 min at ambient temperature. After the reaction, the resulting mixture was concentrated in vacuo. The crude product was purified by silica gel column chromatography (CHCl3/MeOH/aq. NH3 = 6/1/0.1) to give Hoechst-N3 (18 mg, 94%) as red solid: MP > 300 °C; 1H NMR (CD3OD, 500 MHz) δ 8.08 (s, 1H), 7.94 (d, 2H, J = 8.5 Hz), 7.82 (dd, 1H, J = 1.0, 8.5 Hz), 7.71 (m, 1H), 7.43 (d, 1H, J = 5.5 Hz), 7.25 (m, 3H), 6.97 (dd, 1H, J = 2.0, 9.0 Hz), 3.18 (t, 4H, J = 4.5 Hz), 2.66 (t, 1H, J = 4.5 Hz), 2.37 (s, 3H); 1H NMR (CD3OD, 125 MHz) δ 154.6, 152.8, 152.0, 148.1, 142.2, 138.8, 132.2, 130.9, 128.5, 127.9, 125.6, 124.3, 121.2, 119.1, 118.2. 115.2, 114.9, 101.1, 54.8, 50.2, 44.6; FABMS (NBA) m/z 450 [(M + H)+]; HRMS calcd for C25H24N9 [(M + H)+] 450.2155, found 450.2155.Tracking enzymatic reduction of Hoechst-N3 and Cy-N3 using fluorescence spectroscopy
To establish a hypoxic condition, 500 nM of Hoechst-N3 and Cy-N3 in phosphate buffer (pH 7.4) were nitrogen purged. Then, rat liver microsome (1 μg mL−1) and NADPH (1 μM) were added to these solutions and incubated at 37 °C. After the enzymatic reaction, Hoechst-N3 solution was added to duplex DNA solution (500 nM) and further incubated for 1 h. These resulting mixtures were subjected to the measurement of fluorescence (excitation wavelengths were 405 nm for Hoechst-N3 and 685 nm for Cy-N3 respectively).General procedure of fluorescence observation in living cells
A549 cells were cultured in DMEM containing 1% antibiotics and 10% FBS. The cells were seeded into 96-well plates (5000 cells per well) and cultured at 37 °C in a well-humidified incubator with 5% CO2 and 95% air for 24 h. The cells were then incubated with aqueous solution of Hoechst-N3 and Cy-N3. After the incubation (30 min for Hoechst-N3, 4 h for Cy-N3), the medium was washed using Dulbecco's Phosphate Buffered Saline (DPBS) two times, and then the cells were observed using a confocal laser scanning microscope.Imaging of alteration of hypoxic status using mitochondrial uncoupler stimuli
A549 cells were incubated with 5 μM of Hoechst-N3 and 1 μM Cy-N3 for 30 min under aerobic conditions. Then, 1 μM of valinomycin (1% DMSO) solution were added to the cells and additionally incubated for 2 h. The images of the cells before or after treatment with valinomycin was taken after wash of the cells by DPBS.Recording of oxygen status of the cells
A459 cells were cultured at hypoxic (0.3%) and aerobic (21%) conditions for 24 h. After washing with DPBS, these cells were initially incubated with 5 μM of Hoechst-N3 for 15 min and washed again with DPBS. Subsequently, 1 μM Cy-N3 was added to the cells, and the resulting cells incubated further under hypoxic and aerobic conditions for 30 min. For an alternate change of cellular oxygen concentration, the medium with 0.3% O2 conditions was replaced by the medium with 21% O2 conditions. On the other hand, the cells with reduced oxygen levels were created by replacing the aerobic medium with a hypoxic medium. The medium for imaging hypoxic cells (0.3% O2) was prepared by standing in the hypoxic chamber for 1 day. Finally, these cells were washed with DPBS and subjected to a confocal laser scanning microscopy.Conflicts of interest
There are no conflicts to declare.Acknowledgements
This work was supported in part by fund for research unit in Aoyama Gakuin University Research Institute (for K. T.) and Grant-in-Aid for Scientific Research (for K. T. Grant number 23H02086, 21H02059).Notes and references
- T. L. Place, F. E. Domann and A. J. Case, Free Radical Biol. Med., 2017, 113, 311–322 CrossRef CAS PubMed.
- M. Radisic, J. Malda, E. Epping, W. Geng, R. Langer and G. Vunjak-Novakovic, Biotechnol. Bioeng., 2006, 93, 332–343 CrossRef CAS PubMed.
- V. K. C. Ponnaluri, J. P. Maciejewski and M. Mukherji, Biochem. Biophys. Res. Commun., 2013, 436, 115–120 CrossRef CAS PubMed.
- A. Rakotomalala, A. Escande, A. Furlan, S. Meignan and E. Lartigau, Front. Endocrinol., 2021, 12, 742215 CrossRef PubMed.
- B. Muz, P. de la Puente, F. Azab and A. K. Azab, Hypoxia, 2015, 3, 83–92 CrossRef PubMed.
- K. Begg and M. Tavassoli, Cell Death Discovery, 2020, 6, 77 CrossRef CAS PubMed.
- K. G. Brurberg, M. Thuen, E.-B. M. Ruud and E. K. Rofstad, Radiat. Res., 2006, 165, 16–25 CrossRef CAS PubMed.
- D. M. Brizel, R. K. Dodge, R. W. Clough and M. W. Dewhirst, Radiother. Oncol., 1999, 53, 113–117 CrossRef CAS PubMed.
- M. W. Dewhirst, Radiat. Res., 2009, 172, 653–665 CrossRef CAS PubMed.
- N.-E. Choi, J.-Y. Lee, E.-C. Park, J.-H. Lee and J. Lee, Molecules, 2021, 26, 217 CrossRef CAS PubMed.
- T. Yoshihara, S. Murayama, T. Masuda, T. Kikuchi, K. Yoshida, M. Hosaka and S. Tobita, J. Photochem. Photobiol., A, 2015, 299, 172–182 CrossRef CAS.
- S. P.-Y. Li, T. S.-M. Tang, K. S.-M. Yiu and K. K.-W. Lo, Chem.–Eur. J., 2012, 18, 13342–13354 CrossRef CAS PubMed.
- B. Wang, Y. Liang, H. Dong, T. Tan, B. Zhan, J. Cheng, K. K.-W. Lo, Y. W. Lam and S. H. Cheng, ChemBioChem, 2012, 13, 2729–2737 CrossRef CAS PubMed.
- V.-N. Nguyen and H. Li, Molecules, 2023, 15, 6650 CrossRef PubMed.
- D. Hara, Y. Umehara, A. Son, W. Asahi, S. Misu, R. Kurihara, T. Kondo and K. Tanabe, ChemBioChem, 2018, 19, 956–962 CrossRef CAS PubMed.
- A. Son, A. Kawasaki, D. Hara, T. Ito and K. Tanabe, Chem.–Eur. J., 2015, 21, 2527–2536 CrossRef CAS PubMed.
- V. S. Hughes, J. M. Wiggins and D. W. Siemann, Br. J. Radiol., 2019, 92, 20170955 Search PubMed.
- J. Sun, Z. Liu, H. Yao, H. Zhang, M. Zheng, N. Shen, J. Cheng, Z. Tang and X. Chen, Adv. Mater., 2023, 35, 2207733 CrossRef CAS PubMed.
- L. J. O'Connor, I. N. Mistry, S. L. Collins, L. K. Folkes, G. Brown, S. J. Conway and E. M. Hammond, ACS Cent. Sci., 2017, 3, 20–30 CrossRef PubMed.
- A. Herner, G. E. Girona, I. Nikić, M. Kállay, A. Edward, E. A. Lemke and P. Kele, Bioconjugate Chem., 2014, 25, 1370–1374 CrossRef CAS PubMed.
- A. Nakamura, K. Takigawa, Y. Kurishita, K. Kuwata, M. Ishida, Y. Shimoda, I. Hamachi and S. Tsukiji, Chem. Commun., 2014, 50, 6149–6152 RSC.
- A. R. Nödling, E. M. Mills, X. Li, D. Cardella, E. J. Sayers, S.-H. Wu, A. T. Jones, L. Y. Luk and Y. H. Tsai, Chem. Commun., 2020, 56, 4672–4675 RSC.
- K. Wiederholt, S. B. Rajur, J. Giuliano Jr, M. J. O'Donnell and L. W. McLaughlin, J. Am. Chem. Soc., 1996, 118, 7055–7062 CrossRef CAS.
- T. Ma, J. Zheng, T. Zhang and D. Xing, Nanoscale, 2018, 10, 13462–13470 RSC.
- W. A. Denny, Pharmaceuticals, 2022, 15, 187 CrossRef CAS PubMed.
- R. D. Braun, J. L. Lanzen and M. W. Dewhirst, Am. J. Physiol., 1999, 277, H551–H568 CAS.
- H. Yasui, S. Matsumoto, N. Devasahayam, J. P. Munasinghe, R. Choudhuri, K. Saito, S. Subramanian, J. B. Mitchell and M. C. Krishna, Cancer Res., 2010, 70, 6427–6436 CrossRef CAS PubMed.
Footnote |
| † Electronic supplementary information (ESI) available: Additional experimental procedures; emission images of HCT116 and HEK293 cells in the presence of Hoechst-N3 and Cy-N3; the images of the cells upon deoxygenation; NMR spectra of new compounds. See DOI: https://doi.org/10.1039/d4ra01625d |
| This journal is © The Royal Society of Chemistry 2024 |


