 Open Access Article
Surface-enhanced Raman spectroscopy for the study of interaction of an antibacterial agent ([bis(1,3-dipentyl-1H-imidazol-2(3H)-ylidene)silver(I)]bromide) with Bacillus subtilis bacterial biofilms†
Sana Nadeem‡
a,
Saima Aziz‡a,
Haq Nawaz *a,
Muhammad Irfan Majeed
 *a,
Abeer Ahmed Alghamdi*b,
Muhammad Shahidc,
Muhammad Adnan Iqbal
 a,
Shaista Manahala,
Nimra Rehmana,
Ayesha Anwera,
Nida Ghafoora and
Muhammad Imran
 d
d
aDepartment of Chemistry, University of Agriculture Faisalabad, Faisalabad (38000), Pakistan. E-mail: haqchemist@yahoo.com; irfan.majeed@uaf.edu.pk
bDepartment of Physics, College of Science, Princess Nourah bint Abdulrahman University, P. O. Box 84428, Riyadh 11671, Saudi Arabia. E-mail: abaalghamdi@pnu.edu.sa
cDepartment of Biochemistry, University of Agriculture Faisalabad, Faisalabad (38000), Pakistan
dDepartment of Chemistry, Faculty of Science, King Khalid University, P. O. Box 9004, Abha (61413), Saudi Arabia
First published on 29th May 2024
Abstract
Bacterial resistance towards antibiotics is a significant challenge for public health, and surface-enhanced Raman spectroscopy (SERS) has great potential to be a promising technique to provide detailed information about the effect of antibiotics against biofilms. SERS is employed to check the antibacterial potential of a lab synthesized drug ([bis(1,3-dipentyl-1H-imidazol-2(3H)-ylidene)silver(I)] bromide) against Bacillus subtilis and to analyze various SERS spectral features of unexposed and exposed Bacillus strains by observing biochemical changes in DNA, protein, lipid and carbohydrate contents induced by the lab synthesized imidazole derivative. Further, PCA and PLS-DA are employed to differentiate the SERS features. PCA was employed to differentiate the biochemical contents of unexposed and exposed Bacillus strains in the form of clusters of their representative SERS spectra and is also helpful in the pairwise comparison of two spectral data sets. PLS-DA provides authentic information to discriminate different unexposed and exposed Bacillus strains with 91% specificity, 93% sensitivity and 97% accuracy. SERS can be employed to characterize the complex and heterogeneous system of biofilms and to check the changes in spectral features of Bacillus strains by exposure to the lab synthesized imidazole derivative.
1. Introduction
In the environment, bacteria exist abundantly everywhere including our bodies. The majority of bacterial species are essential to maintaining our health and the proper functioning of the ecosystem. However, some bacterial species are pathogenic and cause infections by the formation of biofilms.1 Biofilms are formed by microorganisms and characterized as complex and heterogeneous systems. Microorganisms mostly form biofilms for their protection in both stress and stress-free environments.2 A biofilm matrix consists of extracellular polymeric substances (EPS) that are released by bacteria.3 EPS consist of polysaccharides, lipids, proteins, genetic materials and humus-like substances.4 Microorganisms irreversibly attach to surfaces due to EPS,5 which is helpful to develop biofilms and their protection from harsh environmental conditions such as application of antibiotics.6As a biofilm is formed on a surface, it stimulates cells to form micro colonies. The connections among the micro colonies lead to the exchange of various nutrients, wastes and quorum sensing signal molecules from the biofilm.7 Infections are caused due to the inherent ability of bacteria that is related to the biofilm formation.8 Bacillus subtilis, a Gram positive bacterium, is considered extremely harmful and is responsible for causing pneumonia, endocarditis, ophthalmitis and anthrax diseases by forming biofilms.9 Microorganisms that are accumulated within biofilms become more powerful and their resistance to antibiotic agents is increased by 1000 times.10,11 Bacterial resistance towards antibiotics is a significant problem for public health and leads to 1.8 million deaths every year.12 Pathogenic bacterial infections due to antibiotic-resistant bacteria have become a worldwide healthcare problem. Thus, in clinical applications, it is particularly desirable to achieve a sensitive and accurate method that can improve pathogen detection and antibiotic susceptibility testing.13 Along with an accurate method, it is also essential to develop antibiotic agents with various modes of action to control this problem.14 Derivatives of imidazole are extensively used as anticancerous, antifungal and antibiotic agents.15,16 To develop new antibacterial agents, the characterization of antibacterial activity of different drugs by different techniques is necessary and helpful.17,18
To determine the growth of microorganisms in biofilms and check the activity of antibiotics against biofilms, several techniques have been developed over the years.19 Different regular tests such as phenotypic and serological tests, fatty acid detection, protein analysis, nucleic acid identification, examination methods and staining techniques are mostly employed for biofilm analysis.14 These techniques can provide authentic information but these are time-consuming, require rigorous sample preparation and costly consumables.20,21
Other microscopic techniques such as confocal laser scanning microscopy (CLSM), scanning electron microscopy (SEM), transmission electron microscopy (TEM), and atomic force microscopy (AFM) and spectroscopic techniques such as mass spectroscopy (MS), and infrared spectroscopy (IR) are also employed for the characterization and analysis of biofilms.10 In the case of CLSM, staining of whole EPS is very complicated and it requires a special procedure that limits the performance of CLSM.22 SEM and TEM require dehydrated samples. The natural structure of the biofilm is destroyed during the dehydration, which creates artifacts.18 It limits the application of SEM and TEM in the characterization of topography and internal structure of biofilms, respectively.23 However, AFM takes too much time when its tip scans the heterogeneous portions of the biofilm due to its low scanning rate.24 MS has high cost and requires expert personnel. IR spectroscopy is also good technique to get molecular level information but since it is water sensitive and therefore has limited spatial resolution which also limits its application for smaller samples.25
Raman spectroscopy has the potential to characterize the biofilm non-destructively and provide biochemical information about it.26 Inelastic scattering of light occurs by the interaction of photons with a molecule and provides the Raman spectrum which is known as a fingerprint for that molecule.2 Unlike IR spectroscopy, the major advantage of Raman spectroscopy related to biological samples is low interference from water.27 Notably, Raman spectroscopy provides weak signals for spectral acquisition of biomolecules and requires longer time and laser light with high power, which can damage the sample.2,28
In surface-enhanced Raman spectroscopy (SERS), self-assembled functional nanomaterials with electromagnetic hot spots are essential and highly desired29 and Raman signals get enhanced up to 1015 fold. In recent years, SERS has become an efficient analytical tool and has been applied to overcome the drawbacks related to Raman spectroscopy by keeping the sample in close proximity to the rough surface of the metallic nano-surface.30 The SERS technique has been employed for various applications including disease diagnosis, evaluation of antifungal activity of lab synthesized drugs and analysis of various pharmaceutical formulations, etc. SERS is known as an advanced technique due to its non-destructive nature for characterization of biological samples chemically by using silver as the SERS substrate, which plays a vital role in SERS specificity and accuracy.31 It is beneficial due to its shorter analysis time and higher sensitivity as compared to Raman spectroscopy due to which it can be used to identify the effect of antibiotics on the biofilm without damaging the sample.32
In this study, the SERS technique by using silver nanoparticles as the SERS substrate has been employed along with multivariate analysis techniques such as principle component analysis (PCA) and partial least squares discriminant analysis (PLSDA) to characterize the antibacterial potential of different concentrations of an imidazole derivative as an antibiotic agent against Bacillus subtilis biofilms.
2. Materials and methods
2.1. Synthesis of the imidazole derivative
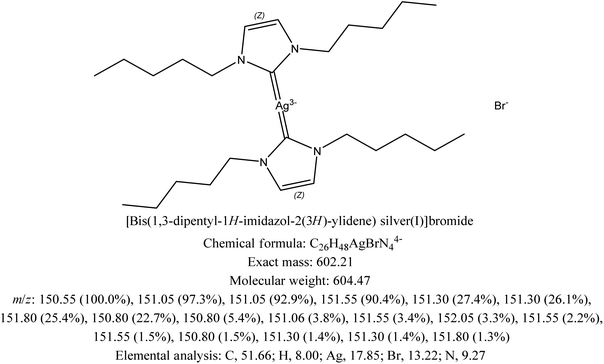
In order to analyze the antibacterial activity of the drug and to characterize the biochemical changes caused in the Bacillus subtilis biofilm with increased concentrations of the antibacterial drug candidate, a derivative of imidazole is synthesized. Characterization of the lab synthesized imidazole derivative ([bis(1,3-dipentyl-1H-imidazol-2(3H)-ylidene)silver(I)] bromide) by NMR has been reported.2.2. Bacterial culture and antibacterial screening
The antibacterial potential of the lab synthesized imidazole derivative ([bis(1,3-dipentyl-1H-imidazol-2(3H)-ylidene)silver(I)]bromide) is analyzed against Bacillus subtilis biofilm. To pre-culture the Bacillus subtilis bacteria, 2.1 g Mueller Hinton broth is added into the flask and marked up to 100 ml by adding distilled water, which is then incubated in an autoclave at 121 °C and 15 atmospheric pressure. After 15 min, the flask is allowed to cool and 1 ml of broth is added into each well of the ELISA plate. Different concentrations of the lab synthesized imidazole derivative including 31.25%, 62.15%, 125%, 250%, and 500% with 100 μl of each are added into each well of the ELISA plate except one which is used as the control. At 37 °C, the ELISA plate is then incubated for 18 hours to allow the growth of the Bacillus subtilis biofilm.2.3. Synthesis of silver nanoparticles
The chemical reduction method is adopted to prepare the silver nanoparticles. This method uses silver nitrate (AgNO3) and trisodium citrate (Na3C6H5O7) as a precursor and reducing agent, respectively. In 500 ml deionized water, 0.085 g of AgNO3 is added and heated at 100 °C, followed by the addition of 0.025 g of trisodium citrate. The solution is heated on a hot plate with the use of a magnetic stirrer for an hour until grey colored silver nanoparticles (Ag NPs) are obtained which will be employed as the SERS substrate.SEM and TEM are being employed to characterize the Ag NPs by using a field emission electron microscope. Sample preparation in TEM is carried out by the evaporation of little amount of Ag NP solution onto a copper grid having an additional coating of carbon while the sample preparation of SEM is carried out by depositing the dry Ag NPs on a copper grid without an additional coating of any conductive layer.
2.4. SERS spectral acquisition
For the measurements in SERS, a Raman spectrometer (PeakSeeker Pro 785, Agiltron, USA) is employed for recording the SERS spectra. For this purpose, a 785 nm diode laser with 50 mW power is used. For spectral acquisition, 40 μl of both samples and the same volume of Ag NPs are mixed in an Eppendorf tube and incubated for 30 min to develop interaction significantly between the biofilm and Ag NPs. After 30 min, about 40 μl sample from the incubation mixture is taken from the Eppendorf tube with a micropipette and deposited on the groove of an aluminum slide for spectral acquisition. In this way, 15 spectra for each sample are recorded in the spectral range of 250 to 1600 cm−1 with a 40× objective lens and 10 seconds integration time.2.5. SERS spectral data pre-processing
Raw SERS spectral data of the biofilm samples provides valuable information but it also includes undesired components such as baseline, substrate contribution and noise, which may disturb the spectral information. To obtain valuable information about the sample, pre-processing of raw spectral data is very necessary. Pre-processing of spectral data, which includes the baseline correction, smoothing, substrate removal and vector normalization, is carried out by using MATLAB 7.8. The Savitzky–Golay method is employed for the purpose of smoothing, while the rubber band correction algorithm is employed for the purpose of baseline correction.2.6. SERS spectral data analysis
After completion of spectral pre-processing, analysis of processed data is carried out by comparing each spectrum of biofilms, which includes the unexposed Bacillus subtilis and Bacillus subtilis exposed to different concentrations of the lab synthesized imidazole derivative including 31.25%, 62.15%, 125%, 250% and 500%. Principal component analysis (PCA) is employed to check the variability among the SERS spectra of different biofilm samples. PCA loading is employed to investigate the cause of this differentiation. The SERS spectral features of the Bacillus subtilis biofilm in the form of peaks are assigned in Table S1.† For the class wise discrimination between spectral data, partial least squares discriminant analysis (PLS-DA) is also employed.3. Results and discussion
3.1. SERS spectrum of the lab synthesized imidazole derivative
([bis(1,3-dipentyl-1H-imidazol-2(3H)-ylidene) silver(i)]bromide) is shown in Fig. 1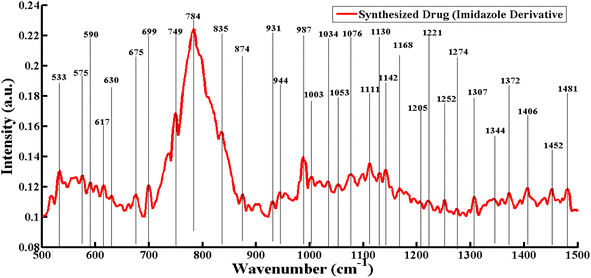 | ||
| Fig. 1 SERS spectrum of the lab synthesized imidazole derivative ([bis(1,3-dipentyl-1H-imidazol-2(3H)-ylidene) silver(I)]bromide). | ||
3.2. Mean SERS spectra of exposed and unexposed biofilms
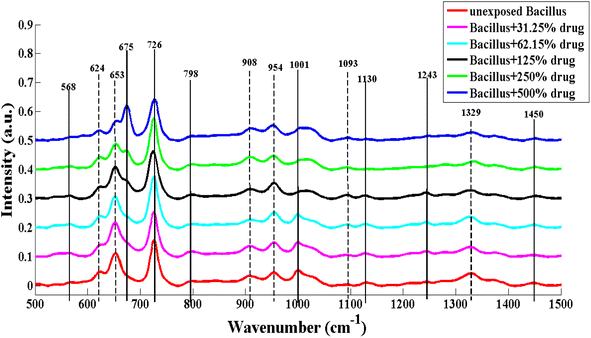
After the pre-processing of SERS spectra, the mean of the SERS spectra of each sample having fifteen spectra is obtained. Mean SERS spectra of unexposed Bacillus subtilis and Bacillus subtilis exposed to different concentrations of the lab synthesized drug (imidazole derivative) are shown in Fig. 2.The characteristic SERS features of exposed and unexposed Bacillus subtilis biofilms are represented by vertical lines, which are associated with protein, carbohydrates, lipids and DNA, and are listed in Table S1.† The variations in SERS peaks that are associated to biochemical changes induced in Bacillus Subtilis biofilm are enlisted in Table S2.†
Solid lines represent the SERS features that are observed in the spectra of unexposed or exposed Bacillus subtilis and dashed lines are employed to indicate the intensity based differences. The variations in the SERS peaks are due to changes in the cell wall and plasmid of Bacillus subtilis because the cell wall of bacteria has biomolecules which provide a specific SERS spectrum. The SERS peak observed at 1329 cm−1 (C–H vibration) in unexposed Bacillus subtilis is related to protein, which decreases in intensity after the exposure to the antibacterial agent. This decrease indicates the conformational changes occurring in protein molecules present in the biofilm.33 The SERS peaks at 1001 cm−1 (ring breathing mode),34 1130 cm−1 (C–N stretching)34,35 and 1243 cm−1 (amide III)34 are also associated with proteins, present in the unexposed Bacillus biofilm SERS spectrum but absent in exposed Bacillus subtilis biofilm SERS spectra as the concentration of drug exposure increased. These characteristic features indicate the denaturation of proteins leading to cell death.31 The SERS peak at 1093 cm−1 (C–C stretching) of lipids is observed with an increase in intensity, which suggests that the concentration of saturated fatty acids is enhanced in the cell wall of Bacillus subtilis due to high level of environmental stress after exposure to the antibiotic.36 The biofilm responds to stress by increasing the lipid synthesis.37
The prominent SERS peak at 653 cm−1 (polydeoxyadenosine ring's vibration) related to DNA is reduced in intensity as the concentration of the lab synthesized drug is increased. This decrease is due to the destruction of nucleic acid of bacteria causing bacterial cell death.23 Raman peaks at 568 cm−1 (hypoxanthine (DNA)),38 and 798 cm−1 (ring stretching and breathing mode of uracil (nucleic acid))39 are related to DNA, present in the SERS spectra of unexposed Bacillus subtilis biofilm and Bacillus subtilis biofilm exposed to various concentrations of the lab synthesized drug (imidazole derivative). The intensities of carbohydrate bands observed at 624 cm−1 (aromatic ring skeleton (carbohydrate)),40 908 cm−1 (C–O–C stretching of glycosidic linkage in saccharides)35 and 954 cm−1 (C–N stretching of polyene chain in carbohydrate)35 slightly decreased with the exposure of the lab synthesized drug, showing changes in the carbohydrate contents.
3.3. Principal component analysis (PCA) of SERS spectral data of exposed and unexposed biofilms
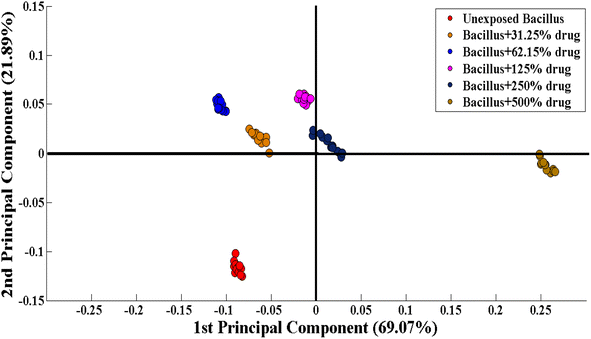
Principal component analysis (PCA) is an unsupervised approach for dimensionality reduction and identifying the underlying structure of the data. PCA loadings show the contribution of each spectral data point to the variance in the data. PCA helps in the clustering and identification of patterns within the data. PCA reduces the Raman spectral data into smaller data sets (principal components) to explain the variability within datasets. Principal Component Analysis (PCA) is employed to analyze the SERS spectral data, which decreases the variable factors but keeps prominent variation within the spectral data. In this study, PCA was carried out to examine the differentiation within the preprocessed SERS spectra of unexposed Bacillus subtilis biofilm and Bacillus subtilis biofilm samples exposed to various concentrations of the imidazole derivative (lab synthesized drug). The PCA scatter plot indicates the biochemical differences induced by the exposure to the antibacterial agent.Fig. 3 shows the differentiation between SERS spectral data in the form of clusters including the SERS spectra of unexposed Bacillus subtilis (red) and Bacillus subtilis exposed to different concentrations (31.25% (orange), 62.15% (blue), 125% (purple), 250% (black) and 500% (brown)) of the lab synthesized drug.
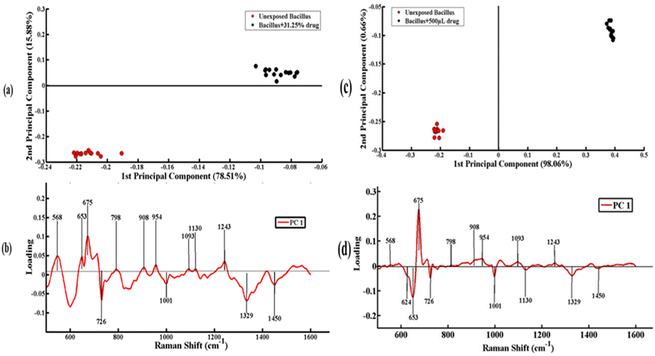
Fig. 4(a) depicts the comparison between the SERS spectra of unexposed Bacillus subtilis biofilm and Bacillus subtilis biofilm samples exposed to 31.25% concentration of the lab synthesized drug. SERS data related to unexposed Bacillus subtilis are represented as a cluster of red dots, while those of the Bacillus subtilis biofilm exposed to 31.25% concentration of the lab synthesized drug are represented as a cluster of black dots. PC-1 shows the first highest variability among the SERS spectral data. PC-1 indicates the linear combination of the variables of SERS spectral data. If a dataset consists of n features, PC-1 is given by
| PC-1 = w11 × X1 + w12 × X2 + … + w1n × Xn |
PC-2 shows the second highest variability among SERS spectral data sets. PC-2 also indicates the linear combination of variables and is uncorrelated with PC-1. If the dataset has n features, PC-2 is given by
| PC-2 = w21 × X1 + w22 × X2 + … + w2n × Xn |
![[double bond, length as m-dash]](https://www.rsc.org/images/entities/char_e001.gif) O stretching (amide III)) are associated with the unexposed Bacillus subtilis biofilm. The negative loadings including 726 cm−1 (glycosidic ring mode of adenine (DNA)), 1001 cm−1 (breathing mode of symmetric ring (protein)), 1329 cm−1 (C–H vibration (protein)) and 1450 cm−1 (CH2 vibration (lipids)) are associated with the Bacillus subtilis biofilm treated with 31.25% concentration of the lab synthesized drug.
O stretching (amide III)) are associated with the unexposed Bacillus subtilis biofilm. The negative loadings including 726 cm−1 (glycosidic ring mode of adenine (DNA)), 1001 cm−1 (breathing mode of symmetric ring (protein)), 1329 cm−1 (C–H vibration (protein)) and 1450 cm−1 (CH2 vibration (lipids)) are associated with the Bacillus subtilis biofilm treated with 31.25% concentration of the lab synthesized drug.
Fig. 4(c) indicates the pairwise comparison of SERS spectral data of unexposed Bacillus subtilis biofilm (a cluster of red dots) and Bacillus subtilis biofilm (cluster of black dots) exposed to 500% concentration of the lab synthesized drug. Differentiation between these two groups of SERS spectra indicates the significant biochemical changes in Bacillus subtilis caused by the application of the lab synthesized drug candidate. The variability explained by PC-1 represented on the X-axis is 98.06%, while the variability explained by PC-2 represented on the Y-axis is 0.66%.
In Fig. 4(d), positive side of the loadings indicates the characteristic SERS features of unexposed Bacillus subtilis biofilm including 568 cm−1 (hypoxanthine (DNA)), 675 cm−1 (guanosine (DNA)), 798 cm−1 (ring stretching and breathing mode of uracil (nucleic acid)), 908 cm−1 (C–O–C stretching of glycosidic linkage (saccharides)), 954 cm−1 (C–N stretching of polyene chain in carbohydrate), 1093 cm−1 (C–C gauchi stretching (membrane lipid)), and 1243 cm−1 (C![[double bond, length as m-dash]](https://www.rsc.org/images/entities/char_e001.gif) O stretching (amide III)). The characteristic SERS features related to the Bacillus subtilis biofilm exposed to 500% concentration of the lab synthesized drug are represented on the negative side of loadings including 624 cm−1 (aromatic ring skeleton (carbohydrates)), 653 cm−1 (ring vibration in polydeoxyadenosine (DNA)), 726 cm−1 (glycosidic ring mode of adenine (DNA)), 1001 cm−1 (breathing mode of symmetric ring (protein)), 1130 cm−1 (C–N stretching (proteins)), 1329 cm−1 (C–H vibration (protein)) and 1450 cm−1 (CH2 vibration (lipids)).
O stretching (amide III)). The characteristic SERS features related to the Bacillus subtilis biofilm exposed to 500% concentration of the lab synthesized drug are represented on the negative side of loadings including 624 cm−1 (aromatic ring skeleton (carbohydrates)), 653 cm−1 (ring vibration in polydeoxyadenosine (DNA)), 726 cm−1 (glycosidic ring mode of adenine (DNA)), 1001 cm−1 (breathing mode of symmetric ring (protein)), 1130 cm−1 (C–N stretching (proteins)), 1329 cm−1 (C–H vibration (protein)) and 1450 cm−1 (CH2 vibration (lipids)).
3.4. Partial least squares discriminant analysis (PLS-DA) of SERS spectral data of exposed and unexposed biofilms
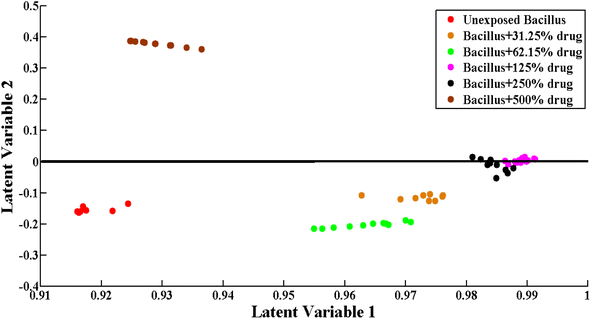
PLS-DA, a supervised chemometric tool, is performed to discriminate the SERS spectral data quantitatively. PLS-DA is a quantitative approach and it is employed to differentiate various data such as unexposed and exposed Bacillus strains. It is used to identify the latent variables that are employed to achieve the prominent separation of SERS data. Statistical analysis of SERS data can also be achieved by PLS-DA. It can help to understand the differences that may not appear from PCA alone. In short, PLS-DA provides information about the variance in the dataset as well as differentiation in the name classes such as “exposed” and “unexposed” Bacillus strains, resulting in better accuracy and reliability of the results. Although prominent differentiation among the SERS dataset can be achieved by PCA, the reason to employ PLS-DA is its ability to focus on grouping information of SERS data, while PCA just focuses to get information about the maximum variance in the dataset. Hence, PLS-DA is considered more effective than PCA.SERS spectral data including the unexposed and exposed Bacillus subtilis biofilms are individually split into a 60% calibration set and 40% validation set to discriminate the data with reliability and accuracy. In the PLS-DA model, cross-validation (CV) is performed to identify the five latent variables. Fig. 5 depicts the PLS-DA scores, and the model discriminates the SERS data of unexposed and exposed Bacillus subtilis biofilms with 93% sensitivity and 91% specificity.
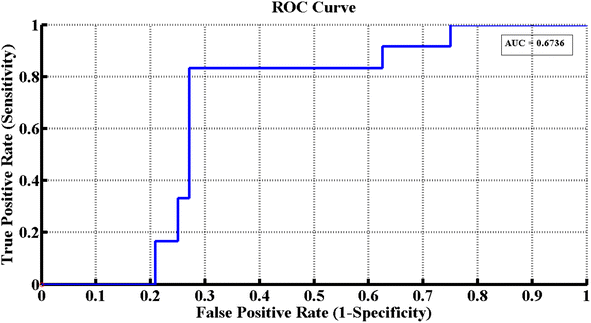
Fig. 6 depicts the receiver operating characteristic (ROC) curve of the PLS-DA model, which indicates the SERS data of unexposed and exposed Bacillus subtilis biofilms and a value of 0.6736 of the ROC curve is obtained. The range of this value for the PLS-DA model is 0 to 1 and a value near to 1 shows the maximum validation and accuracy, while a value closer to zero depicts poor performance of the model. It is concluded that the PLS-DA model discriminates the SERS spectral data sets clearly. Using SERS spectral data in the PLS-DA model, excellent performance is obtained to discriminate the unexposed and exposed Bacillus subtilis biofilms.
4. Conclusion
SERS can be considered a promising technique for the characterization of the complex and heterogeneous system of biofilms of bacteria due to its increased sensitivity by employing silver nanoparticles as the SERS substrate. SERS spectral features in the mean spectral plot have shown the intensity based differences among the unexposed Bacillus subtilis biofilm and Bacillus subtilis biofilm exposed to different concentrations of the lab synthesized antibacterial agent, which clearly indicates the potential of SERS to determine the antibacterial activity of this imidazole derivative. These differences are associated with biochemical changes taking place in the extracellular polymeric substances (EPS) of biofilms, including macromolecules like carbohydrate, DNA, lipids and proteins. Moreover, SERS spectral features are also further differentiated by multivariate data analysis tools such as PCA and PLS-DA. PCA is employed to differentiate the SERS spectra of unexposed and exposed Bacillus subtilis biofilms in the form of clusters and is also helpful in pairwise comparison of two spectral data sets. PLS-DA is employed to discriminate the different unexposed and exposed bacterial biofilms with 91% specificity, 93% sensitivity and 97% accuracy. This study may be further helpful to use this methodology of SERS to identify the antibacterial potential of any lab synthesized antibacterial agent and to characterize biofilms.Conflicts of interest
The authors have no known competing financial interests or personal relationships that could have appeared to influence the work reported in this paper.Acknowledgements
The authors express their gratitude to Princess Nourah bint Abdulrahman University Researchers Supporting Project number (PNURSP2024R451), Princess Nourah bint Abdulrahman University, Riyadh, Saudi Arabia. The authors express appreciation to the Deanship of Scientific Research at King Khalid University, Saudi Arabia, for funding this work through a research group program under grant number RGP-2/164/45.References
- A. B. Beyene, W.-N. Su, H.-C. Tsai, W. A. Tegegne, C.-H. Chen, C.-C. Huang, D. Mares, V. Prajzler, W.-H. Huang and B. J. Hwang, ACS Appl. Nano Mater., 2022, 5, 11567–11576 CrossRef CAS.
- Y. Chao and T. Zhang, Anal. Bioanal. Chem., 2012, 404, 1465–1475 CrossRef CAS.
- P. Scavone, V. Iribarnegaray, A. L. Caetano, G. Schlapp, S. HÃrtel and P. Zunino, Pathog. Dis., 2016, 74, ftw033 CrossRef PubMed.
- P. Sun, C. Hui, S. Wang, L. Wan, X. Zhang and Y. Zhao, Colloids Surf., B, 2016, 139, 164–170 CrossRef CAS.
- M. C. Cortizo and M. Fernández Lorenzo de Mele, World J. Microbiol. Biotechnol., 2003, 19, 805–810 CrossRef.
- N. P. Ivleva, M. Wagner, A. Szkola, H. Horn, R. Niessner and C. Haisch, J. Phys. Chem. B, 2010, 114, 10184–10194 CrossRef CAS PubMed.
- A. Heydorn, B. Ersbøll, J. Kato, M. Hentzer, M. R. Parsek, T. Tolker-Nielsen, M. Givskov and S. Molin, Appl. Environ. Microbiol., 2002, 68, 2008–2017 CrossRef CAS PubMed.
- J. W. Costerton, Z. Lewandowski, D. E. Caldwell, D. R. Korber and H. M. Lappin-Scott, Annu. Rev. Microbiol., 1995, 49, 711–745 CrossRef CAS PubMed.
- R. M. Donlan, Clin. Infect. Dis., 2001, 33, 1387–1392 CrossRef CAS.
- M. Cottat, C. D'andrea, R. Yasukuni, N. Malashikhina, R. Grinyte, N. Lidgi-Guigui, B. Fazio, A. Sutton, O. Oudar and N. Charnaux, J. Phys. Chem. C, 2015, 119, 15532–15540 CrossRef CAS.
- M. C. Sportelli, C. Kranz, B. Mizaikoff and N. Cioffi, Anal. Chim. Acta, 2022, 339433 CrossRef CAS.
- A. Ditta, M. I. Majeed, H. Nawaz, M. A. Iqbal, N. Rashid, M. Abubakar, F. Akhtar, A. Nawaz, W. Hameed and M. Iqbal, Photodiagn. Photodyn. Ther., 2022, 39, 102941 CrossRef CAS PubMed.
- L. Bi, X. Wang, X. Cao, L. Liu, C. Bai, Q. Zheng, J. Choo and L. Chen, Talanta, 2020, 220, 121397 CrossRef CAS.
- J. W. Costerton, R. Irvin and K. Cheng, Annu. Rev. Microbiol., 1981, 35, 299–324 CrossRef CAS PubMed.
- K. K. Jefferson, FEMS Microbiol. Lett., 2004, 236, 163–173 CrossRef CAS.
- C. M. Eberle, D. Winsemius and R. A. Garibaldi, J. Gerontol., 1993, 48, M266–M271 CrossRef CAS PubMed.
- D. B. Kearns and R. Losick, Mol. Microbiol., 2003, 49, 581–590 CrossRef CAS.
- L. N. Mueller, J. F. De Brouwer, J. S. Almeida, L. J. Stal and J. B. Xavier, BMC Ecol., 2006, 6, 1–15 CrossRef.
- P. N. Rather, Environ. Microbiol., 2005, 7, 1065–1073 CrossRef CAS.
- E. Efeoglu and M. Culha, Spectroscopy, 2013, 28, 36–41 Search PubMed.
- C. Sandt, T. Smith-Palmer, J. Pink, L. Brennan and D. Pink, J. Appl. Microbiol., 2007, 103, 1808–1820 CrossRef CAS PubMed.
- X. Lu, D. R. Samuelson, B. A. Rasco and M. E. Konkel, J. Antimicrob. Chemother., 2012, 67, 1915–1926 CrossRef CAS PubMed.
- G. B. Jung, S. W. Nam, S. Choi, G.-J. Lee and H.-K. Park, Biomed. Opt. Express, 2014, 5, 3238–3251 CrossRef PubMed.
- E. Smith and G. Dent, Modern Raman Spectroscopy: A Practical Approach, John Wiley & Sons, 2019 Search PubMed.
- S. M. Jacobsen and M. E. Shirtliff, Virulence, 2011, 2, 460–465 CrossRef.
- L. He, Y. Liu, M. Lin, A. Mustapha and Y. Wang, Sensing and Instrumentation for Food Quality and Safety, 2008, 2(4), 247–253 CrossRef.
- E. Efeoglu and M. Culha, Appl. Spectrosc., 2013, 67, 498–505 CrossRef CAS PubMed.
- S. Keleştemur, E. Avci and M. Çulha, Chemosensors, 2018, 6, 5 CrossRef.
- L. Bi, H. Zhang, W. Hu, J. Chen, Y. Wu, H. Chen, B. Li, Z. Zhang, J. Choo and L. Chen, Biosens. Bioelectron., 2023, 237, 115519 CrossRef CAS PubMed.
- J. Ojeda, M. Romero-Gonzalez, H. Pouran and S. Banwart, Mineral. Mag., 2008, 72, 101–106 CrossRef CAS.
- N. Mehmood, M. W. Akram, M. I. Majeed, H. Nawaz, M. A. Aslam, A. Naman, M. Wasim, U. Ghaffar, A. Kamran and S. Nadeem, RSC Adv., 2024, 14, 5425–5434 RSC.
- D. Vaitiekūnaitė and V. Snitka, Microorganisms, 2021, 9, 1969 CrossRef PubMed.
- C. Bollen, L. Dewachter and J. Michiels, Front. Mol. Biosci., 2021, 8, 669664 CrossRef CAS.
- K. C. Schuster, I. Reese, E. Urlaub, J. R. Gapes and B. Lendl, Anal. Chem., 2000, 72, 5529–5534 CrossRef CAS PubMed.
- M. Saleem, M. I. Majeed, H. Nawaz, M. A. Iqbal, A. Hassan, N. Rashid, M. Tahir, A. Raza, H. M. ul Hassan and A. Sabir, Anal. Lett., 2022, 55, 2132–2146 CrossRef CAS.
- P. Wang, S. Pang, H. Zhang, M. Fan and L. He, Anal. Bioanal. Chem., 2016, 408, 933–941 CrossRef CAS.
- J. Kim and Y.-W. Chin, Pharmaceutics, 2023, 15, 1937 CrossRef CAS PubMed.
- D. Yang, H. Zhou, N. E. Dina and C. Haisch, R. Soc. Open Sci., 2018, 5, 180955 CrossRef PubMed.
- R. M. Jarvis, A. Brooker and R. Goodacre, Anal. Chem., 2004, 76, 5198–5202 CrossRef CAS PubMed.
- A. ul Haq, M. I. Majeed, H. Nawaz, N. Rashid, M. R. Javed, M. A. Iqbal, A. Raza, S. T. Zahra, L. Meraj and A. Perveen, Photodiagn. Photodyn. Ther., 2023, 42, 103533 CrossRef.
Footnotes |
| † Electronic supplementary information (ESI) available. See DOI: https://doi.org/10.1039/d4ra02047b |
| ‡ First two authors have equal contribution. |
| This journal is © The Royal Society of Chemistry 2024 |

