 Open Access Article
Site-targeted decoration of palladium nanocrystals for catalytic CH4 removal in lean-burn exhaust†
Takashi Hihara *ab,
Makoto Nagata*a,
Takeshi Fujita
 *c and
Hideki Abe
 *bd
*bd
aRD Center, N.E. CHEMCAT Corporation, Numazu, Shizuoka, Japan. E-mail: takashi.hihara@ne-chemcat.co.jp; Fax: +81-55-966-9606; Tel: +81-55-966-9605
bGraduate School of Science and Technology, Saitama University, Shimo-Okubo, Japan
cKohchi University of Technology, Kami, Kochi, Japan
dNational Institution of Material & Substances, Tsukuba, Ibaraki, Japan
First published on 29th May 2024
Abstract
Site-targeted decoration of catalytic nanocrystals is essential for maximizing performance with minimal materials use. Here, we demonstrate successful, site-targeted decoration of palladium (Pd) nanocrystals with nickel (Ni) exclusively along crystal facet edges through the thermal decomposition of nickel carbonyl (Ni(CO)4) vapor. Strong interactions between carbon monoxide and Pd facet for passivation or between Ni(CO)4 and crystal facet edges resulted in selective Ni decoration at the nanocrystal edges. The Ni-decorated Pd nanocrystals exhibit superior catalytic performance for methane (CH4) removal in an oxygen-rich lean-burn exhaust atmosphere, requiring 10 times less Ni decoration than conventional Pd–Ni composite catalysts prepared by the wet impregnation method. The site-targeted decoration of nanocrystals introduced in this work offers an efficient and resource-minimizing strategy for enhanced catalytic applications.
1. Introduction
The increasing threat of climate change has elevated the demand for advanced catalysts to reduce greenhouse gas (GHG) emissions from industries, transportation, and daily life.1 It is recognized that the performance of catalysts is significantly improved by decorating the active center with heteroatoms.2,3 The edges and apexes of nanocrystals often serve as an active center of catalysis more than the facets.4,5 Indeed, skeletal nanocrystals comprised solely of edges and apexes demonstrated superior catalytic activity compared to their filled counterparts.6 Site-targeted decoration of the edges and apexes of catalytic nanocrystals can be a rational strategy to maximize catalytic performances while minimizing the use of hetero-materials.Nickel (Ni)-decorated palladium (Pd) nanocrystals exhibit outstanding performance in catalytic removal of one of the major GHGs, methane (CH4), from lean-burn engine exhaust via an oxidative route (CH4 + 3O2 = CO2 + 2H2O),3,7–9 while preventing materials degradation by H2O vapor contained in the exhaust.10–14 The GHG-removal catalysts comprising Pd nanocrystals are commonly produced at the industrial scale by the impregnation method.15 This method may materialize the desired Ni-decorated Pd nanocrystals, by mixing oxide-supported Pd nanocrystals with Ni precursors in solvent, followed by drying and calcination. Although simple and scalable, this approach leads to the random dispersion of heteroatoms across Pd nanocrystals and support surfaces, requiring an excessive amount of Ni material to achieve the desired decoration effect.16 However, the use of Ni poses challenges, including limited production, unevenly distributed mines, and inherent environmental toxicity.17 The need to minimize Ni addition to the Pd nanocrystal catalyst system is imperative but presents a challenge with conventional impregnation methods.
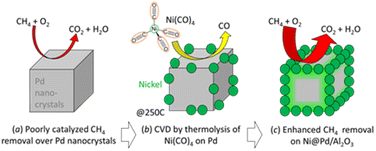
Here, we report that alumina (Al2O3)-supported Pd nanocrystals can be decorated with Ni heteroatoms exclusively at the edges and apexes of the nanocrystals through the pyrolysis of nickel carbonyl (Ni(CO)4) vapor, resulting in a Ni@Pd/Al2O3 catalyst (Scheme 1). Passivation of Pd crystal facets by carbon monoxide (CO) molecules or Pd crystal edges as active sites for Ni(CO)4 pyrolysis enables the site-targeted decoration at the edges and apexes. Due to the site-targeted and effective Ni decoration, the Ni@Pd/Al2O3 catalyst exhibits competitive activity for CH4 removal from the simulated lean-burn exhaust, with an order of magnitude lower Ni decoration compared to the Ni-decorated Pd catalysts that are prepared by the conventional impregnation method. The approach presented in this paper achieves optimal performance of nanocrystal catalysts with minimized use of hetero-materials, contributing to diverse applications, including the catalytic mitigation of GHG emissions.
 | ||
| Scheme 1 Site-targeted decoration with Ni on the edges and apexes of Pd nanocrystals for improved catalytic removal of CH4. | ||
2. Experimental
2.1 Preparation of Al2O3-supported Pd catalysts
Alumina-supported palladium catalysts (Pd/Al2O3) were prepared by the conventional method of wetness incipient impregnation. Palladium nitrate (Pd(NO3)2), aqueous solution was used as the precursor and loaded at 3 wt% as Pd on Al2O3 powder (Puralox TH130/130 from Sasol). After drying in air at 100 °C for 3 hours and calcination at 550 °C for 1 hour, Pd/Al2O3 was obtained, denoted as AS (As-synthesized)-Pd/Al2O3 hereafter. Palladium oxide (PdO) was observed in the X-ray diffractometry (XRD) peak of AS-Pd/Al2O3 (Fig. S1†) and the crystal size was calculated as 6.8 nm (Table S1†).To enhance Pd crystal growth, a 10 hour heat treatment preceded Ni decoration on AS-Pd/Al2O3. Following a preliminary study on Pd crystal size (S1 in the ESI with Fig. S1–S4 and Tables S1–S5†), we chose 850 °C as the pre-treatment temperature by taking both the degree of intentional growth of Pd crystals using sintering by the pre-treatment and its effect on activity into consideration. Henceforth, the AS-Pd/Al2O3 powder treated at 850 °C for 10 hours was referred to as Pd/Al2O3. The crystal size of PdO in Pd/Al2O3 was calculated at about 11 nm from XRD (Table S1†).
2.2 Ni decoration to Pd/Al2O3
We adopted two methods to decorate Pd/Al2O3 with Ni. One was a chemical vapor deposition (CVD) method using pyrolysis of Ni(CO)4 which has been reported to scale up the production of special products involving nickel.18,19 The other was the wet impregnation (WI) method using nickel(II) acetate tetrahydrate (Ni(CH3COO)2·4H2O: NiAc, KANTO CHEMICAL Co. Inc.) aqueous solution. These methods are denoted hereafter as CVD and WI, respectively. Details are described in ESI.†In CVD, a cordierite honeycomb was coated with Ni powder (Aldrich), yielding a Ni-loaded honeycomb. A 3/8′′ stainless steel tube held the 0.3 g Pd/Al2O3 powder between 0.1 g glass wool and the Ni-coated honeycomb. The temperature program of CVD, the setting position of the 3/8′′ stainless steel tube and samples filled in it in relation to the electric furnace position were shown in Fig. S5.† Subsequent treatments in the electric furnace included hydrogen treatments at 250 °C for 20 minutes on Ni and Pd/Al2O3 under 9.1% H2/Ar flow. CO feed gas reacted with Ni powder heated to 55–170 °C (Fig. S6†), forming Ni(CO)4 vapor. Downstream, Ni(CO)4 decomposed on Pd/Al2O3 at 250 °C for 1, 6, 20, and 100 hours. The resulting sample was labelled X_Ni@Pd/Al2O3 (X = 1, 6, 20, and 100) based on the duration of thermal decomposition.
As a comparison of CVD, Ni was decorated on Pd/Al2O3 in the WI method. NiAc was used as a Ni precursor. After the impregnation of Pd/Al2O3 into 10 wt% NiAc aqueous solution, the mixture was dried at 100 °C and then calcined at 550 °C for 1 hour. Ni content was quantified by inductively coupled plasma atomic emission spectroscopy (ICP-AES). Samples with 1300 and 17![[thin space (1/6-em)]](https://www.rsc.org/images/entities/char_2009.gif) 400 wt ppm Ni decoration were obtained.
400 wt ppm Ni decoration were obtained.
2.3 Materials characterization
The prepared materials were characterized with a scanning transmission electron microscope (STEM, JEOL JEM-ARM200F). The sample powder was dispersed over a copper (Cu) grid mesh for STEM observations. Elemental mapping images were acquired with an energy-dispersive X-ray spectroscope (EDS) equipped with STEM. We also carried out the other analysis, namely ICP-AES to quantify the content of Ni and Pd, X-ray diffractometry (XRD) to calculate the crystal size of Pd, CO pulse experiment to evaluate the average diameter of Pd crystals, and the image analysis on STEM observation images to obtain Pd particle size distribution. Details are described in ESI.†2.4 Catalytic performance test for CH4 removal
The catalytic performance of the prepared materials for CH4 removal from simulated lean-burn exhaust was evaluated using a mass flow-controllable system (BELCAT-A, Microtrac BEL Co.) as we reported previously.20 An aliquot of 50 mg of catalyst powder was placed in a glass sample tube, sandwiched between glass wool. The sample temperature was raised from room temperature up to 600 °C at a ramping rate of 20 °C min−1 and lowered down to 40 °C, always in a stream of a mixed gas containing 0.1% CH4, 2% H2O and 8% O2, respectively. The gas stream was balanced with pure helium (He) to adjust the flow to 300 mL min−1. The outlet gas from the sample tube was introduced to the FTIR (DATABIRD FAST-1200NE, IWATA DENGYO Co., Ltd.) to quantify the gas composition.2.5 CO-TPD
The CO Temperature Programmed Desorption (CO-TPD) was performed in BELCAT-A equipped with BELMass quadrupole mass spectrometer from Microtrack BEL. In this experiment, 50 mg of catalyst powder sandwiched with glass wool was placed in a glass tube. The sample was heated under a mixed gas flow of 5% argon (Ar) and balanced He from room temperature to 600 °C at a rate of 20 °C min−1, followed by cooling to 80 °C. For CO adsorption, a 1% CO mixture with 5% Ar and balanced He was introduced at 80 °C for 60 min, followed by 5% Ar and balanced He for 30 min. The temperature was then raised to 600 °C at 20 °C min−1, and the released gas was monitored every second with a mass spectrometer. Data normalization involved using the detection signal of m/z = 40 corresponding to 5% Ar, introduced as an internal standard. The 10 second average of the 1 second data was calculated for subsequent discussion.3. Results and discussions
3.1 Ni decoration to Pd/Al2O3 by CVD
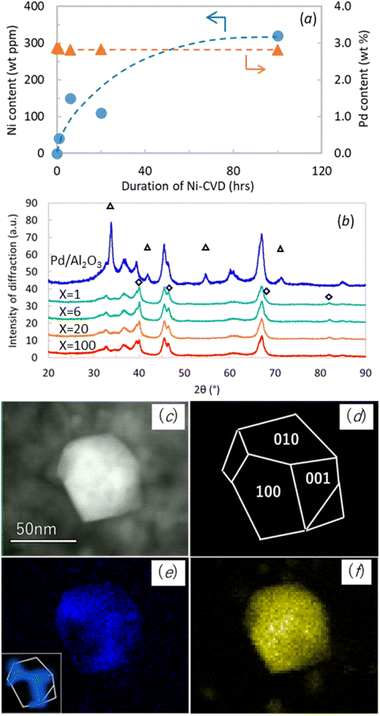
Ni and Pd contents in Pd/Al2O3 and Ni@Pd/Al2O3 samples were quantified by ICP, and the results are presented in Fig. 1a. The Ni content was 40, 150, 110, and 320 wt ppm in the duration of Ni-CVD X = 1, 6, 20 and 100 hours respectively. Despite expectations, the Ni content in 20_Ni@Pd/Al2O3 was lower than 6_Ni@Pd/Al2O3. We assumed that this is due to lot-to-lot variation in sample position during processing, resulting in lot-to-lot variation in processing temperature. The Pd content remained at approximately 3 wt% across all samples.The XRD pattern for Pd/Al2O3 and Ni@Pd/Al2O3 samples were shown in Fig. 1b to confirm the influence of Ni-CVD on Pd crystal size. Diffraction peaks of PdO were observed in Pd/Al2O3 and that of Pd metal were observed in all Ni@Pd/Al2O3 samples. Crystal size of Pd metal which was detected at 2θ = 82° was calculated as 14 nm, 13 nm, 11 nm and 12 nm in the duration of Ni-CVD X = 1, 6, 20 and 100 hours respectively. Pd crystal size was almost equivalent before and after Ni-CVD.
STEM-EDS analysis was conducted to verify the distribution of Ni on Ni decorated Pd/Al2O3 samples prepared by both CVD and WI methods. In WI samples, Ni was dispersed on both Pd crystals and Al2O3, as confirmed by STEM-EDS (Fig. S7 and S8†). However, in Ni@Pd/Al2O3, Ni was detected only on Pd nanocrystals, primarily decorated on the edge part of the polyhedral crystal. As shown in the STEM image (Fig. 1c) and the EDS mapping of Pd (Fig. 1f), most of the Pd crystals were polyhedral. The polyhedral Pd nanocrystal consisted of (100), (010), and (001) facets as shown in (Fig. 1d). The EDS mapping demonstrates that the polyhedral Pd nanocrystal was decorated mostly at the edges and apexes with Ni (Fig. 1e). Similar observations were made for 20_Ni@Pd/Al2O3 and 6_Ni@Pd/Al2O3, but the Ni intensity in the EDS spectra was too low to confirm Ni on the Pd nanocrystals (Fig. S9 and S10†).
We conducted Ni-CVD treatment for 100 hours on AS-Pd/Al2O3 also to confirm the veracity of site-targeted nickel decoration. Fig. S11 and S12† showed STEM-EDS images of it observed at different magnifications. As in 100_Ni@AS-Pd/Al2O3, nickel was distributed on Pd nanocrystals (Fig. S11†) and was decorated near the edges of the polyhedral palladium nanocrystals, which resembled octahedrons (Fig. S12†). This is additional characterization data to support the site-targeted decoration of Ni on Pd nanocrystal.
3.2 Catalytic performance of Ni-decorated Pd/Al2O3
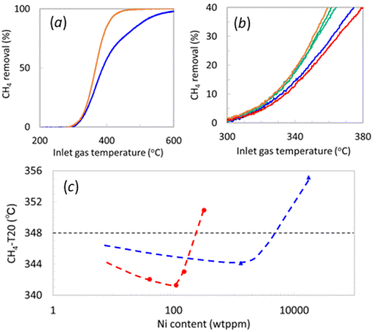
We conducted catalytic performance tests for CH4 removal with Ni-decorated Pd/Al2O3 samples prepared by both the CVD and WI methods to elucidate the catalytic impact of the Ni decoration. Fig. 2a illustrates the catalytic CH4 removal by Pd/Al2O3 and 20_Ni@Pd/Al2O3 from simulated lean-burn exhaust, demonstrating that Ni decoration enhances CH4 removal at lower temperatures. Fig. 2b focuses on the CH4 removal curves of Ni@Pd/Al2O3 in the temperature range of 300 °C to 380 °C. The temperature at which CH4 removal reached 20% (CH4-T20) is summarized in Fig. 2c, with the logarithm of Ni content on the horizontal axis, as the region of relatively low CH4 removal provides insight into the differences in the catalytic active site.The CH4-T20 of Pd/Al2O3 was 348 °C, while 1_Ni@Pd/Al2O3, 6_Ni@Pd/Al2O3, 20_Ni@Pd/Al2O3 each of which contained 40, 150, 110 ppm Ni, exhibited lower CH4-T20 at 342 °C, 341 °C, and 343 °C, respectively. However, 100_Ni@Pd/Al2O3, with 320 wt ppm Ni, showed a higher CH4-T20 at 351 °C, surpassing Pd/Al2O3. The improvement in CH4-T20 with Ni addition may result from mitigating Pd(OH)2 formation, known to be inactive for CH4 oxidation.10–14 The deterioration at higher Ni decoration could be attributed to reduced exposed Pd atoms at the edges or fewer sites where CH4 can interact with both Pd and Ni.
CH4 removal tests for the Pd/Al2O3 materials that were decorated by WI at 1300 and 17![[thin space (1/6-em)]](https://www.rsc.org/images/entities/char_2009.gif) 400 wt ppm Ni yielded CH4-T20 of 344 °C and 355 °C, respectively, with similar reasons for improvement and degradation as in CVD samples. Comparing the impact of Ni content on CH4-T20 between different decoration methods, CVD exhibited effects at lower contents than WI. Notably, improvement in CH4-T20 was observed at a Ni content of around 1/10. Considering STEM-EDS observations, it is inferred that the sites near the edges of Pd crystals, amenable to Ni decoration by CVD, serve as active sites with a significant contribution to CH4 removal.
400 wt ppm Ni yielded CH4-T20 of 344 °C and 355 °C, respectively, with similar reasons for improvement and degradation as in CVD samples. Comparing the impact of Ni content on CH4-T20 between different decoration methods, CVD exhibited effects at lower contents than WI. Notably, improvement in CH4-T20 was observed at a Ni content of around 1/10. Considering STEM-EDS observations, it is inferred that the sites near the edges of Pd crystals, amenable to Ni decoration by CVD, serve as active sites with a significant contribution to CH4 removal.
The Pd and Ni contents in AS-Pd/Al2O3 with Ni decoration by CVD and WI and the results of CH4 removal tests are shown in Table S7 and Fig. S13.† The effect of site-targeted decoration on AS-Pd/Al2O3 was similar to its effect on Pd/Al2O3. The reduction of CH4-T20 by Ni decoration was similar for Ni-CVD and WI, but the amount of Ni required was about 1/10 of that for CVD compared to WI. This is additional experimental data to support the achievement of optimal performance of nanocrystal catalysts with minimized use of hetero-materials.
3.3 Mechanism of site-targeted decoration
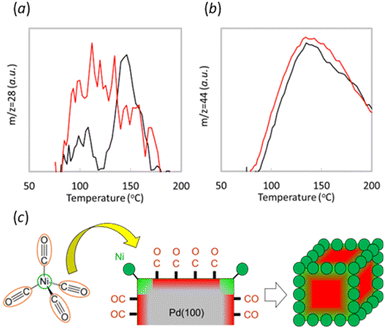
CO-TPD was conducted on both 100_Ni@Pd/Al2O3 and Pd/Al2O3 without Ni to shed light to the mechanism of site-targeted Ni decoration at the edge of Pd crystals by CVD (Fig. 3). During the ramping step, desorption of CO (m/z = 28, Fig. 3a) and CO2 (m/z = 44, Fig. 3b) was observed. Notably, the 100_Ni@Pd/Al2O3 sample exhibited CO desorption at a lower temperature than the sample without Ni, indicating stronger CO adsorption on Pd than on Ni or Ni-decorated Pd. Similarly, the CVD sample showed CO2 desorption at a lower temperature, to the reaction of CO with oxygen which interacted with Pd during the desorption process. These results suggest that the role of CO in the Ni decoration process on the edges of Pd crystals using thermal decomposition of Ni(CO)4 could be to passivate the other Pd crystal surface except for edges sites where Ni was decorated by CVD. An image of this process was shown in Fig. 3c. Strong interaction between CO and the other Pd sites except for decorated with Ni by CVD could enable the site-targeted decoration of Ni onto the edge of the Pd crystals.Another possible mechanism is that the edge site could be also the active site in the pyrolysis of nickel carbonyl. The reduced amount of desorbed CO around 150 °C could be interpreted also due to Ni decoration. In this interpretation case, the desorbed peak at 150 °C could be attributed to the edges part of the Pd crystal. The interpretation is consistent with previous literature,21,22 which also reported that CO adsorbs more strongly on coordinatively unsaturated sites than on terrace sites. If it is assumed that CO adsorption affects the Ni decoration position during the CVD process, the strong adsorption of CO on edge sites leads to Ni decoration on Pd crystals other than at the edges. However, the experimental fact is that Ni was decorated on the edges, so the assumption is not valid, and the interaction of CO and Pd during CVD is considered without affecting the location of Ni decoration. A possible mechanism in this case is that nickel carbonyl strongly interacts with coordinatively unsaturated sites of the Pd crystal, e.g., edges, and pyrolyzes at these sites, resulting in site-aimed nickel decoration at the edges as shown in Scheme 1b.
4. Conclusions
The study successfully demonstrated site-targeted decoration of Pd nanocrystals with Ni through pyrolysis of Ni(CO)4 vapor, a CVD process with reported cases of scale-up. We proposed two possible mechanisms leading to site-targeted Ni decoration on the edge and apexes of polyhedral nanocrystals of Pd to yield Ni@Pd/Al2O3 catalysts. One is CO passivation on Pd nanocrystal facets by CO, and the other is that the nanocrystal facet edges are also active sites for pyrolysis due to their strong interaction with nickel carbonyls. The Ni@Pd/Al2O3 catalyst exhibited competitive performances for CH4 removal from the simulated lean-burn exhaust, with 1/10 amount of Ni decoration compared to the conventional Ni-decorated Pd catalysts prepared by the impregnation method. This work opens up a route for high-performance nanocrystal catalysts at minimized decoration with hetero-materials, contributing to different catalytic applications, including reduced GHG emissions.Author contributions
T. Hihara designed the study, carried out catalyst preparation, Ni-CVD treatment, characterizations, and CH4 removal performance tests, data curation of all data, and wrote the original manuscript. M. Nagata supervised the project. T. Fujita carried out STEM-EDS. H. Abe designed the study, edited the manuscript, and supervised the project.Conflicts of interest
There are no conflicts to declare.Acknowledgements
The authors thank Mr Yasuyuki Banno for the discussion. We also thank colleagues in R&D center of N.E. CHEMCAT for machine operations of CH4 removal test, CO-TPD and also for characterizations of ICP-AES, XRD, STEM observation and image analysis. We also acknowledge the financial support from N.E. CHEMCAT.References
- Y. Wang, Y. Tian, S.-Y. Pan and S. W. Snyder, ChemSusChem, 2022, 15, e202201290 CrossRef CAS PubMed.
- Q. Fu, W.-X. Li, Y. Yao, H. Liu, H.-Y. Su, D. Ma, X.-K. Gu, L. Chen, Z. Wang, H. Zhang, B. Wang and X. Bao, Science, 2010, 328, 1141 CrossRef CAS PubMed.
- J. J. Wilis, E. D. Goodman, L. Wu, A. R. Riscoe, P. Martins, C. J. Tassone and M. Cargnello, J. Am. Chem. Soc., 2017, 139, 11989 CrossRef PubMed.
- G. A. Somorjai and J. Carrazza, Ind. Eng. Chem. Fundam., 1986, 25(1), 63 CrossRef CAS.
- H. Mistry, F. Behafarid, E. Zhou, L. K. Ono, L. Zhang and B. R. Cuenya, ACS Catal., 2014, 4, 109 CrossRef CAS.
- C. Chen, Y. Kang, Z. Huo, Z. Zhu, W. Huang, H. L. Xin, J. D. Snyder, D. Li, J. A. Herron, M. Mavrikakis, M. Chi, K. L. More, Y. Li, N. M. Markovic, G. A. Somorjai, P. Yang and V. R. Stamenkovic, Science, 2014, 343, 1339 CrossRef CAS PubMed.
- H. Widjaja, K. Sekizawa, K. Eguchi and H. Arai, Catal. Today, 1999, 47, 95 CrossRef CAS.
- J. Shen, R. E. Hayes, X. Wu and N. Semagina, ACS Catal., 2015, 5, 2916 CrossRef CAS.
- X. Zou, Z. Rui and H. Ji, ACS Catal., 2017, 7, 1615 CrossRef CAS.
- R. Burch, F. J. Urbano and P. K. Loader, Appl. Catal., A, 1995, 123, 173 CrossRef CAS.
- K. Persson, L. D. Pfefferle, W. Schwartz, A. Ersson and S. G. Jarås, Appl. Catal., B, 2007, 74, 242 CrossRef CAS.
- W. Barrett, J. Shen, Y. Hu, R. E. Hayes, R. W. J. Scott and N. Semagina, ChemCatChem, 2020, 12, 944 CrossRef CAS.
- P. Velin, F. Hemmingsson, A. Schaefer, M. Skoglundh, K. A. Lomachenko, A. Raj, D. Thompsett, G. Smedler and P.-A. Carlsson, ChemCatChem, 2021, 13, 3765 CrossRef CAS.
- A. Boucly, L. Artiglia, M. Roger, M. Zabilskiy, A. Beck, D. Ferri and J. A. van Bokhoven, Appl. Surf. Sci., 2022, 606, 154927 CrossRef CAS.
- A. C. Bueno, M. Mayer, M. Weber, M. Bechelany, M. Klotz and D. Farrusseng, Catalysts, 2019, 8, 577 CrossRef.
- K. Persson, A. Ersson, K. Jansson, N. Iverlund and S. Jaras, J. Catal., 2005, 231, 139 CrossRef CAS.
- P. Dilshara, B. Abeysinghe, R. Premasiri, N. Dushyantha, N. Ratnayake, S. Senarath, A. S. Ratnayake and N. Batapola, J. Asian Earth Sci., 2024, 259, 105912 CrossRef.
- P. Vladimir, B. Steve, Z. Alexandre, S. Jun, S. Faranak and N. William, J. Nanosci. Nanotechnol., 2008, 8(8), 4049 CrossRef PubMed.
- L. Mond, C. Langer and F. Quincke, J. Chem. Soc., Trans., 1890, 57, 749 RSC.
- T. Hihara, Y. Banno, M. Nagata, T. Fujita and H. Abe, Catal. Sci. Technol., 2023, 13, 5842 RSC.
- I. V. Yudanov, R. Sahnoun, K. M. Neyman and N. Rosch, J. Phys. Chem. B, 2003, 107, 255 CrossRef CAS.
- D. G. Oh, H. A. Aleksandrov, H. Kim, I. Z. Koleva, K. Khivantsev, G. N. Vayssilov and J. H. Kwak, Chem.–Eur. J., 2022, 28, e202200684 CrossRef.
Footnote |
| † Electronic supplementary information (ESI) available. See DOI: https://doi.org/10.1039/d4ra02237h |
| This journal is © The Royal Society of Chemistry 2024 |


