DOI:
10.1039/D4RA03111C
(Paper)
RSC Adv., 2024,
14, 29665-29674
Crystal structure modification of nano-hydroxyapatite using organic modifiers and hydrothermal technique
Received
26th April 2024
, Accepted 30th August 2024
First published on 18th September 2024
Abstract
Hydroxyapatite (HAp) synthesis was achieved through a hydrothermal method involving orthophosphoric acid and calcium hydroxide. Different organic modifiers such as urea, naphthalene, and palmitic acid were applied in the reaction system to modify the crystallite size along with the morphology of HAp. The synthesized HAp was validated via X-ray diffraction (XRD) data, Fourier Transform Infrared (FTIR) spectra, Field Emission Scanning Electron Microscopy (FESEM) image, and optical bandgap energy (<6 eV) was determined through UV-vis spectrophotometry. Apart from that, different techniques such as Scherrer's method, Halder–Wagner model, Williamson–Hall method, size–strain plot, as well as Sahadat-Scherrrer's models were applied for calculating the crystal domain size, and some models also incorporated energy density, strain, and stress. The synthesized HAp has a crystal structure that falls within the permissible range of <100 nm, as established by analyzing the XRD data using established models. Nevertheless, the values for strain (from −0.0006 to 0.0062), stress (from −30![[thin space (1/6-em)]](https://www.rsc.org/images/entities/char_2009.gif) 902 to 36
902 to 36![[thin space (1/6-em)]](https://www.rsc.org/images/entities/char_2009.gif) 940 N m−2), as well as energy density (from 4 × 10⁻¹⁴ to 113.72 J m−3) were likewise computed for the synthesized HAp. The texture co-efficient analysis reveals that doped HAp is grown in the (202) and (112) planes, palmitic acid_HAp in (002), (112), and (202) planes, while all the synthesized HAp (pure HAp, urea, naphthalene) is grown in the (002) and (112) planes. Rietveld refinement was also performed to estimate the quantative phase percentage from XRD data.
940 N m−2), as well as energy density (from 4 × 10⁻¹⁴ to 113.72 J m−3) were likewise computed for the synthesized HAp. The texture co-efficient analysis reveals that doped HAp is grown in the (202) and (112) planes, palmitic acid_HAp in (002), (112), and (202) planes, while all the synthesized HAp (pure HAp, urea, naphthalene) is grown in the (002) and (112) planes. Rietveld refinement was also performed to estimate the quantative phase percentage from XRD data.
Introduction
Hydroxyapatite (HAp) is a naturally occurring phosphate of calcium found in hard tissues, comprising 70% of tooth dentin, 60% of bones, and 97% of tooth enamel.1,2 Researchers are exploring synthetic biomaterials to repair or replace damaged organs or bones, addressing the struggles in the medical field to find suitable materials with appropriate bioactivity, biocompatibility, and physiological properties. They are exploring the fruitful applications of HAp in biomedical sectors as well as environmental fields, altering raw materials such as calcium and phosphate sources.3 The characteristics of HAp, such as morphology as well as size, significantly influence its applications. For instance, HAp whiskers can serve as reinforcement phases, enhancing the mechanical characteristic and reliability of HAp ceramics.4 HAp can be synthesized by numerous methods, including (1) dry methods such as mechanochemical4 and solid-state5 and (2) wet methods such as chemical precipitation,6 emulsion,7 sol–gel,8 hydrolysis, as well as the hydrothermal method.9 However, all these synthesis approaches have typical difficulties such as agglomeration, extended reaction periods, unpredictable particle size, as well as non-stoichiometric substances.10 Despite the multiplicity of synthesis techniques, the hydrothermal approach provides a unique method of influencing the crystal shape by applying high temperature and pressure.11 Numerous studies have utilized hydrothermal methods to synthesize one-dimensional HAp, including platelets, tubes, whiskers, and ribbons, with some reports incorporating organic modifiers,12 offering enormous benefits and additional advantages. This research addresses the potential of organic modifiers as well as hydrothermal methods for forming hydroxyapatite nanostructures, a strategy that differs from prior literature that focuses on the hydrothermal technique alone. Promoting the hydrothermal synthesis of HAp involves using urea, palmitic acid, and naphthalene as organic modifiers. Urea acts as a mineralizer, promoting nanorods and nanobundles. Palmitic acid, a surfactant, limits the growth and size distribution by adsorbing onto HAp crystals. Naphthalene forms pore-forming structures with high surface area and volume. Decomposition during hydrothermal processes may increase HAp's biological activity and drug transport capabilities.13,14 The initial stage of HAp formation involves a complex mechanism, with amorphous calcium phosphate formed as a transient phase using orthophosphate acid/salt as the PO43− precursor.
ACP is then subsequently converted into several phases, including HAp, octacalcium phosphate (OCP), tricalcium phosphate (TCP), as well as dibasic calcium phosphate dihydrate (DCPD). In this present study, HAp nanocrystal was synthesized employing the hydrothermal method along with different organic modifiers such as urea, naphthalene, and palmitic acid to modify the crystallite size as well as the morphology of HAp. Furthermore, crystallite size computation is achieved using various equations and models, including Scherrer's model, size–strain plot, Halder–Wagner model, Sahadat-Scherrer's model, and Williamson–Hall plot.15 These methods are easy to apply and can predict strain, energy density, and stress from the XRD data, making it a valuable tool for analyzing crystallite size. The synthesized HAp was also characterized through scanning electron microscopy (SEM), Fourier transform infrared spectroscopy (FTIR) as well as UV-vis-spectroscopy.
Materials and methods
Materials
Calcium hydroxide (Ca (OH)2) (96%), along with phosphoric acid (H3PO4) (85%), were employed as potential sources for Ca2+ and PO43−, respectively, to execute this experiment. Additionally, numerous organic modifiers such as urea (CH4N2O) (99%), naphthalene (C10H8) (99%), palmitic acid (C16H32O2) (98%), as well as externally synthesized HAp (C10(PO4)6(OH)2) were employed to modify the morphology of the synthesized HAp nanocrystals. These chemical reagents were purchased from E-Merck, Germany. Apart from that, nitric acid (HNO3) and ammonium hydroxide (NH4OH) were utilized to maintain the pH (10–11). DI water was used as a solvent throughout the whole synthesis process.
Method
Synthesis of nano HAp via the hydrothermal technique
The synthesis process of HAp nanocrystals using the hydrothermal technique is shown in Fig. 1. Firstly, a predetermined amount of Ca(OH)2 was dissolved in DI water, then H3PO4 was added into the Ca2+-containing solution from the burette to maintain a molar ratio of (Ca/P) = 10![[thin space (1/6-em)]](https://www.rsc.org/images/entities/char_2009.gif) :
:![[thin space (1/6-em)]](https://www.rsc.org/images/entities/char_2009.gif) 6. The addition of H3PO4 into this solution was done at the rate of 4 mL per min. During the synthesis process, the pH of the solution was maintained above 9 using NH4OH and/or HNO3 solution. Different organic modifiers such as urea (0.1 g), naphthalene (0.1 g), palmitic acid (0.1 g), as well as external HAp (0.1 g) were added into the reaction system, and the solution was stirred for 2 h at room temperature. Then, the solution was shifted into a 100 mL stainless-steel autoclave reactor encased in polytetrafluoroethylene (PTFE) and subjected to hydrothermal synthesis at a temperature of 180 °C for 3 h. Afterward, the resulting mixture was cooled to the ambient temperature. The precipitate was separated by passing it through a filter paper and then rinsed with deionized water. These precipitates were then subjected to the process of drying in an oven at 105 °C for 6 h.
6. The addition of H3PO4 into this solution was done at the rate of 4 mL per min. During the synthesis process, the pH of the solution was maintained above 9 using NH4OH and/or HNO3 solution. Different organic modifiers such as urea (0.1 g), naphthalene (0.1 g), palmitic acid (0.1 g), as well as external HAp (0.1 g) were added into the reaction system, and the solution was stirred for 2 h at room temperature. Then, the solution was shifted into a 100 mL stainless-steel autoclave reactor encased in polytetrafluoroethylene (PTFE) and subjected to hydrothermal synthesis at a temperature of 180 °C for 3 h. Afterward, the resulting mixture was cooled to the ambient temperature. The precipitate was separated by passing it through a filter paper and then rinsed with deionized water. These precipitates were then subjected to the process of drying in an oven at 105 °C for 6 h.
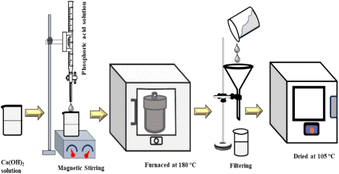 |
| | Fig. 1 Experimental procedure for hydrothermal HAp synthesis. | |
Characterization
X-ray crystallographic characterization
A Rigaku SE X-ray diffractometer was used to validate the crystalline shapes of HAp nanocrystals with the scanning range of 2θ = 10–60° and scanning step of 0.01. The radiation source, CuKα (λ = 1.54060 Å), was employed at 40 kV as well as 30 mA, with cooling temperature of 19–20 °C. The observed phases were compared to the standard JCPDS data file.
Functional groups analysis (FT-IR)
Synthetic gypsum was analyzed using an IR-Prestige 21 instrument, which had an IR spectral resolution of 4 cm−1 and operated in the transmittance mode within the 400–4000 cm−1 range. The analysis included 30 scans and used an attenuated total reflection (ATR) accessory.
Surface morphology analysis (SEM)
The surface morphology of HAp was explored employing a scanning electron microscope (model: Phenom pro), with gold sputter-coated for 30 seconds and pictures acquired at 10 kV, including powder gypsum samples suspended in ethanol.
UV-visible spectroscopic analysis
A UV-visible spectrophotometer (Hitachi U-2910) was employed to measure absorbance at 190–350 nm wavelengths, with tungsten as well as deuterium lamps utilized for UV-visible irradiation.
Results and discussion
XRD data interpretation
The patterning results from XRD for the synthesized HAp through the hydrothermal technique are unveiled in Fig. 2. The crystallographic plane positions of these synthesized HAp were visible at (002) 25.92°, (211) 31.83°, 32.24°, (300) 32.96°, (202) 34.12°, (130) 39.88°, (222) 46.75°, and (213) 49.53°. The HAp profiles were matched by the standard ICDD database (card no: #01-074-0565). From the analyzed data, several crystallographic characteristics such as lattice parameters, crystalline index, dislocation density, unit cell volume, crystallite dimensions, microstrain, as well as the degree of crystallinity were estimated utilizing eqn (1)–(7), as well as summarized in Table 1.16–18| |
 | (1) |
| |
 | (2) |
| |
 | (3) |
| |
Microstrain, ε = β/4![[thin space (1/6-em)]](https://www.rsc.org/images/entities/char_2009.gif) tan tan![[thin space (1/6-em)]](https://www.rsc.org/images/entities/char_2009.gif) θ θ
| (4) |
| |
 | (5) |
| |
 | (6) |
| |
 | (7) |
here, the unit cell is designated by plane (h, k, and l), whilst lattice parameters are represented by a, b, c. In addition, the degree of crystallinity is defined as Xc.19–21 Dislocation density, the peak height of the respective plane, and crystalline index are denoted by δ, H(hkl), CIXRD respectively. By implementing eqn (3), the specific surface area of the prepared HAp was calculated using the size of the crystallite and specific density, noted as Dc and ρ (3.16 g cm−3), respectively.22 The polycrystalline material's preferred orientation is defined by its texture coefficient, obtained from its X-ray diffraction pattern, which defines the variation in the material's crystallographic planes.23
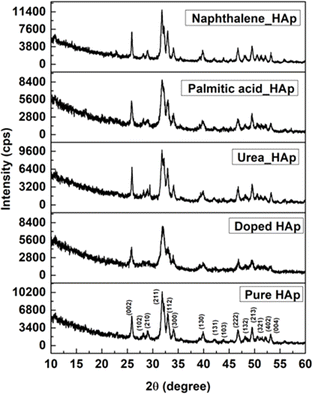 |
| | Fig. 2 X-ray diffractogram of the synthesized HAp utilizing the hydrothermal technique. | |
Table 1 Crystallographic characteristics of hydrothermally produced HAp
| Parameter |
Pure_HAp |
Doped_HAp |
Urea_HAp |
Naphthalene_HAp |
Palmitic acid_HAp |
| Lattice parameter (Å) |
a = b = 9.46 |
a = b = 9.46 |
a = b = 9.41 |
a = b = 9.42 |
a = b = 9.42 |
| c = 6.88 |
c = 6.88 |
c = 6.88 |
c = 6.88 |
c = 6.89 |
| Volume of unit cell (Å3) |
V = 534.21 |
534.79 |
528.16 |
529.62 |
529.94 |
| Degree of crystallinity |
Xc = 0.035 |
1.92 |
0.154 |
0.308 |
0.027 |
| Microstrain |
ε = 11.14 × 10⁻³ |
3.014 × 10⁻³ |
6.852 × 10⁻³ |
5.444 × 10⁻³ |
12.12 × 10⁻³ |
| Dislocation density, (1015 lines per m2) |
δ = 7.787 |
0.567 |
2.928 |
1.847 |
9.215 |
| Crystallinity index |
CIXRD = 1.446 |
1.926 |
1.784 |
1.451 |
1.633 |
| Specific surface area |
S = 0.1675 |
0.0452 |
0.10275 |
0.08160 |
0.1822 |
The texture coefficient, computed by comparing a particular peak in an XRD pattern to a reference peak, gives essential information about a material's crystallographic orientation, which may greatly affect its qualities and performance in numerous applications. Eqn (8) can be applied to calculate the texture coefficient of the synthesized HAp.
| |
 | (8) |
here, the term
I(hkl)/
Io(hkl) is the ratio of the sample relative intensity concerning the standard relative intensity and

; it is the average of relative intensity, correspondingly. The analysis shows that the texture co-efficient for hydrothermally synthesized pure HAp, urea_HAp, and naphthalene_HAp is grown in the (002) and (112) planes. Conversely, doped_HAp is grown in the (202) and (112) planes, whereas palmitic acid_HAp is grown in the (002), (112), and (202) planes, respectively.
Estimation of crystallite size using XRD models
Numerous XRD models were utilized along with Scherrer's model to estimate the crystallite dimension precisely. Additionally, versatile applicable methods such as Williamson–Hall, Halder–Wagner, and Sahadat-Scherrer are used.
Scherrer's model
Scherrer's model is the first model that showed the relationship between crystallite size (eqn (8)) and peak broadening.24,25 XRD diffraction patterns widen in the nanocrystal because of the intrinsic and crystalline size effects, which can be distinguished into two parts: instrumental broadening and physical broadening.26–28 In the following equation, the instrumental as well as crystalline size effects are not considered.| |
 | (9) |
here, Dc is identified as the size of a unit cell. Consequently, FWHM (full width at half maxima) in radian is specified as β. Shape factor or Scherrer's constant, as well as the degree of crystallinity, are identified as K = 0.90. The average crystalline size of the synthesized HAp was found to be 20 nm, 12 nm, 25 nm, 30 nm, and 25 nm for Pure HAp, Doped HAp, Urea HAp, Naphthalene HAp, as well as Palmitic acid Hap, respectively.
Williamson–Hall method
In Scherrer's method, just the impact of crystalline size on the XRD peak widening is considered, but it does not provide any indication regarding the microstructure of the lattice, which can be generated because of point defect, triple junction, stacking faults as well as grain boundary.29–31 According to this method, the sum of line broadening in the XRD diffraction pattern can be written as| | |
βtotal = βsize + βstrain
| (10) |
The slide modification in the Williamson–Hall, regarded as the UDM, USDM, and UDEDM, will be investigated in this context, where βstrain is denoted as the broadening due to strain while βsize is the widening owing to crystallite dimension.32
Uniform deformation model (UDM)
In the UDM, homogenous strain is possessed through crystallographic planes, which appears to be due to crystal imperfections. More specifically, UDM deals with isotropic strain in crystallographic analysis.33,34 The mathematical estimation of the physical widening of the XRD peaks caused by intrinsic strain effects may be determined as| |
βstrain = 4ε![[thin space (1/6-em)]](https://www.rsc.org/images/entities/char_2009.gif) tan tan![[thin space (1/6-em)]](https://www.rsc.org/images/entities/char_2009.gif) θ θ
| (11) |
where θ indicates Bragg position, and the rearrangement of eqn (9)–(11) gives| |
 | (12) |
from altering eqn (12) it gives| |
 | (13) |
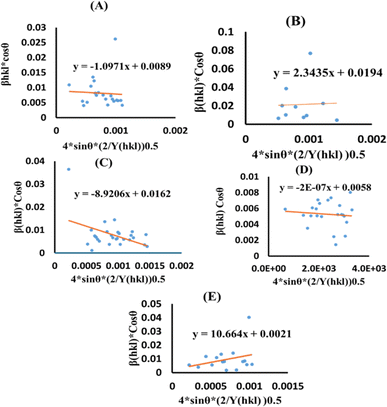
Eqn (13) is graphically illustrated in Fig. 3, with βhkl![[thin space (1/6-em)]](https://www.rsc.org/images/entities/char_2009.gif) *cos
*cos![[thin space (1/6-em)]](https://www.rsc.org/images/entities/char_2009.gif) θ and 4
θ and 4![[thin space (1/6-em)]](https://www.rsc.org/images/entities/char_2009.gif) sin
sin![[thin space (1/6-em)]](https://www.rsc.org/images/entities/char_2009.gif) θ as independent variables along the vertical as well as the horizontal axis. The slope represents the strain in HAp nanocrystals, while the intercept shows the mean particle size due to lattice contraction or expansion. This modification slightly alters the atomic arrangement and creates defects in the lattice structure, resulting in strain. The average crystallite size was obtained at 15.57, 7.14, 8.55, 23.90, and 66.02 nm for Pure HAp, Doped_HAp, Urea_HAp, Naphthalene_HAp as well as Palmitic acid_Hap, respectively. The UDM plot shows a positive slope resulting in lattice expansion, intrinsic strain in nanocrystals, and a negative magnitude, indicating compressive strain.35
θ as independent variables along the vertical as well as the horizontal axis. The slope represents the strain in HAp nanocrystals, while the intercept shows the mean particle size due to lattice contraction or expansion. This modification slightly alters the atomic arrangement and creates defects in the lattice structure, resulting in strain. The average crystallite size was obtained at 15.57, 7.14, 8.55, 23.90, and 66.02 nm for Pure HAp, Doped_HAp, Urea_HAp, Naphthalene_HAp as well as Palmitic acid_Hap, respectively. The UDM plot shows a positive slope resulting in lattice expansion, intrinsic strain in nanocrystals, and a negative magnitude, indicating compressive strain.35
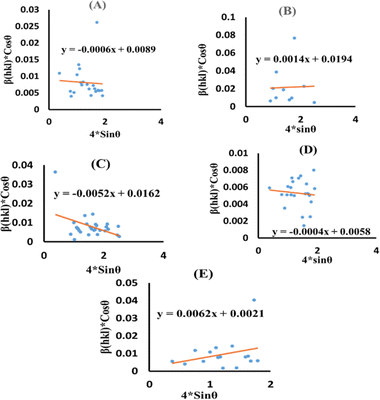 |
| | Fig. 3 UDM plot for synthesized HAp nanoparticles. (A) Pure Hap, (B) Doped_Hap, (C) Urea_Hap, (D) Naphthalene_Hap, (E) Palmitic acid_HAp. | |
Uniform stress deformation model (USDM)
The actual crystal, being anisotropic, does not match the UDM model's homogeneous and isotropic assumption. The USDM is a modified version of the Williamson–Hall equation, assuring uniform lattice deformation stress with a minimal microstrain.28,36 Hooke's law illustrates a linear connection between stress (σ) as well as strain (ε), as illustrated in eqn (14).
The equation gives a valid estimate for minimum strain, proving that Young's modulus (Yhkl) is not linear as strain increases.37 The relationship can be obtained by rearranging and substituting eqn (14) with eqn (10), which gives eqn (15).
| |
 | (15) |
Now, the graphical representation of eqn (15), βhkl![[thin space (1/6-em)]](https://www.rsc.org/images/entities/char_2009.gif) *cos
*cos![[thin space (1/6-em)]](https://www.rsc.org/images/entities/char_2009.gif) (θ) along the vertical as well as 4
(θ) along the vertical as well as 4![[thin space (1/6-em)]](https://www.rsc.org/images/entities/char_2009.gif) sin
sin![[thin space (1/6-em)]](https://www.rsc.org/images/entities/char_2009.gif) θ/Yhkl along the horizontal axis aligning to every diffraction pattern for synthesized HAp, has been visualized in Fig. 4. The crystallite dimension of the synthesized HAp was estimated by calculating σ from the linear fitting slope and extrapolation intercept. Table 2 provides the crystalline size and stress.
θ/Yhkl along the horizontal axis aligning to every diffraction pattern for synthesized HAp, has been visualized in Fig. 4. The crystallite dimension of the synthesized HAp was estimated by calculating σ from the linear fitting slope and extrapolation intercept. Table 2 provides the crystalline size and stress.
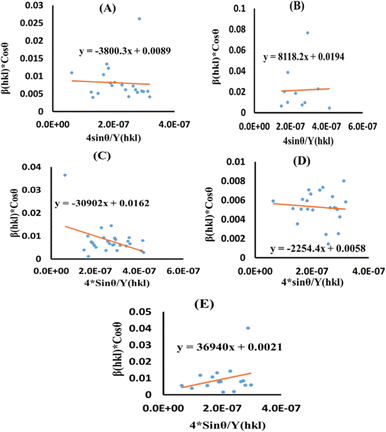 |
| | Fig. 4 USDM plot for synthesized HAp nanoparticles. (A) Pure Hap, (B) Doped_Hap, (C) Urea_HAP, (D) Naphthalene_Hap, (E) Palmitic acid_Hap. | |
Table 2 Analysis of the microstructural properties of HAp via different models
| XRD model name |
Crystallite size (nm), stress (N m−2), energy density (J m−3) |
| Pure_HAp |
Doped_HAp |
Urea_HAp |
Naphthalene_HAp |
Palmitic acid_HAp |
| Scherrer's equation |
DL = 20.915 |
12.487 |
25.408 |
30.792 |
25.21 |
| Williamson–Hall method |
UDM |
ε = −0.0006 |
ε = 0.0014 |
ε = −0.0052 |
ε = −0.0004 |
ε = 0.0062 |
| Dw = 15.57 |
Dw = 7.147 |
Dw = 8.558 |
Dw = 23.9058 |
Dw = 66.02 |
| USDM |
σ = −3800.3 |
σ = 8118.2 |
σ = −30![[thin space (1/6-em)]](https://www.rsc.org/images/entities/char_2009.gif) 902 902 |
σ = −2254.4 |
σ = 36![[thin space (1/6-em)]](https://www.rsc.org/images/entities/char_2009.gif) 940 940 |
| Dw = 15.57 |
Dw = 7.147 |
Dw = 8.558 |
Dw = 23.9058 |
Dw = 66.02 |
| UDEM |
u = 1.2036 |
u = 5.49 |
u = 79.577 |
u = 4 × 10⁻¹⁴ |
u = 113.72 |
| Dw = 15.57 |
Dw = 7.147 |
Dw = 8.558 |
Dw = 23.905 |
Dw = 66.02 |
| Size–strain plot |
Dw = 12.379 |
2.6562 |
3.7677 |
23.500 |
17.117 |
| Halder–Wagner method |
Dw = 5.43 |
3.3717 |
4.1493 |
13.5135 |
3.64 |
| Sahadat-Scherrer's model |
Ds–s = 23.5 |
17.55 |
43.329 |
39.615 |
43.32 |
Uniform deformation energy density model (UDEDM)
The UDEDM is a novel model that effectively manages the homogenous anisotropic lattice strain across all crystallographic orientations, influenced by the deformation energy density. It differs from the USDM model, which considers the crystal's isotropic nature and is characterized by defects, dislocations, and agglomerates.38 In accordance with Hooke's law, energy density (u) corresponds to strain (ε), considering the relationship.| |
 | (16) |
The UDEDM equation was constructed by restructuring eqn (16) regarding ε, then substituting it with eqn (13), resulting in eqn (17).
| |
 | (17) |
here,
eqn (17) was plotted with the term
βtotal![[thin space (1/6-em)]](https://www.rsc.org/images/entities/char_2009.gif)
cos
![[thin space (1/6-em)]](https://www.rsc.org/images/entities/char_2009.gif) θ
θ on the vertical axis and

. On the horizontal axis (
Fig. 5), the crystallite dimension, as well as the anisotropic density, were measured from the
Y-intercept as well as the slope of the mentioned equation and is listed in
Table 2.
 |
| | Fig. 5 UDEDM plot for synthesized HAp nanoparticles. (A) Pure Hap, (B) Doped_Hap, (C) Urea_HAP, (D) Naphthalene_Hap, (E) Palmitic acid_Hap. | |
Size–strain plot (SSP)
Peak widening is influenced by size as well as strain components, with the component of size described by the Lorentzian function whereas the strain-induced component is defined by the Gaussian function.32 Consequently, the broadening of SSP can mathematically be estimated as follows.
The peak widening owing to Lorentz and Gaussian functions is symbolized by βL and βG, correspondingly.
Additionally, the SSP technique gives improved results for isotropic broadening owing to its concentration on low-angle reflections, assuring greater precision as well as accuracy. Higher angles result in lower-quality XRD data and significantly overlapped peaks, decreasing the accuracy of the results. Eqn (19) represents the SSP approach for the estimation of average strain as well as crystallite size.28,39
| |
 | (19) |
The lattice separation among the (hkl) planes is indicated by dhkl. The crystallite size was measured using a plot of (dhklβhkl![[thin space (1/6-em)]](https://www.rsc.org/images/entities/char_2009.gif) cos
cos![[thin space (1/6-em)]](https://www.rsc.org/images/entities/char_2009.gif) θ)2 on the vertical axis and (dhkl2βhkl
θ)2 on the vertical axis and (dhkl2βhkl![[thin space (1/6-em)]](https://www.rsc.org/images/entities/char_2009.gif) cos
cos![[thin space (1/6-em)]](https://www.rsc.org/images/entities/char_2009.gif) θ) on the horizontal axis (Fig. 6). The crystallite size of the prepared samples was estimated as 12.37 nm for pure HAp, 2.65 nm for doped HAp, 3.76 nm for urea HAp, 23.5 nm for naphthalene HAp, and 17.11 nm for palmitic acid HAp.
θ) on the horizontal axis (Fig. 6). The crystallite size of the prepared samples was estimated as 12.37 nm for pure HAp, 2.65 nm for doped HAp, 3.76 nm for urea HAp, 23.5 nm for naphthalene HAp, and 17.11 nm for palmitic acid HAp.
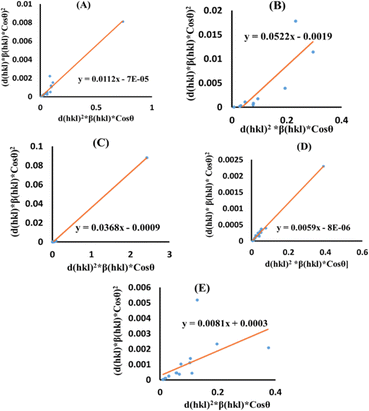 |
| | Fig. 6 SSP for synthesized HAp nanoparticles. (A) Pure Hap, (B) Doped_Hap, (C) Urea_Hap, (D) Naphthalene_Hap, (E) Palmitic acid_Hap. | |
Halder–Wagner method (HWM)
The SSP technique considers strain widening as a Gaussian function and size broadening as a Lorentzian function. However, the XRD peak is either a Lorentzian or Gaussian function as its peak area fits the Gaussian function, but its tail goes too rapidly.40 The Halder–Wagner technique is employed to solve this issue, provided that peak broadening is a symmetric Voigt function.41,42 Hence, the Voigt function may be represented as the FWHM of the physical profile employing the H–W method.| | |
βhkl2 = βLβhkl + βG2
| (20) |
where βG, βL = FWHM for Gaussian as well as Lorentzian function.| |
 | (21) |
| |
 | (22) |
| |
 | (23) |
By plotting (*βhkl/*dhkl)2 as well as (*βhkl/*dhkl)2 upon the vertical as well as horizontal axis (Fig. 7), correspondingly. The crystallite dimension was estimated from the solp (1/Dw) and is listed in Table 2. The crystallite size of the synthesized HAp was obtained as 5.43 nm for pure HAp, 1.93 nm for doped HAp, 4.14 nm for urea HAp, 13.51 nm for naphthalene HAp, and 3.64 nm for palmitic acid HAp.
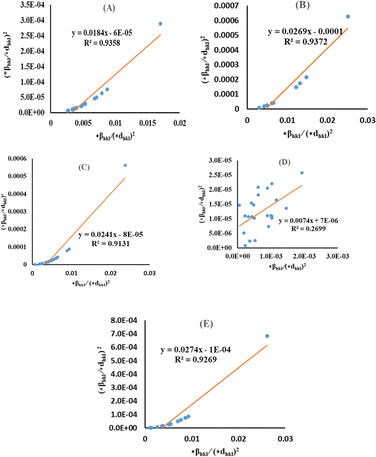 |
| | Fig. 7 HWM for synthesized HAp nanoparticles. (A) Pure Hap, (B) Doped_Hap, (C) Urea_HAP, (D) Naphthalene_Hap, (E) Palmitic acid_Hap. | |
Sahadat-Scherrer model (SSM)
The SSM accurately estimates the crystallite size despite possible shortcomings in the prior models that might result in larger crystallite sizes.43 The method assessed each peak using a distinct linear trajectory passing through the origin, generating a more acceptable model for the direct line intersecting at the origin.44,45 The mathematical formula can be represented as eqn (24).| |
 | (24) |
The terms 1/β and cos![[thin space (1/6-em)]](https://www.rsc.org/images/entities/char_2009.gif) θ are plotted on the horizontal axis as well as the vertical axis (Fig. 8). An intercept was developed using Excel. The crystallite size was determined by calculating the slope of the linear equation, with pure, doped, urea, naphthalene, as well as palmitic acid HAp having a size of 23.5, 17.55, 43.32, 39.61 and 43.32 nm, respectively.
θ are plotted on the horizontal axis as well as the vertical axis (Fig. 8). An intercept was developed using Excel. The crystallite size was determined by calculating the slope of the linear equation, with pure, doped, urea, naphthalene, as well as palmitic acid HAp having a size of 23.5, 17.55, 43.32, 39.61 and 43.32 nm, respectively.
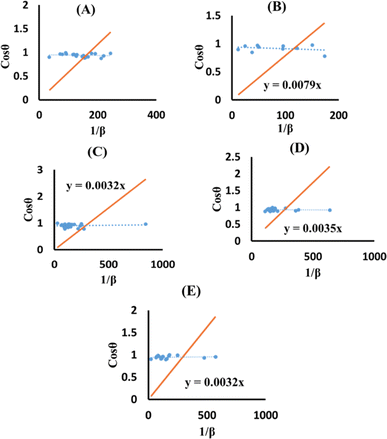 |
| | Fig. 8 SSM for synthesized HAp nanoparticles. (A) Pure Hap, (B) Doped_Hap, (C) Urea_HAP, (D) Naphthalene_Hap, (E) Palmitic acid_Hap. | |
Functional group analysis
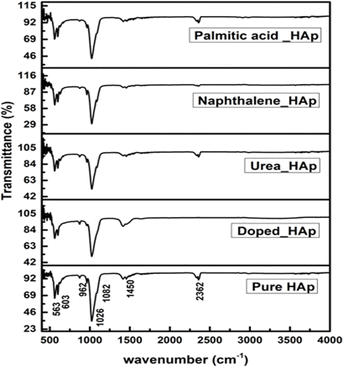
The observed spectra in Fig. 9 are attributed to the presence of PO43− as well as OH− groups in HAp, as indicated by the FTIR spectra.46 The hydrothermal technique is used to alter the crystal structure of HAp, resulting in four early vibrations: symmetric stretching (v1), symmetric bending (v3), asymmetric stretching (v2), and asymmetric bending (v4).47 The study asserts that three types of stretching oscillations at 962, 1026, and 1087 cm−1 wavenumbers as well as the bending vibration peaks at the wavenumber near 465, 563, and 599 cm−1 are equivalent to HAp.48,49 The vibration at 962 cm−1 was ascribed to (v1) oscillation, whereas 1087 and 1026 cm−1 peaks were related to (v2) vibration. The vibrations (v4) are detected at wavenumbers 563 and 599 cm−1, whereas (v3) vibration is prevalent at 473 cm−1. Asymmetric bending vibration appears between 563 and 599 cm−1, while v3 is found at 473 cm−1. The FTIR peaks at 3000–3800 cm−1 wavenumber have been found in multiple publications, demonstrating comparable positions for OH−.50,51 The peak near 2350 cm−1 was due to the presence of environmental carbon dioxide.
 |
| | Fig. 9 FTIR of hydrothermally synthesized HAp. | |
Assessment of optical properties
A UV-vis spectrophotometer was used to estimate the optical band gap of hydrothermally produced HAp at ambient temperature, requiring the Tauc plot technique to estimate absorption frequency (shown in eqn (25)).52,53
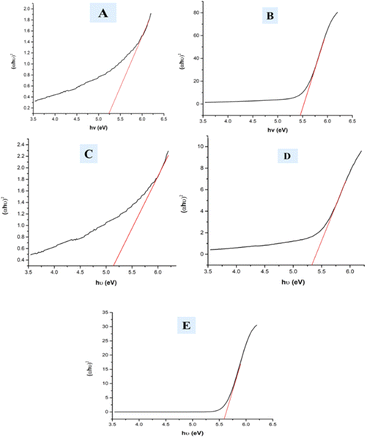
In the mentioned eqn (25), α, h, and θ are identified as the adsorption coefficient, Planck's constant, as well as photon frequency. The data shows optical band gap (Eg) values for various samples, including pure HAp, doped_HAp, Urea_Hap, Naphthalene_Hap, and Palmitic acid_HAp (Table 3). Disparities in the band gap may be due to dopants and organic modifications affecting the materials' electrical structure and optical characteristics (Fig. 10). Pure HAp has a band gap of 5.25 eV, while doped_HAp has a larger gap of 5.45 eV due to the dopant ions affecting the electrical structure. Urea_HAp has a reduced gap of 5.13 eV, possibly due to urea-derived functional groups or defects. Naphthalene_HAp has a band gap of 5.32 eV, lower than that of doped HAp but greater than that of pure HAp. Palmitic acid_HAp has the greatest band gap of 5.58 eV, indicating that long-chain fatty acid functionalization significantly affects the electrical structure of the HAp material.
Table 3 Measured band gap of synthesized HAp
| Sample name |
Eg (eV) |
| Pure_HAp |
5.25 |
| Doped_HAp |
5.45 |
| Urea_HAp |
5.13 |
| Naphthalene_Hap |
5.32 |
| Palmitic acid_HAp |
5.58 |
 |
| | Fig. 10 Optical band gap of (A) Pure Hap, (B) Doped_Hap, (C) Urea_HAP, (D) Naphthalene_Hap, (E) Palmitic acid_HAp. | |
Surface morphology study
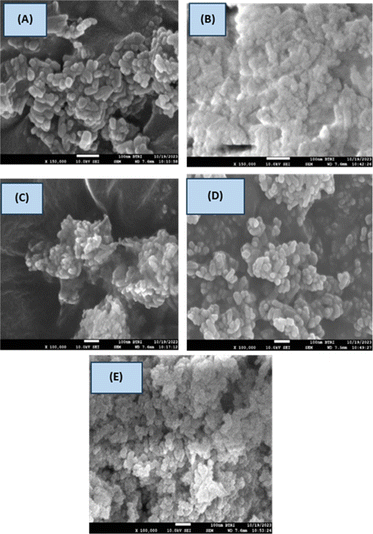
The surface morphology of the produced HAp was analyzed from the SEM images of the hydrothermally synthesized HAp. It is prominently visible that the synthesized HAp showed distinguishing shapes. Organic modifiers such as urea, naphthalene, and palmitic played a crucial role in altering the morphology and crystal structure of the synthesized HAp. Urea functions as a mineralizer, facilitating the formation of HAp nanorods and nanobundles.13 But in the case of HAp, no such strong effects were observed; rather, the formation of small aggregates was found, which is visualized in Fig. 11(C). The surface of HAp nanoparticles was influenced by urea, which promotes the growth of smaller, less crystalline structures, while palmitic acid, as a surfactant, restricted the size distribution and growth.54 Naphthalene formed pore-creating structures, resulting in high surface area and porosity in HAp, which helped control the particle size and prevent excessive aggregation.55 The porous nature of these HAp aggregates was likely due to the presence of the naphthalene template. Pure HAp, urea_HAp, and naphthalene_HAp possess monodispersed nanorod shapes with a length of 53.44, 38.74, and 53.23 nm, respectively.56 Apart from that, several associated particles with no distinct geometric forms were observed for doped HAp and palmitic acid HAp with crystallite sizes 30.89 and 50.79 nm, respectively. The particle sizes determining using SEM using 10–20 population are shown in Table 4. Normally, freeze drying is chosen for the drying of nanomaterials, but in this case, 105 °C was the temperature, which may be relatively higher for the formation of nano-aggregates. The synthesized samples exhibited particle aggregation, possibly due to higher temperatures, causing solvent fluctuations and Brownian motion, resulting in enhanced nuclei collisions and agglomeration, forming larger nanoparticles.57 The surface charge of the nanoparticles affects their aggregation, with larger particles exhibiting stronger repulsive interactions and smaller particles having lower charges, thus facilitating easier adhesion and agglomeration.58
 |
| | Fig. 11 Surface morphology of the sample (A) Pure HAp, (B) Doped_HAp, (C) Urea_HAP, (D) Naphthalene_HAp, (E) Palmitic acid_HAp. | |
Table 4 Crystallite size of synthesized HAp
| Sample name |
Coefficient of variation (CV) |
Average particle size (nm) |
Marginal error |
| Pure HAp |
39.265 |
53.442 |
10.494 |
| Dope HAp |
34.251 |
30.890 |
9.887 |
| Urea HAp |
35.57 |
38.745 |
10.268 |
| Naphthalene HAp |
27.604 |
53.236 |
7.127 |
| Palmitic acid HAp |
30.67600 |
50.798 |
10.845 |
Rietveld refinement
The quantitative analysis of hydrothermally synthesized HAp was conducted using Profex (5.2.4) software to obtain the quantitative phase percentages of hydroxyapatite using the Rietveld refinement technique. The phase percentage was estimated using 6500 points measuring angles (2θ = 5–70°, step of 0.01). The hydrothermally synthesized HAp shows different phase percentages, which are listed in Table 5.
Table 5 Different phase estimation via the Rietveld refinement method
| Samples |
HAp phase (%) |
Alpha TCP (%) |
Beta TCP (%) |
Rwp |
Rexp |
χ2 |
GoF |
| Pure HAp |
93.35 |
2.80 |
3.86 |
13.54 |
17.24 |
0.62 |
0.79 |
| Dope HAp |
82.15 |
8.49 |
9.36 |
15.45 |
17.46 |
0.78 |
0.88 |
| Naphthalene HAp |
96.63 |
1.43 |
1.94 |
12.96 |
17.14 |
0.57 |
0.76 |
| Palmitic acid HAp |
87.40 |
5.78 |
6.85 |
14.37 |
16.95 |
0.72 |
0.85 |
Conclusion
This study successfully synthesized hydroxyapatite (HAp) through a hydrothermal process, which was analyzed using various techniques including XRD, FTIR, SEM, and UV-vis spectroscopy. The synthesized HAp possesses an accurate crystallographic parameter, which is an indication of the formation of the HAp nanocrystal. This study proposed that the crystalline structure of HAp can be altered through the hydrothermal reaction using organic modifiers such as urea, naphthalene, as well as palmitic acid. The synthesized HAp exhibits morphology like monodispersed nanorods along with varying aggregation. The result obtained from the XRD model revealed that the synthesized product has nano-sized (<100 nm), retaining energy density, strain, and internal stress. This analysis utilized the Scherrer plot, different forms of Williamson–Hall plot, Sahadat-Scherrer's method, size–strain plot, and Halder–Wagner method. Furthermore, the average nanocrystal size was determined and confirmed from the SEM image, which validated the result obtained from XRD analysis. After analyzing all these examinations, it has been demonstrated that the Williamson–Hall approach delivers the best result for the calculation of elastic properties as well as crystallite size.
Data availability
Data will be made available on request.
Author contributions
Md. Kawsar synthesized the hydroxyapatites and wrote the draft and original manuscript. Md. Sahadat Hossain conceived and designed the experiment and analyzed the data. Sumaya Tabassum executed the bandgap energy. Dipa Islam executed the SEM analysis. Newaz Mohammed Bahadur and Samina Ahmed supervised the findings of this work. Samina Ahmed supervised the overall work and manage the required facilities.
Conflicts of interest
There are no conflicts to declare.
Acknowledgements
The authors are grateful to Bangladesh Council of Scientific and Industrial Research (BCSIR) authority for financial support through R&D project (ref. no. 39.02.0000.011.14.134.2021/900; date: 30.12.2021). Md. Kawsar wishes to thank Department of Applied Chemistry and Chemical Engineering, Noakhali Science and Technology University, Noakhali, Bangladesh for approving M.S. Thesis program.
References
- M. J. Olszta, X. Cheng, S. S. Jee, R. Kumar, Y.-Y. Kim, M. J. Kaufman, E. P. Douglas and L. B. Gower, Mater. Sci. Eng. R Rep., 2007, 58, 77–116 CrossRef.
- S. U. Zaman, M. Irfan, M. Irfan, M. K. U. Zaman and N. Muhammad, Biomed. Lett., 2020, 6, 84–99 Search PubMed.
- M. Kawsar, M. S. Hossain, M. K. Alam, N. M. Bahadur, M. A. A. Shaikh and S. Ahmed, J. Mater. Chem. B, 2024, 12, 3376–3391 RSC.
- Y. M. Park, S. C. Ryu, S. Y. Yoon, R. Stevens and H. C. Park, Mater. Chem. Phys., 2008, 109, 440–447 CrossRef CAS.
- K. Teshima, S. Lee, M. Sakurai, Y. Kameno, K. Yubuta, T. Suzuki, T. Shishido, M. Endo and S. Oishi, Cryst. Growth Des., 2009, 9, 2937–2940 CrossRef CAS.
- A. Cüneyt Tas, Biomaterials, 2000, 21, 1429–1438 CrossRef PubMed.
- S. Bose and S. K. Saha, Chem. Mater., 2003, 15, 4464–4469 CrossRef CAS.
- K. Kaviyarasu, A. Mariappan, K. Neyvasagam, A. Ayeshamariam, P. Pandi, R. R. Palanichamy, C. Gopinathan, G. T. Mola and M. Maaza, Surface. Interfac., 2017, 6, 247–255 CrossRef CAS.
- L. Yan, Y. Li, Z.-X. Deng, J. Zhuang and X. Sun, Int. J. Inorg. Mater., 2001, 3, 633–637 CrossRef CAS.
- H. Nosrati, R. S. Mamoory, D. Q. S. Le, C. E. Bünger, R. Z. Emameh and F. Dabir, Mater. Charact., 2020, 159, 110071 CrossRef CAS.
- H. Nosrati, R. S. Mamoory, F. Dabir, D. Q. Svend Le, C. E. Bünger, M. C. Perez and M. A. Rodriguez, Ceram. Int., 2019, 45, 1761–1769 CrossRef CAS.
- F. Mohandes and M. Salavati-Niasari, Mater. Sci. Eng. C, 2014, 40, 288–298 CrossRef CAS PubMed.
- S. Ebrahimi, C. Stephen Sipaut@ Mohd Nasri and S. E. Bin Arshad, PLoS One, 2021, 16, e0251009 CrossRef CAS PubMed.
- F. Nagata, Y. Yamauchi, M. Tomita and K. Kato, J. Ceram. Soc. Jpn., 2013, 121, 797–801 CrossRef CAS.
- Md. Sahadat Hossain and S. Ahmed, Results Eng., 2023, 20, 101630 CrossRef CAS.
- Md. S. Hossain, Md. A. A. Shaikh, Md. S. Rahaman and S. Ahmed, Mol. Syst. Des. Eng., 2022, 7, 1239–1248 RSC.
- M. Bin Mobarak, Md. S. Hossain, Z. Yeasmin, M. Mahmud, Md. M. Rahman, S. Sultana, S. M. Masum and S. Ahmed, J. Mol. Struct., 2022, 1252, 132142 CrossRef CAS.
- A. A. Akl and A. S. Hassanien, Superlattices Microstruct., 2015, 85, 67–81 CrossRef CAS.
- A. A. Akl, S. A. Aly and M. A. Kaid, Res. Rev.: J. Mater. Sci., 2016, 1–19 Search PubMed.
- M. Kawsar, M. S. Hossain, S. Tabassum, N. M. Bahadur and S. Ahmed, RSC Adv., 2024, 14, 11570–11583 RSC.
- Md. Sahadat Hossain, S. Tarannum, Md. Kawsar, N. M. Bahadur and S. Ahmed, J. Hazard. Mater. Adv., 2024, 13, 100406 CrossRef CAS.
- K. C. Vinoth Kumar, T. Jani Subha, K. G. Ahila, B. Ravindran, S. W. Chang, A. H. Mahmoud, O. B. Mohammed and M. A. Rathi, Saudi J. Biol. Sci., 2021, 28, 840–846 CrossRef CAS PubMed.
- W. Tong, J. Chen, X. Li, J. Feng, Y. Cao, Z. Yang and X. Zhang, J. Mater. Sci., 1996, 31, 3739–3742 CrossRef CAS.
- S. K. Sahoo, A. Madhuri, A. Saini, S. Jena, P. S. Devi, S. Laha and B. P. Swain, Journal of Alloys and Metallurgical Systems, 2023, 4, 100035 CrossRef.
- S. Prosad Moulick, Md. Sahadat Hossain, Md. Zia Uddin Al Mamun, F. Jahan, Md. Farid Ahmed, R. A. Sathee, Md. Sujan Hossen, Md. Ashraful Alam, Md. Sha Alam and F. Islam, Results Eng., 2023, 20, 101418 CrossRef CAS.
- R. Delhez, T. H. Keijser and E. J. Mittemeijer, Fresen. J. Anal. Chem., 1982, 312, 1–16 CrossRef CAS.
- P. C. Dey and R. Das, Indian J. Phys., 2018, 92, 1099–1108 CrossRef CAS.
- D. Nath, F. Singh and R. Das, Mater. Chem. Phys., 2020, 239, 122021 CrossRef CAS.
- R. Das and S. Sarkar, Curr. Sci., 2015, 109, 775–778 CrossRef.
- D. Balzar and H. Ledbetter, J. Appl. Crystallogr., 1993, 26, 97–103 CrossRef.
- B. Himabindu, N. S. M. P. Latha Devi, G. Sandhya, T. Naveen Reddy, T. Saha, B. Rajini Kanth and Md. Sarowar Hossain, Mater. Sci. Eng. B, 2023, 296, 116666 CrossRef CAS.
- A. Khorsand Zak, W. H. A. Majid, M. E. Abrishami and R. Yousefi, Solid State Sci., 2011, 13, 251–256 CrossRef CAS.
- Md. S. Hossain, Md. M. Hasan, M. Mahmud, M. B. Mobarak and S. Ahmed, Chem. Pap., 2023, 77, 463–471 CrossRef CAS.
- W. H. Hall, Proc. Phys. Soc. A, 1949, 62, 741 CrossRef.
- A. Maurya, P. Chauhan, S. K. Mishra and R. K. Srivastava, J. Alloys Compd., 2011, 509, 8433–8440 CrossRef CAS.
- M. Kawsar, M. S. Hossain, S. Tabassum, N. Mohammed Bahadur and S. Ahmed, Nanoscale Adv., 2024, 6, 2682–2700 RSC.
- M. Bodke, U. Gawai, A. Patil and B. Dole, Matériaux Tech., 2018, 106, 602 CrossRef CAS.
- V. Mote, Y. Purushotham and B. Dole, J. Theor. Appl. Phys., 2012, 6, 6 CrossRef.
- B. Rajesh Kumar and B. Hymavathi, J. Asian Ceram. Soc., 2017, 5, 94–103 CrossRef.
- A. Hepp and C. Baerlocher, Aust. J. Phys., 1988, 41, 229–236 CrossRef CAS.
- L. Motevalizadeh, Z. Heidary and M. Ebrahimizadeh Abrishami, Bull. Mater. Sci., 2014, 37, 397–405 CrossRef CAS.
- N. C. Halder and C. N. J. Wagner, Acta Crystallogr., 1966, 20, 312–313 CrossRef CAS.
- Md. S. Hossain, M. Mahmud, M. B. Mobarak, S. Sultana, Md. A. A. Shaikh and S. Ahmed, Chem. Pap., 2022, 76, 7245–7251 CrossRef CAS.
- Md. Kawsar, Md. S. Hossain, N. M. Bahadur and S. Ahmed, Heliyon, 2024, 10, e25347 CrossRef CAS PubMed.
- Md. Sahadat Hossain and S. Ahmed, J. Saudi Chem. Soc., 2023, 27, 101649 CrossRef CAS.
- Md. S. Hossain, M. Mahmud, M. B. Mobarak and S. Ahmed, Chem. Pap., 2022, 76, 1593–1605 CrossRef CAS.
- N. Kourkoumelis and M. Tzaphlidou, Sci. World J., 2010, 10, 402–412 CrossRef PubMed.
- N. K. Nguyen, M. Leoni, D. Maniglio and C. Migliaresi, J. Biomater. Appl., 2013, 28, 49–61 CrossRef CAS PubMed.
- R. A. Ramli, R. Adnan, M. Abu Bakar and S. Masudi, J. Phys. Sci., 2011, 22, 25–37 CAS.
- N. V. Bulina, N. V. Eremina, O. B. Vinokurova, A. V. Ishchenko and M. V. Chaikina, Materials, 2022, 15, 5759 CrossRef CAS PubMed.
- T. Bazin, A. Magnaudeix, R. Mayet, P. Carles, I. Julien, A. Demourgues, M. Gaudon and E. Champion, Ceram. Int., 2021, 47, 13644–13654 CrossRef CAS.
- Md. S. Hossain, S. M. Tuntun, N. M. Bahadur and S. Ahmed, RSC Adv., 2022, 12, 34080–34094 RSC.
- S. Moshtaghi, M. Hamadanian and M. Salavati-Niasari, RSC Adv., 2022, 12, 4913–4923 RSC.
- P. Feng, R. Zhao, L. Yang, S. Chen, D. Wang, H. Pan and C. Shuai, Ceram. Int., 2022, 48, 33682–33692 CrossRef CAS.
- Y. Wang, S. Zhang, K. Wei, N. Zhao, J. Chen and X. Wang, Mater. Lett., 2006, 60, 1484–1487 CrossRef CAS.
- Y. Yang, Q. Wu, M. Wang, J. Long, Z. Mao and X. Chen, Cryst. Growth Des., 2014, 14, 4864–4871 CrossRef CAS.
- J. S. Earl, D. J. Wood and S. J. Milne, J. Phys.: Conf. Ser., 2006, 26, 268–271 CrossRef.
- K. Byrappa and T. Adschiri, Prog. Cryst. Growth Charact. Mater., 2007, 53, 117–166 CrossRef CAS.
|
| This journal is © The Royal Society of Chemistry 2024 |
Click here to see how this site uses Cookies. View our privacy policy here.  Open Access Article
 a,
Sumaya Tabassuma,
Dipa Islamc,
Newaz Mohammed Bahadurb and
Samina Ahmed
 *a
*a
![[thin space (1/6-em)]](https://www.rsc.org/images/entities/char_2009.gif) 902 to 36
902 to 36![[thin space (1/6-em)]](https://www.rsc.org/images/entities/char_2009.gif) 940 N m−2), as well as energy density (from 4 × 10⁻¹⁴ to 113.72 J m−3) were likewise computed for the synthesized HAp. The texture co-efficient analysis reveals that doped HAp is grown in the (202) and (112) planes, palmitic acid_HAp in (002), (112), and (202) planes, while all the synthesized HAp (pure HAp, urea, naphthalene) is grown in the (002) and (112) planes. Rietveld refinement was also performed to estimate the quantative phase percentage from XRD data.
940 N m−2), as well as energy density (from 4 × 10⁻¹⁴ to 113.72 J m−3) were likewise computed for the synthesized HAp. The texture co-efficient analysis reveals that doped HAp is grown in the (202) and (112) planes, palmitic acid_HAp in (002), (112), and (202) planes, while all the synthesized HAp (pure HAp, urea, naphthalene) is grown in the (002) and (112) planes. Rietveld refinement was also performed to estimate the quantative phase percentage from XRD data.![[thin space (1/6-em)]](https://www.rsc.org/images/entities/char_2009.gif) :
:![[thin space (1/6-em)]](https://www.rsc.org/images/entities/char_2009.gif) 6. The addition of H3PO4 into this solution was done at the rate of 4 mL per min. During the synthesis process, the pH of the solution was maintained above 9 using NH4OH and/or HNO3 solution. Different organic modifiers such as urea (0.1 g), naphthalene (0.1 g), palmitic acid (0.1 g), as well as external HAp (0.1 g) were added into the reaction system, and the solution was stirred for 2 h at room temperature. Then, the solution was shifted into a 100 mL stainless-steel autoclave reactor encased in polytetrafluoroethylene (PTFE) and subjected to hydrothermal synthesis at a temperature of 180 °C for 3 h. Afterward, the resulting mixture was cooled to the ambient temperature. The precipitate was separated by passing it through a filter paper and then rinsed with deionized water. These precipitates were then subjected to the process of drying in an oven at 105 °C for 6 h.
6. The addition of H3PO4 into this solution was done at the rate of 4 mL per min. During the synthesis process, the pH of the solution was maintained above 9 using NH4OH and/or HNO3 solution. Different organic modifiers such as urea (0.1 g), naphthalene (0.1 g), palmitic acid (0.1 g), as well as external HAp (0.1 g) were added into the reaction system, and the solution was stirred for 2 h at room temperature. Then, the solution was shifted into a 100 mL stainless-steel autoclave reactor encased in polytetrafluoroethylene (PTFE) and subjected to hydrothermal synthesis at a temperature of 180 °C for 3 h. Afterward, the resulting mixture was cooled to the ambient temperature. The precipitate was separated by passing it through a filter paper and then rinsed with deionized water. These precipitates were then subjected to the process of drying in an oven at 105 °C for 6 h.


![[thin space (1/6-em)]](https://www.rsc.org/images/entities/char_2009.gif) tan
tan![[thin space (1/6-em)]](https://www.rsc.org/images/entities/char_2009.gif) θ
θ


 ; it is the average of relative intensity, correspondingly. The analysis shows that the texture co-efficient for hydrothermally synthesized pure HAp, urea_HAp, and naphthalene_HAp is grown in the (002) and (112) planes. Conversely, doped_HAp is grown in the (202) and (112) planes, whereas palmitic acid_HAp is grown in the (002), (112), and (202) planes, respectively.

![[thin space (1/6-em)]](https://www.rsc.org/images/entities/char_2009.gif) tan
tan![[thin space (1/6-em)]](https://www.rsc.org/images/entities/char_2009.gif) θ
θ


![[thin space (1/6-em)]](https://www.rsc.org/images/entities/char_2009.gif) *cos
*cos![[thin space (1/6-em)]](https://www.rsc.org/images/entities/char_2009.gif) θ and 4
θ and 4![[thin space (1/6-em)]](https://www.rsc.org/images/entities/char_2009.gif) sin
sin![[thin space (1/6-em)]](https://www.rsc.org/images/entities/char_2009.gif) θ as independent variables along the vertical as well as the horizontal axis. The slope represents the strain in HAp nanocrystals, while the intercept shows the mean particle size due to lattice contraction or expansion. This modification slightly alters the atomic arrangement and creates defects in the lattice structure, resulting in strain. The average crystallite size was obtained at 15.57, 7.14, 8.55, 23.90, and 66.02 nm for Pure HAp, Doped_HAp, Urea_HAp, Naphthalene_HAp as well as Palmitic acid_Hap, respectively. The UDM plot shows a positive slope resulting in lattice expansion, intrinsic strain in nanocrystals, and a negative magnitude, indicating compressive strain.35
θ as independent variables along the vertical as well as the horizontal axis. The slope represents the strain in HAp nanocrystals, while the intercept shows the mean particle size due to lattice contraction or expansion. This modification slightly alters the atomic arrangement and creates defects in the lattice structure, resulting in strain. The average crystallite size was obtained at 15.57, 7.14, 8.55, 23.90, and 66.02 nm for Pure HAp, Doped_HAp, Urea_HAp, Naphthalene_HAp as well as Palmitic acid_Hap, respectively. The UDM plot shows a positive slope resulting in lattice expansion, intrinsic strain in nanocrystals, and a negative magnitude, indicating compressive strain.35

![[thin space (1/6-em)]](https://www.rsc.org/images/entities/char_2009.gif) *cos
*cos![[thin space (1/6-em)]](https://www.rsc.org/images/entities/char_2009.gif) (θ) along the vertical as well as 4
(θ) along the vertical as well as 4![[thin space (1/6-em)]](https://www.rsc.org/images/entities/char_2009.gif) sin
sin![[thin space (1/6-em)]](https://www.rsc.org/images/entities/char_2009.gif) θ/Yhkl along the horizontal axis aligning to every diffraction pattern for synthesized HAp, has been visualized in Fig. 4. The crystallite dimension of the synthesized HAp was estimated by calculating σ from the linear fitting slope and extrapolation intercept. Table 2 provides the crystalline size and stress.
θ/Yhkl along the horizontal axis aligning to every diffraction pattern for synthesized HAp, has been visualized in Fig. 4. The crystallite dimension of the synthesized HAp was estimated by calculating σ from the linear fitting slope and extrapolation intercept. Table 2 provides the crystalline size and stress.
![[thin space (1/6-em)]](https://www.rsc.org/images/entities/char_2009.gif) 902
902![[thin space (1/6-em)]](https://www.rsc.org/images/entities/char_2009.gif) 940
940

![[thin space (1/6-em)]](https://www.rsc.org/images/entities/char_2009.gif) cos
cos![[thin space (1/6-em)]](https://www.rsc.org/images/entities/char_2009.gif) θ on the vertical axis and
θ on the vertical axis and  . On the horizontal axis (Fig. 5), the crystallite dimension, as well as the anisotropic density, were measured from the Y-intercept as well as the slope of the mentioned equation and is listed in Table 2.


![[thin space (1/6-em)]](https://www.rsc.org/images/entities/char_2009.gif) cos
cos![[thin space (1/6-em)]](https://www.rsc.org/images/entities/char_2009.gif) θ)2 on the vertical axis and (dhkl2βhkl
θ)2 on the vertical axis and (dhkl2βhkl![[thin space (1/6-em)]](https://www.rsc.org/images/entities/char_2009.gif) cos
cos![[thin space (1/6-em)]](https://www.rsc.org/images/entities/char_2009.gif) θ) on the horizontal axis (Fig. 6). The crystallite size of the prepared samples was estimated as 12.37 nm for pure HAp, 2.65 nm for doped HAp, 3.76 nm for urea HAp, 23.5 nm for naphthalene HAp, and 17.11 nm for palmitic acid HAp.
θ) on the horizontal axis (Fig. 6). The crystallite size of the prepared samples was estimated as 12.37 nm for pure HAp, 2.65 nm for doped HAp, 3.76 nm for urea HAp, 23.5 nm for naphthalene HAp, and 17.11 nm for palmitic acid HAp.


![[thin space (1/6-em)]](https://www.rsc.org/images/entities/char_2009.gif) θ are plotted on the horizontal axis as well as the vertical axis (Fig. 8). An intercept was developed using Excel. The crystallite size was determined by calculating the slope of the linear equation, with pure, doped, urea, naphthalene, as well as palmitic acid HAp having a size of 23.5, 17.55, 43.32, 39.61 and 43.32 nm, respectively.
θ are plotted on the horizontal axis as well as the vertical axis (Fig. 8). An intercept was developed using Excel. The crystallite size was determined by calculating the slope of the linear equation, with pure, doped, urea, naphthalene, as well as palmitic acid HAp having a size of 23.5, 17.55, 43.32, 39.61 and 43.32 nm, respectively.


