DOI:
10.1039/D4RA03579H
(Paper)
RSC Adv., 2024,
14, 37330-37340
Novel HPMC/PEDOT:PSS nanocomposite for optoelectronic and energy storage applications
Received
15th May 2024
, Accepted 2nd July 2024
First published on 21st November 2024
Abstract
This study investigates a class of materials known as polymer nanodielectrics, which are formed by incorporating ceramic fillers into polymers. These materials offer the unique advantage of tunable electrical and optical properties. The research focuses on the incorporation of high-purity stannic oxide nanoparticles (SnO2 NPs) into a ternary blend matrix of hydroxypropyl methylcellulose (HPMC) and poly(3,4-ethylenedioxythiophene) polystyrene sulfonate (PEDOT:PSS) using a solution casting method. Characterization techniques like X-ray diffraction (XRD) and Fourier-transform infrared spectroscopy (FT-IR) revealed alterations in the amorphous nature of the HPMC/PEDOT:PSS blend upon the introduction of SnO2 NPs. These analyses also suggest the formation of interactions between the polymer and nanoparticles. Scanning electron microscopy (SEM) images confirmed the successful dispersion of SnO2 NPs on the surface of the polymer blend, particularly at lower concentrations. The optical properties of the nanocomposite films were investigated using UV-vis spectrophotometry. This analysis allowed for the calculation of optical constants like the bandgap and refractive index. The results showed a dual-bandgap structure, with the direct and indirect bandgaps ranging from 4.92 eV to 4.26 eV and 3.52 eV to 1.68 eV, respectively. Electrical characterization using AC conductivity and dielectric permittivity measurements revealed a dependence on the SnO2 NPs concentration within the frequency range of 0.1 Hz to 10 MHz. The relaxation processes and interfacial polarization effects within these nanocomposites are further discussed in the study. At a frequency of 10 Hz, the AC conductivity exhibited a significant increase, rising from 1.85 × 10⁻¹² S m−1 to 1.04 × 10⁻⁹ S m−1 upon the addition of 0.7 wt% SnO2 NPs. These findings highlight the multifunctional nature of the developed nanocomposites. They hold promise for various applications, including UV blockers, optical bandgap tuners, and optical coatings in advanced optoelectronic devices. Additionally, their tunable high permittivity suggests potential use as dielectric substrates for next-generation, high-performance energy storage devices.
1. Introduction
In the past few decades, there has been notable progress in technology, accompanied by a rise in digital products and services. Moreover, emerging technologies such as artificial intelligence (AI), robotics, and nanotechnology appear poised to accelerate the pace of advancement.1 Nanotechnology's versatility offers a wealth of opportunities to improve our lives. Notably, materials science, nanomedicine, and device engineering hold immense promise for groundbreaking advancements. At the nanoscale, materials exhibit properties distinct from their bulk counterparts. These properties can encompass significant changes in mechanical strength, electrical conductivity, magnetism, thermal behavior, and light interaction. This has attracted significant research interest, with transition metal oxides like stannic oxide nanoparticles (SnO2 NPs) gaining particular attention for their desirable properties. SnO2 NPs offer several advantages: they are low-cost, highly stable, and possess valuable optoelectronic characteristics.2
One promising near-term strategy to leverage the benefits of SnO2 NPs is through the creation of composites with polymers or polymer blends. Hydroxypropyl methylcellulose (HPMC) and PEDOT:PSS are particularly attractive candidates because of optical, and electrical properties, making them highly relevant for industrial applications. HPMC, a cellulose derivative, is a water-soluble anionic polymer known for its film and gel-forming capabilities at high temperatures.3 The polymer's structure incorporates OH group and COO− functionalities, promoting interaction between the nanofillers and enhancing the overall performance of the composite system.4 HPMC's versatility stems from its unique combination of properties. It is transparent, possesses high viscosity, and exhibits biocompatibility and biodegradability. These characteristics make HPMC valuable across diverse applications, ranging from paper manufacturing and textile printing to controlled drug delivery in medications.5
PEDOT:PSS is a remarkable material with a unique combination of properties that make it highly sought after in various fields. It boasts impressive conductivity, allowing it to efficiently carry electrical current. This characteristic makes it a perfect candidate for applications like transparent electrodes in solar cells and OLEDs.6 Furthermore, PEDOT:PSS demonstrates good biocompatibility, minimizing negative interactions with living tissues. This biocompatible nature opens doors for exciting biomedical applications such as neural interfaces, implantable biosensors, and tissue engineering scaffolds. Additionally, PEDOT:PSS offers partial transparency, permitting some light to pass through. This transparency is crucial for the development of organic solar cells and transparent displays.7 Finally, PEDOT:PSS exhibits good thermal stability, meaning it can withstand relatively high temperatures without significant degradation. This property makes it suitable for processing and device fabrication at elevated temperatures. While PEDOT:PSS offers significant advantages, research continues to refine its properties and explore even more applications for this versatile material.
Recent studies have utilized the solution casting method to create lightweight and flexible polymer nanocomposites containing HPMC, PEDOT:PSS, and SnO2 NPs, aiming to enhance their electrical properties for electronic applications. The research focuses on using an HPMC/PEDOT:PSS blend as the main polymeric matrix, incorporating SnO2 NPs as conductive additives. This work delves into the functional properties of the nanocomposites through a battery of characterization techniques, including structural, optical, and electrical analyses. By unveiling the interplay between these properties at the nanoscale, the investigation aims to shed light on the underlying mechanisms responsible for the improved performance of these materials.
2. Experimental work
2.1. Chemicals
Stannic oxide nanoparticles (SnO2 NPs) with a particle size less than 40 nm and a purity of 99.7% trace metal basis were acquired from Sigma-Aldrich. Hydroxypropyl methylcellulose (HPMC) with a molecular weight of about 133![[thin space (1/6-em)]](https://www.rsc.org/images/entities/char_2009.gif) 400 g mol−1 and poly(3,4-ethylenedioxythiophene) polystyrene sulfonate (PEDOT:PSS) as a 1.3 wt% dispersion in water with a conductivity of 1 S cm−1 were also obtained from the same supplier.
400 g mol−1 and poly(3,4-ethylenedioxythiophene) polystyrene sulfonate (PEDOT:PSS) as a 1.3 wt% dispersion in water with a conductivity of 1 S cm−1 were also obtained from the same supplier.
2.2. Preparation of HPMC/PEDOT:PSS-SnO2 nanocomposite
Nanocomposite films were prepared using a solution casting method. First, 0.25 g of HPMC was dissolved in 80 ml of deionized water at 50 °C with the aid of magnetic stirring to ensure complete dissolution. After allowing the HPMC solution to cool, 20 ml of the mixture was combined with 0.5 ml of PEDOT:PSS. This combined solution was then equally divided into four parts and stirred for an additional 2 hours. In parallel, varying amounts of Sn2O NPs (0, 0.003, 0.005, and 0.007 g) were each dispersed in 2 ml of deionized water. Each SnO2 NP dispersion was then incorporated into one of the four HPMC/PEDOT:PSS mixtures and stirred for another 2 hours. Finally, the resulting mixtures were cast into plastic Petri dishes with a diameter of 55 mm and dried at 45 °C. Following the casting process, the films underwent thorough drying to eliminate residual moisture. This was achieved by placing them in a desiccator containing silica gel desiccants. To facilitate future reference, the dried films were labeled S1, S2, S3, and S4, with the labels corresponding to the increasing amount of incorporated SnO2 NPs (0 g for S1 and progressively more for subsequent samples).
2.3. Characterizations
The structural and morphological properties of the nanocomposite films were characterized using various techniques. Fourier transform infrared (FT-IR) spectroscopy (JASCO 430, Japan) identified functional groups within the 400–4000 cm−1 wavenumber range. XRD using CuKα radiation (DIANO, USA) revealed the crystalline structure of the samples by analyzing the Bragg angle (2θ) between 5° and 70°. Optical properties were investigated using a UV-visible spectrophotometer (JASCO V-630, Japan) to measure light absorption across the spectrum. Scanning electron microscopy (SEM) with a 20 kV electron beam (Quanta Inspect F50, FEI Company, Netherlands) was employed to visualize the surface morphology. To characterize the electrical properties of the films at room temperature (303 K), broadband dielectric spectroscopy was employed.
3. Result and discussion
3.1. XRD studies
Fig. 1 presents the X-ray diffraction pattern of the SnO2 nanoparticles. The detected diffraction peaks were associated with the standard JCPDS data (# 41-1445) to identify the corresponding crystalline planes. This analysis confirms the formation of a pure, polycrystalline SnO2 phase with a tetragonal crystal system. The results are consistent with previous reports on SnO2 nanoparticles.8 The XRD patterns of the HPMC/PEDOT:PSS nanocomposites with varying SnO2 NPs concentrations are presented in Fig. 2. The pattern for pristine PEDOT:PSS exhibits broad, low-intensity diffraction peaks around 2θ = 12.27°. These peaks can be attributed to either the intermolecular spacing of the polymer backbone or the (020) reflection in the crystal structure.9 The XRD patterns of the nanocomposites exhibit several new diffraction peaks compared to pristine HPMC/PEDOT:PSS (Fig. 2). These peaks appear at 2θ values of approximately 26.6°, 33.9°, and so on, which is consistent with the reported diffraction pattern of tetragonal SnO2. This observation strongly suggests the successful incorporation of SnO2 nanoparticles into the HPMC/PEDOT:PSS matrix. While the XRD patterns of the nanocomposites confirmed the presence of SnO2 (Fig. 1), the peaks appeared broader and less intense compared to pure SnO2. This suggests a less well-crystallized SnO2 phase within the composite matrix. The Debye–Scherrer equation,10 was employed to estimate the average crystallite size (D) of SnO2 nanoparticles using the most prominent peak (likely corresponding to the (110) plane). The calculated crystallite sizes ranged from approximately 43 nm to 26 nm across the different nanocomposite films.| |
 | (1) |
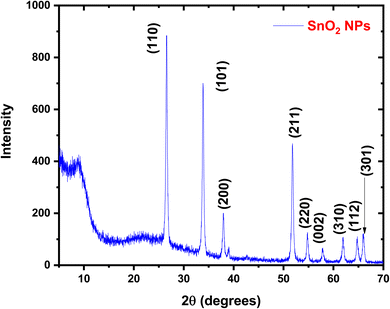 |
| | Fig. 1 XRD pattern of pure SnO2 nanoparticles. | |
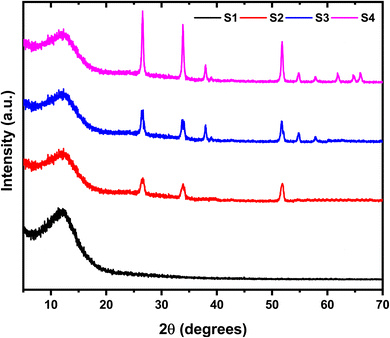 |
| | Fig. 2 XRD pattern of HPMC/PEDOT:PSS ternary blend and HPMC/PEDOT:PSS doped with SnO2 nanoparticles. | |
The Debye–Scherrer equation, a well-established technique for estimating crystallite size from XRD data, was employed in this study. This method considers factors like the peak broadening (full width at half maximum, FWHM) and the Bragg angle (θ) to calculate the average crystallite size (D). Notably, the analysis revealed a decrease in the average crystallite size of SnO2 nanoparticles from 43.12 nm to 25.81 nm as the concentration of SnO2 increased within the HPMC/PEDOT:PSS nanocomposites.
3.2. FT-IR analysis
Fourier Transform Infrared (FT-IR) spectroscopy was employed to investigate the formation of the HPMC/PEDOT:PSS blend and the incorporation of SnO2 nanoparticles within the composite (Fig. 3). The FT-IR spectra of the HPMC/PEDOT:PSS blend doped with varying SnO2 concentrations reveal distinct peaks corresponding to different functional groups. The pristine HPMC/PEDOT:PSS spectrum exhibits characteristic transmission bands at 1222 cm−1, 1116 cm−1, and 1090 cm−1, indicative of CH2 bending, CH2 symmetrical stretching, and CO stretching vibrations, respectively.1,3,5,10,13,14 The FT-IR spectra (Fig. 3) further confirm the presence of HPMC and PEDOT:PSS within the composites. Characteristic peaks for HPMC were observed at 1403 cm−1 (CH2 scissoring),11 while PEDOT:PSS displayed bands at 1655 cm−1 (C![[double bond, length as m-dash]](https://www.rsc.org/images/entities/char_e001.gif) C stretching) and 3471 cm−1 (OH stretching).1 A more detailed peak assignment is provided in Table 1. Interestingly, the incorporation of SnO2 NPs resulted in subtle changes to the overall FT-IR profile. Notably, a new peak emerged at 468 cm−1, attributed to Sn–O vibrational modes, and its intensity increased with higher SnO2 concentration. This observation suggests successful interaction between the HPMC/PEDOT:PSS blend and the SnO2 nanoparticles. Further analysis of these spectral shifts, particularly for characteristic bands of the polymer components, can provide valuable insights into how the SnO2 filler influences the structural composition of the interpolymer matrix. It's important to note that the presence of double bond segments within the composite structure might be advantageous. These segments could potentially serve as preferential sites for polarons and bipolarons, which can act as charge carriers and contribute to the electrical properties of the nanocomposite.12
C stretching) and 3471 cm−1 (OH stretching).1 A more detailed peak assignment is provided in Table 1. Interestingly, the incorporation of SnO2 NPs resulted in subtle changes to the overall FT-IR profile. Notably, a new peak emerged at 468 cm−1, attributed to Sn–O vibrational modes, and its intensity increased with higher SnO2 concentration. This observation suggests successful interaction between the HPMC/PEDOT:PSS blend and the SnO2 nanoparticles. Further analysis of these spectral shifts, particularly for characteristic bands of the polymer components, can provide valuable insights into how the SnO2 filler influences the structural composition of the interpolymer matrix. It's important to note that the presence of double bond segments within the composite structure might be advantageous. These segments could potentially serve as preferential sites for polarons and bipolarons, which can act as charge carriers and contribute to the electrical properties of the nanocomposite.12
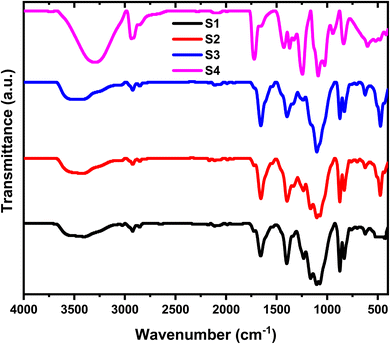 |
| | Fig. 3 FT-IR spectra of HPMC/PEDOT:PSS ternary blend doped with SnO2 nanoparticles. | |
Table 1 FT-IR Peak assignments for the synthesized nanocomposites
| Wavenumber (cm−1) |
Bands assignment |
Sources |
References |
| 3471 |
OH stretching |
HPMC + PEDOT:PSS |
1, 5 and 13 |
| 2926 |
CH2 asymmetric stretching |
HPMC |
3 and 14 |
| 2850 |
CH2 symmetrical stretching |
HPMC |
3 |
| 1655 |
C![[double bond, length as m-dash]](https://www.rsc.org/images/entities/char_e001.gif) C stretching C stretching |
PEDOT:PSS |
1 |
| 1402 |
CH2 scissoring |
HPMC |
5 and 14 |
| 1222 |
CH2 bending |
HPMC |
3 and 5 |
| 1116 |
CH2 bending |
HPMC |
3 and 5 |
| 1090 |
CO stretching |
HPMC |
5 |
| 872 |
CH2 bending |
HPMC |
5 |
| 468 |
Sn–O vibration |
SnO2 NPs |
10 |
3.3. Morphology studies
Field emission scanning electron microscopy (FESEM) was employed to investigate the surface morphology of the HPMC/PEDOT:PSS composites with varying SnO2 nanoparticle concentrations (Fig. 4). The FESEM image of pristine HPMC/PEDOT:PSS (Fig. 4a) reveals a smooth surface with minimal porosity, suggesting a relatively low surface area. In contrast, the FESEM image of the composite containing the highest SnO2 loading (0.007 g) exhibits a markedly different morphology (Fig. 4b). This image shows a highly porous structure with the presence of well-dispersed SnO2 nanoparticles. This observation suggests that SnO2 nanoparticle incorporation effectively disrupts the formation of large HPMC/PEDOT:PSS agglomerates, leading to an increased surface area. Furthermore, the introduction of SnO2 nanoparticles has been shown to enhance the electrical conductivity of the HPMC/PEDOT:PSS composites.
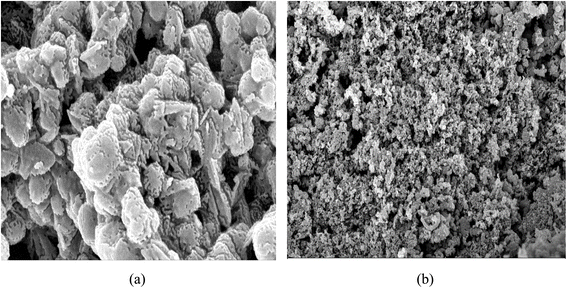 |
| | Fig. 4 FFSEM images (a) HPMC/PEDOT:PSS, (b) HPMC/PEDOT:PSS/0.007 g SnO2 nanocomposite. | |
3.4. UV-visible spectroscopy
Fig. 5 illustrates the relationship between optical absorbance and wavelength (λ) for the HPMC/PEDOT:PSS composite and the HPMC/PEDOT:PSS-SnO2 nanocomposites. The data reveals that the absorbance of the nanocomposites is generally higher than that of the pristine HPMC/PEDOT:PSS blend across most of the investigated wavelength range. Furthermore, the absorbance tends to increase with increasing SnO2 concentration.15 The observed variations in optical properties suggest the formation of homogeneous polymer nanocomposites. This characteristic, combined with the increased light absorption due to SnO2 incorporation, makes these nanocomposites promising candidates for applications in optical coatings and UV shielding materials.16 The UV-Vis spectrum reveals an absorption band around 230 nm. Interestingly, the incorporation of SnO2 nanoparticles leads to a red-shift of this peak and the overall absorption edge in the UV region. This observation suggests a decrease in the optical band gap (Eg) of the nanocomposite compared to pristine HPMC/PEDOT:PSS. The red-shifted absorption edge might be attributed to the creation of new localized states and energy levels within the band gap. These new states, potentially induced by increased disorder and defects due to SnO2 incorporation, could facilitate the movement of electrons from the valence band (VB) to the conduction band (CB). This ultimately leads to a narrower band gap and potentially allows for more efficient electronic transitions within the nanocomposite.17 The incorporation of SnO2 nanoparticles within the HPMC/PEDOT:PSS matrix likely influences the electronic interactions and creates more defect states within the composite.18 These defect states and potential disorder regions may enhance the mobility of polymer segments and facilitate the movement of electrons between VB and CB of the nanocomposite. This can lead to a reduction in the overall band gap (Eg) and a consequent red-shift of the absorption edge observed in the UV-Vis spectrum.
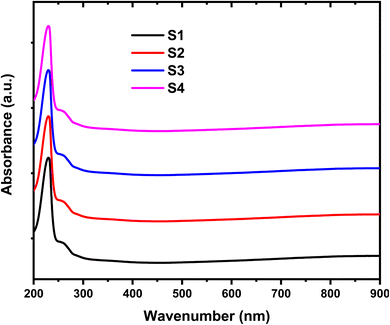 |
| | Fig. 5 UV-Vis absorption spectra of the HPMC/PEDOT:PSS composite and HPMC/PEDOT:PSS nanocomposites containing different SnO2 nanoparticle loadings. | |
The Tauc equation is employed to estimate the optical band gap (Eg) of the prepared films for both allowed indirect (Eig) and direct (Edg) transitions:19
| | |
(αhν)1/2 = B(hν − Edg)
| (3) |
This approach relates the absorption coefficient (α) to the incident photon energy (hν) through a material-specific constant (B). Fig. 6 and 7 figures depict plots of (αhν)2 and (αhν)1/2 for indirect and direct transitions, respectively, as functions of hν. The band gap values (Edg and Eig) can be determined by extrapolating the linear portions of these curves to the point where the absorption coefficient (α) intercepts zero. The obtained Eg values for the nanocomposite films are presented in Table 2. The Eg value of the pristine HPMC/PEDOT:PSS composite is consistent with previously reported values.20 Notably, the incorporation of SnO2 nanoparticles leads to a decrease in the Eg compared to the pure polymer composite. This observation aligns with the potential formation of charge transfer complexes and defect states within the band gap. These defect states, possibly arising from increased disorder due to SnO2 inclusion, could facilitate electron movement between VB and CB. Additionally, the lower Eg of SnO2 nanoparticles compared to HPMC/PEDOT:PSS might contribute to the overall reduction in the nanocomposite's band gap.5 The observed decrease in Eg suggests that the nanocomposite films exhibit enhanced semiconducting behavior upon SnO2 nanoparticle incorporation. This could potentially translate to the formation of more efficient 3D conducting networks within the material.15
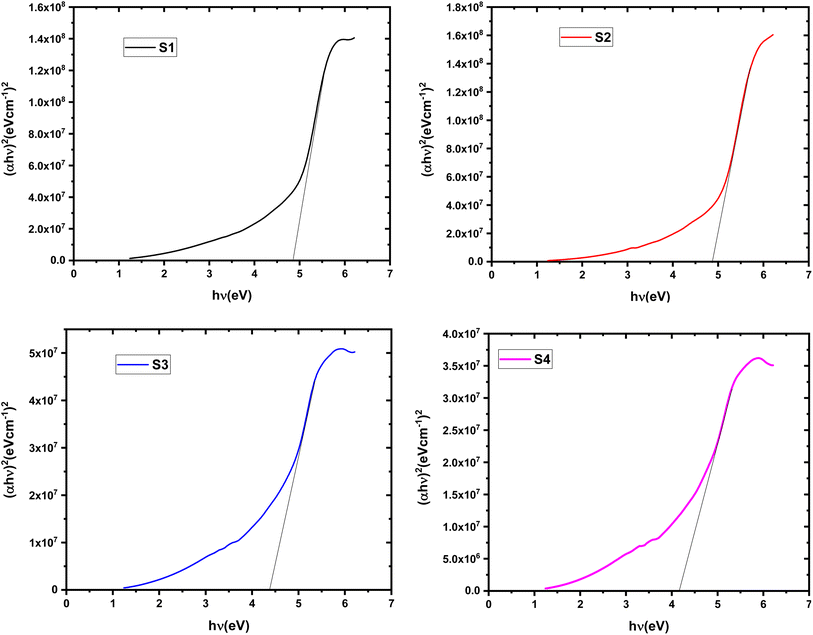 |
| | Fig. 6 Tauc plot for determining the direct band gap (Edg) of HPMC/PEDOT:PSS composites with varying SnO2 nanoparticle loadings. | |
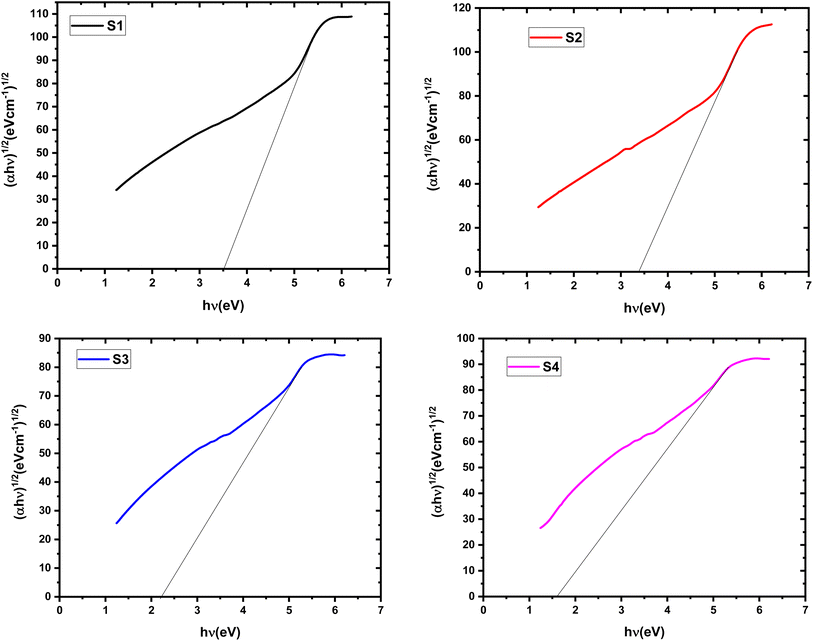 |
| | Fig. 7 Tauc plot for determining the indirect band gap (Eig) of HPMC/PEDOT:PSS composites with varying SnO2 nanoparticle loadings. | |
Table 2 Energy gap, refractive index, and AC conductivity for the prepared samples
| Samples |
Description |
Edg (eV) |
Eig (eV) |
n0 |
AC conductivity (S cm−1) at 10 Hz |
S |
| S1 |
HPMC/PEDOT:PSS |
4.92 |
3.52 |
2.07 |
1.85 × 10⁻¹² |
0.85 |
| S2 |
HPMC/PEDOT:PSS-0.003 SnO2 NPs |
4.85 |
3.43 |
2.81 |
1.32 × 10⁻¹¹ |
0.78 |
| S3 |
HPMC/PEDOT:PSS-0.005 SnO2 NPs |
4.41 |
2.25 |
3.25 |
7.46 × 10⁻¹¹ |
0.66 |
| S4 |
HPMC/PEDOT:PSS-0.007 SnO2 NPs |
4.26 |
1.68 |
3.54 |
1.04 × 10⁻⁹ |
0.52 |
The linear refractive index (n0) of the nanocomposite films was estimated using an empirical relationship established by Dimitrov and Sakka,21 and based on the indirectly derived band gap values (Egi) (Table 2).
| |
 | (4) |
This equation suggests an inverse proportionality between n₀ and Egi, which is consistent with the observed trends. Our data reveals an improvement in n₀ upon incorporation of SnO2 nanoparticles. The HPMC/PEDOT:PSS/0.007 g SnO2 NPs sample exhibits the highest n₀ value. These variations in the optical properties can be attributed to the internal structure of the material, including factors like molecular weight distribution and packing density. The introduction of SnO2 nanoparticles as a nanofiller might have increased the degree of disorder within the composite. This, in turn, could potentially enhance the mobility of free radicals within the material. As free radicals are inherently dynamic, their increased movement might lead to a rise in excited states, ultimately contributing to the observed improvement in n0 for the doped samples.22 The enhanced n0 values make these nanocomposite films promising candidates for applications requiring high refractive index materials, such as high-performance lenses or antireflection coatings.23
3.5. Electrical conductivity
The frequency dependence of electrical conductivity is a well-known characteristic of amorphous polymer composites. This phenomenon arises from the interplay between the polymeric matrix and the charge carriers within it. The mobility of these charge carriers can be influenced by the frequency of the applied electric field. To assess the AC conductivity of the samples, a sinusoidal voltage with varying frequencies (f) is employed. The response of the material to this alternating voltage is measured by monitoring the current that flows through it. This current measurement includes both its amplitude and the phase shift relative to the applied voltage. By analyzing this current response, the AC conductivity (σ(f)) can be calculated using the following equation:24| |
σac = 2πfε′ε0![[thin space (1/6-em)]](https://www.rsc.org/images/entities/char_2009.gif) tan tan![[thin space (1/6-em)]](https://www.rsc.org/images/entities/char_2009.gif) δ δ
| (5) |
where, f represents the frequency, ε′ denotes the measured dielectric constant, and ε0 is the permittivity of free space. Fig. 8 depicts the frequency dependence of σ for the HPMC/PEDOT:PSS composites containing varying weight percentages of SnO2 nanoparticles, measured at room temperature. The data reveals a clear trend of increasing conductivity with increasing SnO2 content. This observation suggests that the well-dispersed SnO2 nanoparticles contribute to the formation of additional conductive pathways within the composite. The overall conductivity of these nanocomposites likely depends on several factors, including the type, morphology (shape and size), and spatial distribution of the nanofillers within the polymer matrix.25 The observed conductivity enhancement might be attributed to a combination of two mechanisms. First, the SnO2 nanoparticles themselves may introduce additional charge carriers into the system. Second, the incorporation of SnO2 could potentially increase the amorphous character of the polymer matrix. This, in turn, could facilitate the movement of ions by lowering the energy barriers associated with their transport.26 Fig. 8 illustrates the dependence of electrical conductivity on frequency for the prepared HPMC/PEDOT:PSS nanocomposite films. The data reveals a clear trend of increasing conductivity with increasing frequency for all samples. This observation suggests a frequency-dependent behavior, particularly at higher frequencies. The observed behavior aligns with the power-law relationship proposed by Jonscher for electrical conductivity in many materials:27
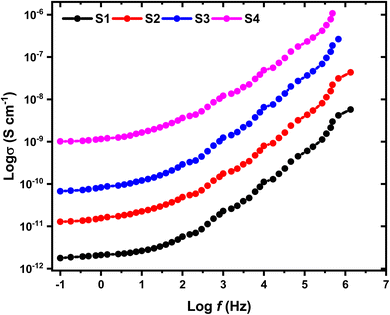 |
| | Fig. 8 The relationship between log![[thin space (1/6-em)]](https://www.rsc.org/images/entities/char_2009.gif) σ and log σ and log![[thin space (1/6-em)]](https://www.rsc.org/images/entities/char_2009.gif) f for both HPMC/PEDOT:PSS composite films and HPMC/PEDOT:PSS films incorporating SnO2 nanoparticles. f for both HPMC/PEDOT:PSS composite films and HPMC/PEDOT:PSS films incorporating SnO2 nanoparticles. | |
In this context, σdc represents the direct current conductivity (specifically at ω = 0), A denotes a frequency-dependent coefficient, and S varies with frequency. The findings presented in Table 2 align with the correlated barrier hopping (CBH) model for electrical conduction in the films. This interpretation stems from the consistent observation that all “s” values are below 1.28,29 Additionally, the σ values for HPMC/PEDOT:PSS-SnO2 films show an increase of approximately four orders of magnitude compared to pure HPMC/PEDOT:PSS. With higher frequencies of the applied field, the conductivity of charge carriers demonstrates a linear escalation, indicating enhanced mobility at high frequencies compared to low frequencies.30 Moreover, increased dominance of the loss factor at higher frequencies contributes to a proportional enhancement in electrical conductivity within this frequency range. Similar trends have been noted in diverse polymer nanocomposites.31,32
3.6. Dielectric properties
The dielectric constant (ε′) and dielectric loss (ε′′) of a material are crucial parameters that reflect its ability to store and dissipate electrical charge. Materials with high dielectric constants can store more charge for a given electric field, making them valuable for capacitors where smaller dimensions are desired. Conversely, materials with low dielectric constants exhibit minimal energy loss at high frequencies or under high power conditions, minimizing power loss in these applications.33 These contrasting properties highlight the importance of understanding dielectric behavior when selecting materials for specific functionalities. The following equation outlines the calculation for both dielectric constant and loss:34| |
 | (7) |
| |
 | (8) |
In the investigation of HPMC/PEDOT nanocomposites, Fig. 9 and 10 illustrate the variation of ε′ and ε′′ with frequency at room temperature, where A and d denote the sample's area and thickness, and C represents the sample capacitance. The findings indicate distinct behaviors based on the concentration of SnO2 NPs relative to their percolation threshold. Samples containing SnO2 NPs above the percolation threshold show a significant decrease in both ε′ and ε′′ as frequency increases, ultimately stabilizing at lower values. In contrast, samples with SnO2 NP concentrations below this threshold exhibit relatively constant ε′ and ε′′ values. This trend suggests that electrode and interface effects, predominant in significant parts of the sample, contribute to the observed high dielectric constants at low frequencies. Additionally, for polar materials, initial dielectric values tend to be high but diminish as the frequency of the electric field increases due to limitations in dipole alignment with field fluctuations.35 Moreover, the incorporation of SnO2 NPs enhances ε′ and ε′′ values across all frequency ranges due to the introduction of polar groups. SnO2 NPs act as nanocapacitors within the insulating matrix, and as their concentration in the composites increases, these nanocapacitors become more prominent, thereby augmenting the overall capacitance (i.e., dielectric constant).36 Furthermore, nanofillers are known to alleviate restrictions on dipole responsiveness to applied electric fields, thereby further enhancing the dielectric constant.37
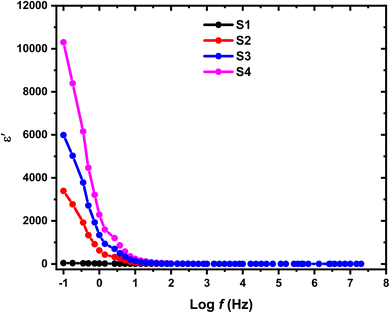 |
| | Fig. 9 Variation in dielectric constant (ε′) with log(f) for HPMC/PEDOT:PSS composite and HPMC/PEDOT:PSS loaded with SnO2 NPs. | |
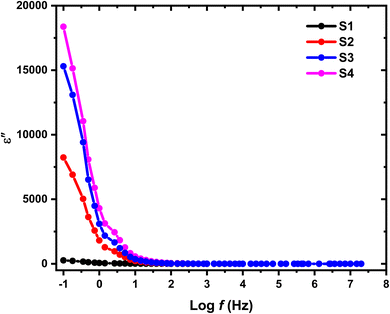 |
| | Fig. 10 Variation in dielectric loss (ε′′) with log(f) for HPMC/PEDOT:PSS composite and HPMC/PEDOT:PSS loaded with SnO2 NPs. | |
3.7. Complex electric modulus
The study of dielectric spectra often involves the use of advanced mathematical functions like complex electric modulus (M*) and complex impedance (Z*).38 These functions provide crucial insights into how materials behave electrically at different frequencies. Complex impedance (Z*) is particularly effective for studying systems dominated by long-range charge transport, typical of resistive or capacitive materials. On the other hand, complex electric modulus (M*) is preferred when the material primarily exhibits localized relaxation processes as its main electrical response. The equation below illustrates the determination of complex electric modulus (M*):39| |
 | (9) |
Fig. 11 and 12 depict the variations of M′ and M′′ with the applied electric field frequency (presented on a logarithmic scale) for the investigated films. The observed changes in M′ exhibit a sigmoidal-shaped curve. This behavior suggests that capacitive behavior dominates the electrical response at low frequencies. In other words, the films exhibit a high initial ability to store electrical energy. Interestingly, the M′ values decrease with increasing SnO2 nanoparticle concentration. This trend implies a potential improvement in the real component (storage capability) of the dielectric constant at higher nanoparticle loadings. Fig. 12 presents the variations in the imaginary component of the electric modulus (M′′) with frequency for the investigated films. A prominent relaxation peak is observed in these curves. Interestingly, the magnitude of this peak decreases with increasing SnO2 nanoparticle concentration. The presence of relaxation peaks in the M′′ spectra is often associated with the existence of ionic conductivity within the material. The observed peak's significant height and asymmetry suggest a distribution of relaxation times within the films. This behavior deviates from an ideal Debye-type relaxation process, which assumes a single, well-defined relaxation time.40 At frequencies lower than the peak frequency observed in M′′, the M′′ response suggests a dominance of DC conductivity. This likely involves the long-range movement of charge carriers through hopping mechanisms.41 In contrast, at frequencies exceeding the peak, the M′′ behavior indicates a shift towards AC conductivity. Here, ions become confined within potential wells, and their motion becomes restricted to short distances within these confined regions. Consequently, the peak frequency in the M′′ spectra can be interpreted as a transition point. As the applied field frequency increases, the mobility of charge carriers changes from long-range (at lower frequencies) to short-range (at higher frequencies).
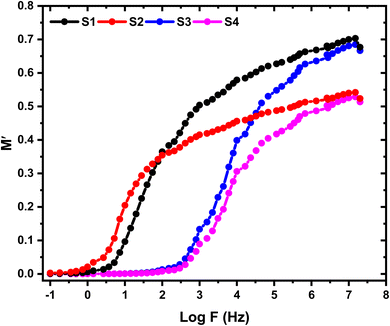 |
| | Fig. 11 Frequency dependence of M′ for the pristine HPMC/PEDOT:PSS composite and HPMC/PEDOT:PSS nanocomposites containing various loadings of SnO2 nanoparticles. | |
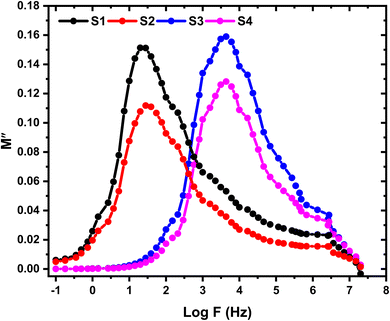 |
| | Fig. 12 Frequency dependence of M′′ for the pristine HPMC/PEDOT:PSS composite and HPMC/PEDOT:PSS nanocomposites containing various loadings of SnO2 nanoparticles. | |
3.8. Argand plot
Fig. 13 presents the Argand plots for the HPMC/PEDOT:PSS composite and HPMC/PEDOT:PSS nanocomposites containing varying SnO2 nanoparticle concentrations. An Argand plot visualizes the relationship between the real (M′) and imaginary (M′′) components of the electric modulus. Ideal Debye-type relaxations, characterized by a single relaxation time, appear as perfect semicircles in the Argand plot. However, polymers often exhibit a distribution of relaxation times, leading to a depressed semicircular arc.42 The center of this arc, located on the M′ axis, represents a characteristic relaxation time for the material. The length of this depressed semicircle has been associated with the material's conductivity. Shorter arc lengths tend to indicate higher conductivity.43 In Fig. 13, we observe a subtle decrease in the arc length with increasing SnO2 concentrations, suggesting a potential improvement in conductivity for these nanocomposites. Furthermore, the movement of the Argand plots towards the origin at higher filler loadings further supports this trend. The observed deviation from ideal Debye behavior likely arises from the presence of multiple polarization mechanisms, diverse relaxation processes within the material, and various interactions between ions and dipoles within the nanocomposite.
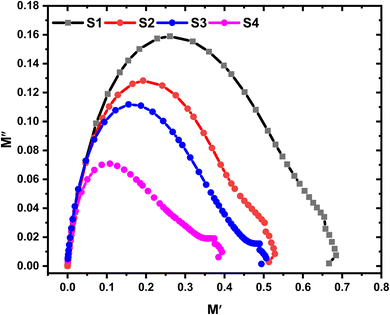 |
| | Fig. 13 Argand plot for HPMC/PEDOT:PSS ternary blend and HPMC/PEDOT:PSS loaded with SnO2 NPs. | |
4. Conclusion
A solution casting method was utilized to create nanocomposite films. These films incorporated varying concentrations of SnO2 nanoparticles dispersed within a matrix composed of HPMC and PEDOT:PSS. X-ray diffraction (XRD) analysis confirmed the presence of tetragonal SnO2 NPs with sizes ranging from 26 to 43 nm. Interestingly, the XRD results also revealed a decrease in the crystallinity of the SnO2 NPs upon incorporation into the HPMC/PEDOT:PSS composite. Fourier-transform infrared spectroscopy (FTIR) analysis of the nanocomposites indicated changes in the vibrational peak positions following the introduction of SnO2 NPs. This suggests potential interactions between the polymer matrix and the nanoparticles. UV-visible spectroscopy measurements revealed a decrease in the optical bandgap of the nanocomposites with increasing SnO2 NP content. This finding suggests a potential for bandgap engineering through the controlled incorporation of nanoparticles. The combined analysis using XRD, UV-visible spectroscopy, and FTIR techniques highlights the complex interactions occurring within the nanocomposites upon SnO2 NP incorporation. Furthermore, the research demonstrates that the nanocomposites exhibit improved dielectric properties and AC electrical conductivity at room temperature with increasing SnO2 NP concentration. These findings, coupled with the observed tunable optical properties, suggest the potential of these nanocomposites for applications in optoelectronic devices.
Data availability
The data that support the findings of this study are available from the corresponding author upon reasonable request.
Author contributions
H. M. Ragab: methodology, formal analysis, investigation, writing – review & editing. N. S. Diab: investigation, writing – review & editing. Shimaa Mohammed Aboelnaga: methodology, formal analysis, investigation. Jumana N. Dawoud: methodology, formal analysis, investigation, writing – review & editing. Mahmoud AlElaimi: investigation, writing – review & editing. M. O. Farea: investigation, writing – review & editing.
Conflicts of interest
There are no conflicts to declare.
Acknowledgements
This research has been funded by Scientific Research Deanship at University of Ha'il – Saudi Arabia through project number RG-24 069.
References
- E. Salim and A. Tarabiah, The influence of NiO nanoparticles on structural, optical and dielectric properties of CMC/PVA/PEDOT:PSS nanocomposites, J. Inorg. Organomet. Polym. Mater., 2023, 33(6), 1638–1645 CrossRef CAS
 .
. - E. Salim, Charge extraction enhancement in hybrid solar cells using n-ZnO/p-NiO nanoparticles, J. Mater. Sci.: Mater. Electron., 2021, 32(24), 28830–28839 CrossRef CAS
 .
. - A. Saeed, et al., Structural, optical, and electrical characteristics of HPMC/PVA-I2O5 composites: fabrication and performance analysis for energy storage applications, J. Energy Storage, 2024, 96, 112765 CrossRef
 .
. - S. Suma and Y. Sangappa, Optical, mechanical and electrical properties of HPMC-AuNPs nanocomposite films, Mater. Today: Proc., 2022, 66, 2075–2079 CAS
 .
. - A. Yassin, et al., Incorporated Au/Se nanoparticles into HPMC/CMC blend for enhancing structural, optical and morphological properties: hybrid nanocomposites for optoelectronic applications, Opt. Mater., 2024, 115721 CrossRef CAS
 .
. - K. Sun, et al., Review on application of PEDOTs and PEDOT:PSS in energy conversion and storage devices, J. Mater. Sci.: Mater. Electron., 2015, 26, 4438–4462 CrossRef CAS
 .
. - K. Sun, et al., Transparent conductive oxide-free perovskite solar cells with PEDOT:PSS as transparent electrode, ACS Appl. Mater. Interfaces, 2015, 7(28), 15314–15320 CrossRef CAS PubMed
 .
. - T. Yang, et al., Facile synthesis of SnO2 nanoparticles for improved formaldehyde detection, New J. Chem., 2018, 42(16), 13612–13618 RSC
 .
. - S. Vidhya, O. Balasundaram and M. Chandramohan, Structural and optical investigations of gallium doped tin oxide thin films prepared by spray pyrolysis, J. Saudi Chem. Soc., 2016, 20(6), 703–710 CrossRef CAS
 .
. - N. Touidjen, et al., SnO2 thin film synthesis for organic vapors sensing at ambient temperature, Sens. Bio-Sens. Res., 2016, 11, 52–57 CrossRef
 .
. - S.-C. Shi, J.-Y. Wu and T.-F. Huang, Raman, FTIR, and XRD study of MoS2 enhanced hydroxypropyl methylcellulose green lubricant, Opt. Quant. Electron., 2016, 48, 1–9 CrossRef
 .
. - A. Tawansi, et al., Optical and electrical properties of NiCl2 filled PVC films, Phys. Scr., 1997, 55(2), 243 CrossRef CAS
 .
. - A. Tarabiah, et al., Enhanced structural, optical, electrical properties and antibacterial activity of PEO/CMC doped ZnO nanorods for energy storage and food packaging applications, J. Polym. Res., 2022, 29(5), 167 CrossRef CAS
 .
. - S. Kumar, T. Demappa and J. Sannappa, Influence of KI salt concentration on the hydroxypropyl methylcellulose films: optical study, Opt. Mater., 2022, 129, 112474 CrossRef CAS
 .
. - M. Morsi, et al., Hybrid MWCNTs/Ag nanofiller reinforced PVP/CMC blend-based polymer nanocomposites for multifunctional optoelectronic and nanodielectric applications, J. Polym. Environ., 2023, 31(2), 664–676 CrossRef CAS
 .
. - A. M. El Sayed and S. Saber, Structural, optical analysis, and Poole–Frenkel emission in NiO/CMC–PVP: Bio-nanocomposites for optoelectronic applications, J. Phys. Chem. Solid., 2022, 163, 110590 CrossRef CAS
 .
. - M. Farea, et al., Gamma irradiation boosted the optical and electrical properties of PVP/NaAlg/Au ternary nanocomposite films for flexible optoelectronic devices, Polym. Bull., 2023, 80(8), 9195–9215 CrossRef CAS
 .
. - P. Dhatarwal and R. Sengwa, Poly (vinyl pyrrolidone) matrix and SiO2, Al2O3, SnO2, ZnO, and TiO2 nanofillers comprise biodegradable nanocomposites of controllable optical properties for optoelectronic applications, Optik, 2021, 241, 167215 CrossRef CAS
 .
. - A. Al-Muntaser, et al., α-MoO3 nanobelts/CMC-PVA nanocomposites: hybrid materials for optoelectronic and dielectric applications, J. Polym. Res., 2022, 29(7), 274 CrossRef CAS
 .
. - L. H. Gaabour, Effect of selenium oxide nanofiller on the structural, thermal and dielectric properties of CMC/PVP nanocomposites, J. Mater. Res. Technol., 2020, 9(3), 4319–4325 CrossRef CAS
 .
. - H. Ragab, Influence of α–Hematite Nanorods (αFe2O3 NRs) on the Optical, Magnetic, and Electrical Properties of PEO/NaAlg Blend for Magneto-Optical Applications, J. Inorg. Organomet. Polym. Mater., 2023, 33(2), 484–494 CrossRef CAS
 .
. - P. Dhatarwal, R. Sengwa and S. Choudhary, Multifunctional (PVP/PEO)/SnO2 nanocomposites of tunable optical and dielectric properties, Optik, 2020, 221, 165368 CrossRef CAS
 .
. - S. Choudhary, Structural, optical, dielectric and electrical properties of (PEO–PVP)–ZnO nanocomposites, J. Phys. Chem. Solid., 2018, 121, 196–209 CrossRef CAS
 .
. - N. Diab, et al., Influence of cesium bromide nanoparticles on the structural, optical, electrical, and antibacterial properties
of polyvinyl alcohol/sodium alginate for biological applications, J. Vinyl Addit. Technol., 2024, 30(3), 801–813 CrossRef CAS
 .
. - H. Ragab and M. Farea, Structural, optical, and electrical enhancement of polyethylene oxide (PEO) and sodium alginate (NaAlg) through embedding silver nanoparticles (Ag NP) for optoelectrical applications, J. Mater. Sci.: Mater. Electron., 2023, 34(31), 2079 CrossRef CAS
 .
. - E. Salim and A. Tarabiah, The Influence of NiO Nanoparticles on Structural, Optical and Dielectric Properties of CMC/PVA/PEDOT:PSS Nanocomposites, J. Inorg. Organomet. Polym. Mater., 2023, 1–8 Search PubMed
 .
. - M. Morsi, et al., Hybrid MWCNTs/Ag nanofiller reinforced PVP/CMC blend-based polymer nanocomposites for multifunctional optoelectronic and nanodielectric applications, J. Polym. Environ., 2023, 31(2), 664–676 CrossRef CAS
 .
. - A. Waly, A. Abdelghany and A. Tarabiah, Study the structure of selenium modified polyethylene oxide/polyvinyl alcohol (PEO/PVA) polymer blend, J. Mater. Res. Technol., 2021, 14, 2962–2969 CrossRef CAS
 .
. - H. A. Alsalmah, et al., Hybrid GO/TiO2 nanoparticles reinforced NaAlg/PVA blend: nanocomposites for high-performance energy storage devices, Polym. Adv. Technol., 2023, 34(9), 2831–2840 CrossRef CAS
 .
. - K. Hemalatha, et al., Temperature dependent dielectric and conductivity studies of polyvinyl alcohol-ZnO nanocomposite films by impedance spectroscopy, J. Appl. Phys., 2015, 118(15), 154103 CrossRef
 .
. - M. Yang, et al., Largely enhanced dielectric constant of PVDF nanocomposites through a core–shell strategy, Phys. Chem. Chem. Phys., 2018, 20(4), 2777–2786 RSC
 .
. - H. Ragab, et al., Effect of CsBr on the optical properties and electrical conductivity of PVP/PVA composite for flexible optoelectronic devices, Inorg. Chem. Commun., 2024, 159, 111741 CrossRef CAS
 .
. - E. Campo, 4—Electrical Properties of Polymeric Materials, Selection of polymeric materials, 2008, p. 141–173 Search PubMed
 .
. - G. A. AlZaidy, Boosting of the Optical Properties, and Electrical Conductivity of Polymethyl Methacrylate (PMMA)/Polystyrene (PS) Blend with Zinc Oxide Nanoparticles for High-Performance Energy Storage Devices, J. Inorg. Organomet. Polym. Mater., 2024, 1–12 Search PubMed
 .
. - E. M. Abdelrazek, et al., Mechanical and electrical studies of PVA/PVP blend filled with MWCNTs, Polym. Bull., 2023, 80(6), 6693–6706 CrossRef CAS
 .
. - M. Islam, et al., High density polyethylene and metal oxides based nanocomposites for high voltage cable application, J. Appl. Polym. Sci., 2022, 139(11), 51787 CrossRef CAS
 .
. - G. A. AlZaidy, Impact of hybrid aluminum oxide/titanium dioxide nanoparticles on the structural, optical, and electrical properties of polyvinyl alcohol/polyethylene glycol nanocomposites for flexible optoelectronic devices, Ceram. Int., 2024, 50(13), 23483–23492 CrossRef CAS
 .
. - A. K. Jonscher, Dielectric relaxation in solids, J. Phys. D: Appl. Phys., 1999, 32(14), R57 CrossRef CAS
 .
. - W. Alharbi, et al., Modification and development in the microstructure of carboxy methyl cellulose-TiO2/Cr2O3 nanocomposites films for optoelectrical applications, Inorg. Chem. Commun., 2024, 159, 111700 CrossRef CAS
 .
. - J. Isasi, et al., Structural Characterization and Electrical Properties of a Novel Defect Pyrochlore, J. Solid State Chem., 1995, 116(2), 290–295 CrossRef CAS
 .
. - G. E. El-Falaky, O. W. Guirguis and N. S. Abd El-Aal, A.C. conductivity and relaxation dynamics in zinc–borate glasses, Prog. Nat. Sci., 2012, 22(2), 86–93 CrossRef
 .
. - M. El-Morsy, et al., Fabrication of (Al2O3/CdO) metal and ceramic matrix composites reinforced CMC via laser ablation for optoelectronic applications, Mater. Chem. Phys., 2024, 312, 128659 CrossRef CAS
 .
. - M. A. Jothi, et al., Investigations of lithium ion conducting polymer blend electrolytes using biodegradable cornstarch and PVP, Phys. B, 2020, 580, 411940 CrossRef
 .
.
|
| This journal is © The Royal Society of Chemistry 2024 |
Click here to see how this site uses Cookies. View our privacy policy here.  Open Access Article
 *a,
N. S. Diaba,
Jumana N. Dawouda,
Mahmoud AlElaimia,
Shimaa Mohammed Aboelnagaa and
M. O. Fareab
![[thin space (1/6-em)]](https://www.rsc.org/images/entities/char_2009.gif) 400 g mol−1 and poly(3,4-ethylenedioxythiophene) polystyrene sulfonate (PEDOT:PSS) as a 1.3 wt% dispersion in water with a conductivity of 1 S cm−1 were also obtained from the same supplier.
400 g mol−1 and poly(3,4-ethylenedioxythiophene) polystyrene sulfonate (PEDOT:PSS) as a 1.3 wt% dispersion in water with a conductivity of 1 S cm−1 were also obtained from the same supplier.


![[double bond, length as m-dash]](https://www.rsc.org/images/entities/char_e001.gif) C stretching) and 3471 cm−1 (OH stretching).1 A more detailed peak assignment is provided in Table 1. Interestingly, the incorporation of SnO2 NPs resulted in subtle changes to the overall FT-IR profile. Notably, a new peak emerged at 468 cm−1, attributed to Sn–O vibrational modes, and its intensity increased with higher SnO2 concentration. This observation suggests successful interaction between the HPMC/PEDOT:PSS blend and the SnO2 nanoparticles. Further analysis of these spectral shifts, particularly for characteristic bands of the polymer components, can provide valuable insights into how the SnO2 filler influences the structural composition of the interpolymer matrix. It's important to note that the presence of double bond segments within the composite structure might be advantageous. These segments could potentially serve as preferential sites for polarons and bipolarons, which can act as charge carriers and contribute to the electrical properties of the nanocomposite.12
C stretching) and 3471 cm−1 (OH stretching).1 A more detailed peak assignment is provided in Table 1. Interestingly, the incorporation of SnO2 NPs resulted in subtle changes to the overall FT-IR profile. Notably, a new peak emerged at 468 cm−1, attributed to Sn–O vibrational modes, and its intensity increased with higher SnO2 concentration. This observation suggests successful interaction between the HPMC/PEDOT:PSS blend and the SnO2 nanoparticles. Further analysis of these spectral shifts, particularly for characteristic bands of the polymer components, can provide valuable insights into how the SnO2 filler influences the structural composition of the interpolymer matrix. It's important to note that the presence of double bond segments within the composite structure might be advantageous. These segments could potentially serve as preferential sites for polarons and bipolarons, which can act as charge carriers and contribute to the electrical properties of the nanocomposite.12
![[double bond, length as m-dash]](https://www.rsc.org/images/entities/char_e001.gif) C stretching
C stretching


![[thin space (1/6-em)]](https://www.rsc.org/images/entities/char_2009.gif) tan
tan![[thin space (1/6-em)]](https://www.rsc.org/images/entities/char_2009.gif) δ
δ

![[thin space (1/6-em)]](https://www.rsc.org/images/entities/char_2009.gif) σ and log
σ and log![[thin space (1/6-em)]](https://www.rsc.org/images/entities/char_2009.gif) f for both HPMC/PEDOT:PSS composite films and HPMC/PEDOT:PSS films incorporating SnO2 nanoparticles.
f for both HPMC/PEDOT:PSS composite films and HPMC/PEDOT:PSS films incorporating SnO2 nanoparticles.


.
.
.
.
.
.
.
.
.
.
.
.
.
.
.
.
.
.
.
.
.
.
.
.
.
.
.
.
.
.
.
.
.
.
.
.
.
.
.
.
.
.
.


