 Open Access Article
Hierarchical porous carbon derived from petroleum coke via one-step chemical activation for the fabrication of a supercapacitor and real time clock application
Santhi Maria Benoyab,
Abhishek Hazarikaab,
Akhil Rajbongshia,
Mousumi Boraab and
Binoy K. Saikia *ab
*ab
aCoal & Energy Division, CSIR-North East Institute of Science & Technology, Jorhat 785006, India. E-mail: bksaikia@gmail.com; bksaikia@neist.res.in
bAcademy of Scientific & Innovative Research (AcSIR), Ghaziabad 201002, India
First published on 8th July 2024
Abstract
The escalating demand for energy requires highly efficient energy storage devices and advanced materials. Low-cost carbon resources and their derivatives have always been a topical research area. Petroleum coke is an abundant and affordable resource that contributes to the scalability and cost effectiveness of carbon materials. Porous carbon derivatives have acquired great attention for energy storage and conversion owing to their large surface area, environmental friendliness, exceptional electrical conductivity, and economic viability. Thus, in this work, we directly synthesized hierarchical porous carbon materials from oil refinery petroleum coke (pet-coke) using a single-step KOH activation method to utilize them for the fabrication of a coin cell supercapacitor for electronic application. The synthesized pet-coke based porous carbon shows a high specific surface area (1108 m2 g−1) and excellent porosity. After conducting extensive electrochemical analysis, it shows promising specific capacitances of 170 and 70 F g−1 in aqueous and organic electrolytes, respectively. Further, a coin cell supercapacitor was fabricated using the pet-coke derived porous carbon in an organic electrolyte with a potential window of 2.7 V, demonstrating superior rate capability and durability. The calculated energy and power density of the fabricated coin cell indicate its favorable supercapacitor application to act as a backup power source for real time clock (RTC) application in electronics.
1. Introduction
The global high energy demand is attributed to the population explosion and the rapid development of electronic devices. Energy consumption has increased rapidly and is much worsened by the depletion of fossil fuels. Therefore, energy derived from intermittent renewable sources has to be stored and supplied systematically and economically, thus triggering the development of different types of electrochemical energy storage devices that can harvest energy on different scales and apply it to various sustainable energy applications. Supercapacitors, second generation batteries, fuel cells, and superconducting magnetic storage devices are significant electrochemical energy storage devices.1 Among them, supercapacitors, batteries, and their hybrids have attained the most attention considering their specific energy, power properties, and environmental friendliness.Supercapacitors have attained their spotlight owing to their high power-density, durability, quick charge–discharge cycles, and high efficiency. Their inherent safety, eco-friendliness and cost-effectiveness add to these advantages.1 This electrochemical energy storage device is applicable when the preferred choice of application requires quick energy usage, such as electric vehicles, satellites, electronic gadgets, and robots.2 Supercapacitors are categorized into pseudocapacitors and electric double-layer capacitors (EDLCs). A pseudocapacitor stores energy via a faradaic reaction and an EDLC via a non-faradic reaction. Electric double-layer capacitors (EDLCs) employ an induced electro-ionic charge storage system, whereas pseudocapacitors rely on faradaic redox reactions occurring solely at the electrode–electrolyte interface within the electroactive phase.3 A supercapacitor consists of an electrode material, electrolyte, separator, and current collector, in which the crucial component of the supercapacitor is the electrode material.
Carbon derivatives are some of the major electrode materials used for supercapacitors. Their unique features such as large surface area, tunable porosity, economic feasibility, excellent electrochemical stability, and high electrical conductivity make them superior.4 Materials such as graphene, onion-like carbon, carbon nanotubes, and porous carbon are widely explored as EDLC materials. Porous carbon has been widely used as an electrode material for EDLCs because of its large surface area, porosity, high electrical conductivity, wide range of application temperature and low cost.5 Since there is a rising demand for porous carbon, production of the same on a large-scale under sustainable conditions must be seen as an essential challenge. The electrochemical properties of porous carbon depend on the porosity distribution and surface properties of the material.
Generally, various raw materials are available for synthesizing porous carbon, including cellulose, rice husk, bio-mass, coal, petroleum coke, coconut shell, etc.6 Out of them, petroleum coke is a widely available oil refinery by-product which is a black solid residue formed through the delayed or fluidized coking processes of cracking and carbonizing petroleum-derived raw materials like pitch, tar and vacuum bottom oil.7 During the refining process of crude oil, the residual black granular solid carbon material generated loses its utility and significance within the oil refinement domain. Although historically utilized in aluminum smelting and as a fuel source in various metallurgical and brick manufacturing operations, its environmental repercussions are considerable. Owing to the accelerated escalation of greenhouse gas emissions, several leading consumers of petroleum coke (pet-coke) globally have implemented prohibitions on its importation for utilization as a fuel source in steel and power generation facilities.8 Besides, the microscopic particles of these pollutants enter the circulatory system through the lungs, leading to difficulties in breathing and of the heart. Pet-coke has a harmful impact on aquatic life when introduced into water.9 Factors like high carbon content, low ash content, low price and no carbonization required before activation make petroleum coke a suitable precursor for the porous carbon synthesis.10 Thus, it is crucial to prepare porous carbon with a high energy density using petroleum coke for use in commercial supercapacitors. It is significant to pursue the engineering of pet-coke derived porous carbon with a scalable activation method with lesser steps that can produce a commercially worth product for use in non-aqueous supercapacitors.
In this innovative study, we have developed a simple single-step chemical activation process for preparing porous carbon by using easily available petroleum coke (pet-coke) obtained from oil refineries in Assam (northeast India) for its application as an electrode material in a coin cell supercapacitor. Pet-coke samples were collected from two oil refineries, and the impact of direct KOH activation on their chemical, structural, and textural properties was also extensively analyzed. The electrochemical properties of the synthesized porous carbon are studied in an aqueous electrolyte, and a symmetric electric double layer (EDLC) coin cell is fabricated using an organic electrolyte from the porous carbon material for power applications. The electrochemical performances were analysed using CV, GCD, and EIS, and the cycling stability was studied for 10![[thin space (1/6-em)]](https://www.rsc.org/images/entities/char_2009.gif) 000 cycles. The effect of pore size on electrochemical performances is thoroughly discussed in this work. The fabricated supercapacitor coin cell is further applied as a power source in a real time clock (RTC) module that has everyday applications in today's electronics sector and is not explored using supercapacitors yet. The schematic illustration of the complete work done is given in Fig. 1.
000 cycles. The effect of pore size on electrochemical performances is thoroughly discussed in this work. The fabricated supercapacitor coin cell is further applied as a power source in a real time clock (RTC) module that has everyday applications in today's electronics sector and is not explored using supercapacitors yet. The schematic illustration of the complete work done is given in Fig. 1.
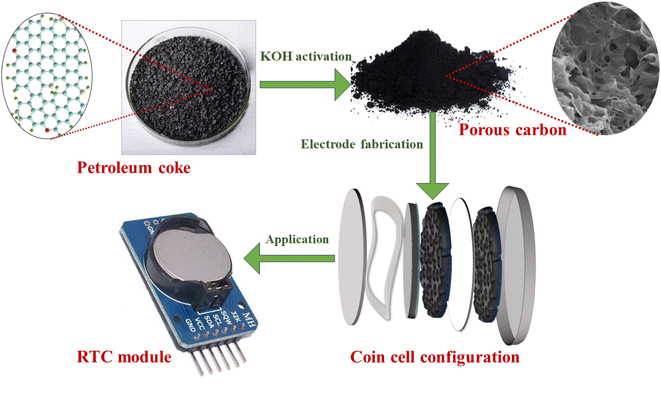 | ||
| Fig. 1 Schematic representation of the synthesis process, electrode fabrication, and testing of the coin cell supercapacitor in a RTC. | ||
2. Experimental section
2.1 Raw materials
The petroleum coke samples (PG and PR) were obtained from two oil refineries in Assam (northeast India). The chemicals used were potassium hydroxide (KOH; Merk), hydrofluoric acid (HF; Molychem), hydrochloric acid (HCl; Rankem; LR), carbon black (Sigma Aldrich), polytetrafluoroethylene (PTFE; Matlabs), acetonitrile (C2H5OH; 98%, Molychem), tetraethylammonium tetrafluoroborate ((C2H5)4NBF4; 99%, Alfa Aesar), polyvinylidene fluoride (PVDF, Alfa Aesar), 1-methyl-2-pyrrolidone (NMP; Sigma-Aldrich), and Whatman microfiber filter paper.2.2 Synthesis of porous carbon from pet-coke
The pet-coke samples underwent grinding in a jaw crusher (rotary beater mill SR 300) until reaching a size of ≤500 microns, followed by sieving using a vibratory sieve shaker (AS2000) to achieve a size of ≤150 microns. Subsequently, the fine petroleum coke powder was washed with distilled water and dried overnight at 100 °C. The dried powder was then mixed with KOH in a 1![[thin space (1/6-em)]](https://www.rsc.org/images/entities/char_2009.gif) :
:![[thin space (1/6-em)]](https://www.rsc.org/images/entities/char_2009.gif) 4 ratio and activated at 800 °C for 1 hour in a nitrogen atmosphere. The resulting product underwent further purification with diluted HCl and HF, followed by rinsing with distilled water until achieving a neutral pH. Finally, the synthesized hierarchical porous carbons were dried overnight at 100 °C for subsequent analysis.
4 ratio and activated at 800 °C for 1 hour in a nitrogen atmosphere. The resulting product underwent further purification with diluted HCl and HF, followed by rinsing with distilled water until achieving a neutral pH. Finally, the synthesized hierarchical porous carbons were dried overnight at 100 °C for subsequent analysis.
2.3 Analytical characterization
The structural aspects of pet-coke and the derived porous carbons were evaluated using an X-ray diffractometer (XRD, Bruker D8 Advance) with Cu Kα radiation (wavelength = 1.54056 Å) by recording diffraction angles in the range of 5°–80° with a scan rate of 0°–2° minute−1. The graphitization degree of the porous carbons was analyzed using a Raman spectrometer (Thermo-Scientific DXR2 Smart Raman) with an excitation wavelength of 532 nm. The basic chemical properties of the pet-coke samples and the derived porous carbons were evaluated using the ASTMD7582-15 standard method in a thermogravimetric analyzer (Leco TGA701). The CHNS determination was done using an elemental analyser (varioMACROcube: 2010BB1028), adopting the ASTM D3176-15 standard method. The morphological properties were examined using field emission scanning-electron-microscopy (FESEM, EISS SIGMA). Microstructural and diffraction property analysis of the synthesized pet-coke based porous carbons was done using a high-resolution transmission electron microscope (HRTEM, JEOL JEM-2100 Plus). The surface functional groups in raw pet-coke and derived porous carbons were determined using a Fourier transform-infrared spectrophotometer (FT-IR, PerkinElmer Spectrum-Two). The N2 adsorption–desorption isotherms of pet-coke derived porous carbons were recorded in a Quantachrome Instruments Autosorb iQ at 77.35 K, and the specific surface area and porosity were obtained using Brunauer–Emmett–Teller (BET) analysis, and DFT was used to determine the porosity distribution. The chemical composition and chemical valence state of the carbon samples were examined by X-ray photoelectron spectroscopy (XPS, Thermo Fisher Scientific ESCALAB Xi+) with an Al Kα monochromatic X-ray source of 1486.6 eV.2.4 Measurement of electrochemical performance of the developed porous carbon electrode materials and coin cell
The electrochemical properties of the synthesized hierarchical porous carbons were analyzed in an electrochemical workstation (Biologic VSP3) using a two-electrode symmetric configuration. The electrochemical performances of the hierarchical porous carbons were studied by performing cyclic voltammetry (CV), galvanostatic charge–discharge (GCD), and electrochemical impedance spectroscopy (PEIS). To fabricate electrodes, the electroactive material (i.e., porous carbon), binder (polytetrafluoroethylene), and conductive agent (mesoporous carbon black) were mixed homogeneously in a ratio of 90![[thin space (1/6-em)]](https://www.rsc.org/images/entities/char_2009.gif) :
:![[thin space (1/6-em)]](https://www.rsc.org/images/entities/char_2009.gif) 5
5![[thin space (1/6-em)]](https://www.rsc.org/images/entities/char_2009.gif) :
:![[thin space (1/6-em)]](https://www.rsc.org/images/entities/char_2009.gif) 5 in ethanol solvent. This mixture was kneaded until it reached a state of plasticity and was rolled into a thin electrode film of nearly 50 μm. Square-shaped electrodes were cut from the thin sheet with a 0.5 mm × 0.5 mm dimension and dried overnight at 120 °C. The symmetric cells were assembled in Swagelok™ cells, using the electrodes (∼3.5 mg each) in which Whatman GF/A filter paper was sandwiched as the separator. The filling of aqueous electrolyte (6 M KOH) was done in an air atmosphere.
5 in ethanol solvent. This mixture was kneaded until it reached a state of plasticity and was rolled into a thin electrode film of nearly 50 μm. Square-shaped electrodes were cut from the thin sheet with a 0.5 mm × 0.5 mm dimension and dried overnight at 120 °C. The symmetric cells were assembled in Swagelok™ cells, using the electrodes (∼3.5 mg each) in which Whatman GF/A filter paper was sandwiched as the separator. The filling of aqueous electrolyte (6 M KOH) was done in an air atmosphere.
On the other hand, to make electrodes for the coin cell supercapacitor, the electroactive material (i.e., porous carbon), PVDF (polyvinylidene fluoride) in NMP, and mesoporous carbon black were used in a ratio of 90![[thin space (1/6-em)]](https://www.rsc.org/images/entities/char_2009.gif) :
:![[thin space (1/6-em)]](https://www.rsc.org/images/entities/char_2009.gif) 5
5![[thin space (1/6-em)]](https://www.rsc.org/images/entities/char_2009.gif) :
:![[thin space (1/6-em)]](https://www.rsc.org/images/entities/char_2009.gif) 5. In order to prepare the slurry, the PVDF binder was dissolved in NMP binder by stirring at 1000 rpm for 20 minutes in a homogenizer. After that, the conductive agent and porous carbon were added step by step and stirred at 4000 rpm for 1 hour in each step until a homogenized slurry was obtained. The homogeneous slurry was coated on an etched Al current collector using a vacuum coating machine (TOB-VFC-150) and dried overnight at 80 °C. The electrodes of 12 mm diameter were punched out in air and dried in a vacuum oven at 110 °C overnight before being transferred to a glovebox. Whatman glassy microfiber of 19 mm diameter was used as the separator, which was sandwiched in between two single-side coated electrode discs inside an LIR 2032 stainless steel coin cell. The filling of organic electrolyte was done inside a glove box in an inert atmosphere containing water and oxygen levels less than 0.1 ppm.
5. In order to prepare the slurry, the PVDF binder was dissolved in NMP binder by stirring at 1000 rpm for 20 minutes in a homogenizer. After that, the conductive agent and porous carbon were added step by step and stirred at 4000 rpm for 1 hour in each step until a homogenized slurry was obtained. The homogeneous slurry was coated on an etched Al current collector using a vacuum coating machine (TOB-VFC-150) and dried overnight at 80 °C. The electrodes of 12 mm diameter were punched out in air and dried in a vacuum oven at 110 °C overnight before being transferred to a glovebox. Whatman glassy microfiber of 19 mm diameter was used as the separator, which was sandwiched in between two single-side coated electrode discs inside an LIR 2032 stainless steel coin cell. The filling of organic electrolyte was done inside a glove box in an inert atmosphere containing water and oxygen levels less than 0.1 ppm.
The specific capacitance of hierarchical porous carbons was calculated from the discharge curve of GCD using the equation
 | (1) |
The energy (E) and power density (P) calculations were done using the equations
 | (2) |
 | (3) |
3. Results and discussion
3.1 Basic chemistry of the pet-coke and porous carbon
Both the petroleum coke samples from the Assam refineries were chemically activated using KOH to prepare high surface area porous carbon and the maximum yield obtained was approximately 42% in our process. In the process of porous carbon synthesis from pet-coke, KOH serves as an exfoliating agent and a porous network generator. During the activation process, partial etching of the carbon framework containing various potassium compounds occurs. The construction of a well-formed pore network in the final product during the activation process is also facilitated by the synthesis of H2O and CO2, which causes the carbon matrix to expand and the produced metal (K) to be effectively incorporated into it.11 Additionally, pores in the etched area could not be restored to the original architecture even after washing, resulting in high porosity and high surface area of materials.11 The activation agent, KOH, penetrates through different layers of pet-coke and distinct layered structures in addition to creating pores. In the 2D layer-like structure, the electron mobility increases and accordingly the electrochemical performances.12The proximate analysis and ultimate (CHNSO) data of raw petroleum coke samples (PG and PR) and their corresponding synthesized porous carbons (GAC and RAC) are summarised in Table 1. The paramount supremacy of the petroleum coke as a precursor for porous carbon is the high carbon content and low-ash content. The ultimate analysis (CHNSO) of raw petroleum coke reveals the presence of 92% carbon content and low volatile content (∼12%). Both raw materials also have sulfur content <1 wt%, and after KOH chemical activation, it further decreased to <0.25%. There is an evident increase in oxygen content in porous carbons, which is generally introduced during the activation process or absorbed from air.13
| Raw pet-coke and porous carbon samples | Proximate analysis (wt%) | Ultimate analysis (wt%) | |||||||
|---|---|---|---|---|---|---|---|---|---|
| Moisture | Volatile | Ash | Fixed carbon | C | H | N | O | S | |
| PG | 0.54 | 11.57 | 0.34 | 87.55 | 92.77 | 3.38 | 0.56 | 2.54 | 0.75 |
| PR | 0.45 | 12.51 | 0.14 | 86.70 | 92.55 | 3.63 | 0.62 | 2.29 | 0.91 |
| GAC | 9.19 | 10.12 | 6.08 | 74.61 | 79.55 | 0.83 | 0.33 | 19.04 | 0.25 |
| RAC | 16.28 | 9.60 | 6.85 | 67.26 | 73.15 | 1.69 | 0.18 | 24.73 | 0.13 |
3.2 Structural parameters of the pet-coke derived porous carbon
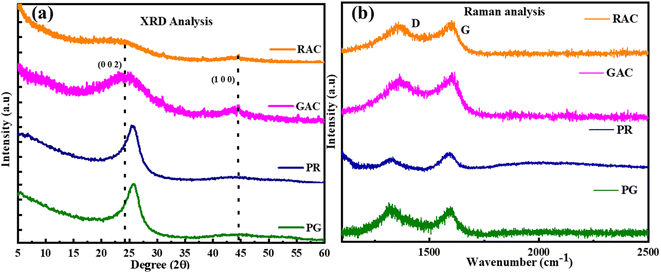
The XRD analysis of the raw pet-coke samples and chemically activated porous carbons is presented in Fig. 2a. The raw pet-coke and as obtained porous carbon samples display two characteristic peaks at 25° and 43°, which can be attributed to (002) and (100) reflections of graphitic carbon, respectively. The Bragg peak for raw petroleum coke samples is fairly narrow and sharp as compared to the synthesized porous carbon, attributed to the large crystalline structure.10 The broad (002) peaks of RAC and GAC imply the disordered structure of porous carbon which occurred during the activation and porosity generation process.1 The widening of the two diffraction peaks implies either a significant degree of edge expansion or low degree of graphitization thermal treatment. The GAC and RAC exhibit a shift of peaks with a decrease in the intensity compared to raw pet-coke samples. This can be due to the decrease in crystallite size, and distortion of the microstructure due to alkali activation.1 The pore walls in the porous carbon samples are made up of graphitic microcrystallites.14 The reduction of crystallite thickness may lead to the development of pores.14The defects and disorder in the carbon bonding network of pet-coke and as-synthesized porous carbon samples were characterized using Raman spectra (Fig. 2b). Because of the significant Raman cross-section of sp2-hybridized carbon, it becomes feasible to conduct structural analysis on minor quantities of material. The raw pet-coke samples (PG and PR) and synthesized porous carbon samples (RAC and GAC) exhibit two types of characteristic peaks at ∼1350 and ∼1600 cm−1, ascribed to the D band and G band, respectively, which are prominent for the partially graphitized carbon. The D band is associated with the breathing mode of K-point phonons possessing A1g symmetry, indicative of disordered carbon or flawed graphitic arrangements.15 Conversely, the G band is linked to the E2g phonon of the sp2 carbon atom, representing a distinct feature of graphitic layers and reflecting the tangential vibration of the carbon atoms.16 The ID/IG ratio of raw and synthesized samples is in the range of 0.60 to 0.95 and the increase in the ID/IG ratio of GAC and RAC compared to that of raw pet-coke samples indicates a well-developed porous structure in the single step KOH activation,17 consistent with the XRD results. The strong D band peak also indicates that RAC and GAC have significant disordered sections and defects.5
3.3 Observations from electron beam analysis
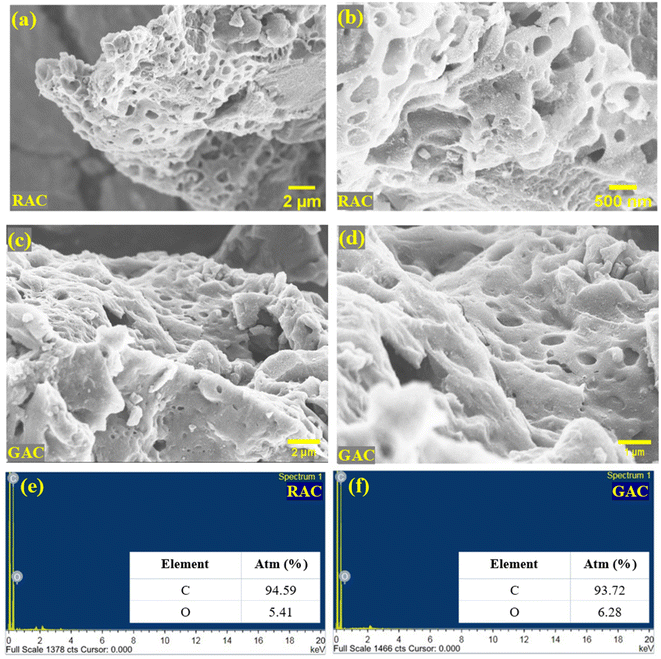
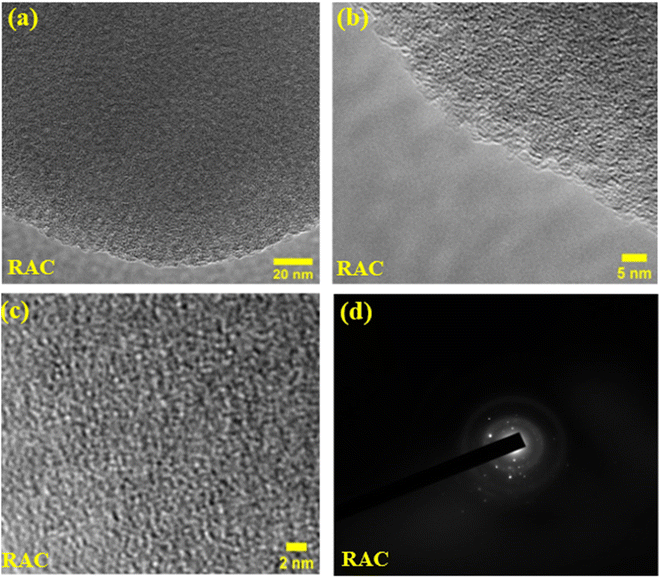
The morphology and micro-structural analysis of RAC and GAC samples was done using electron beam techniques including FESEM and HRTEM. The SEM images of RAC and GAC at different magnifications are provided in Fig. 3a–d. The SEM images of RAC and GAC show a well-developed porous structure with micro, meso, and macro pores with honeycomb like morphologies. The pores are formed due to the reaction between carbon and the activation agent during chemical activation. The formation of holes and tunnels during the activation process is favourable for ion transport and adsorption in the charge storage mechanism.17 Fig. 3e and f show the typical EDS spectrum of RAC and GAC containing carbon and oxygen as predominant elements, ensuring the purity of the synthesised porous carbon materials.The HRTEM image analysis of the RAC at different magnifications and size levels is depicted in Fig. 4a–c. The generation of a dense and 3D distribution of pores in the synthesised activated carbon is clearly visible from the HRTEM images. Moreover, the fracture edge (Fig. 4a) shows a distorted and layered microstructure attributed to the random stacking of sp2 bonded carbon sheets. The magnified image of the edge (Fig. 4b) shows significant ripples and crumples. The graph further demonstrates the disordered microstructure of porous carbon since no lattice distance can be determined.18 Detailed HR-TEM analysis reveals the presence of locally ordered nano-crystallites that generate lots of micropores at the sub-nanometer scale, which could facilitate the insertion-extraction of electrolyte ions.19 The SAED pattern of RAC is also presented in Fig. 4d, showing two diffused rings corresponding to (002) and (100) peaks, along with some randomly oriented diffraction spots. This corresponds to the short-range or semicrystalline nature of the RAC sample, which also agrees with the XRD data obtained.20,21
3.4 Functional group analysis of the pet-coke derived porous carbon
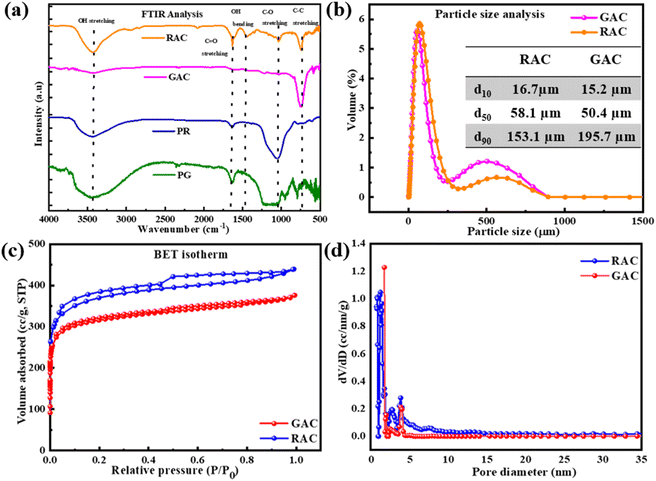
The FTIR spectral analysis of raw pet-coke samples and their derived porous carbon samples is given in Fig. 5a. The broad and strong peak at 3413 cm−1 for all samples is due to OH stretching, which could be from physisorbed water molecules or hydroxyl groups on the porous carbon surface.17 The peak around 1050 cm−1 is attributed to the C–O stretching vibration, and a weak peak at 1380 is the deformation mode of the C–H group.17 The peak at 1650 cm−1 stands for the C![[double bond, length as m-dash]](https://www.rsc.org/images/entities/char_e001.gif) C stretching in aromatic rings conjugated with other C
C stretching in aromatic rings conjugated with other C![[double bond, length as m-dash]](https://www.rsc.org/images/entities/char_e001.gif) C stretching vibrations.22 The weak band at 2900 cm−1 for RAC and GAC is attributed to asymmetric C–H stretching vibrations of aliphatic groups, such as –CH2, –CH3, and –CH2CH3, which are introduced by the KOH activation process.22 The carboxyl and hydroxyl groups present on the surface of porous carbon imply promising capacitance of the materials.11 From FTIR analysis, it can be evident that more functional groups are added to the as synthesized porous carbon after activation, thereby enhancing its reactivity. The presence of surface oxygen-based functional groups within porous carbons alters the surface chemistry, enhancing the wettability of the electrode–electrolyte interface by creating polar functional groups.23
C stretching vibrations.22 The weak band at 2900 cm−1 for RAC and GAC is attributed to asymmetric C–H stretching vibrations of aliphatic groups, such as –CH2, –CH3, and –CH2CH3, which are introduced by the KOH activation process.22 The carboxyl and hydroxyl groups present on the surface of porous carbon imply promising capacitance of the materials.11 From FTIR analysis, it can be evident that more functional groups are added to the as synthesized porous carbon after activation, thereby enhancing its reactivity. The presence of surface oxygen-based functional groups within porous carbons alters the surface chemistry, enhancing the wettability of the electrode–electrolyte interface by creating polar functional groups.23
3.5 Particle size and surface area analysis of the pet-coke derived porous carbon
The particle size distributions of as synthesized porous carbons, including some of the particle size parameters, are provided in Fig. 5b. d10, d50, and d90 correspond to the distribution of size of particles in the porous carbon samples. In both RAC and GAC products, 90% of the particles are found to be less than 195.7 μm. It is to be noted that the particle size of porous carbon greatly impacts the electrochemical properties of hierarchical porous carbon. Owing to the small size particles, the pet-coke derived porous carbon material provides a smooth surface and homogeneous mass loading for the fabrication of supercapacitor electrodes.24The specific surface area and porosity of pet-coke derived porous carbon materials are analysed through the Brunauer–Emmett–Teller (BET) method and the adsorption desorption curve of pet-coke derived porous carbons showed a combination of type I and type IV isotherms (see Fig. 5c). It shows a significant rise in the quantity of nitrogen absorbed under low relative pressure, implying that the major porosity contributor is micropores. The specific surface areas of RAC and GAC are 1108 and 954 m2 g−1, respectively. It can be stated that the presented single-step activation technique results in a larger micropore volume. The existence of a sheet-like formation featuring both micro and meso porosity enhances the electrochemical capabilities. Micropores facilitate the absorption and release of electrolyte ions, enabling energy storage through the provision of active sites. Meanwhile, the mesopores facilitate the movement of electrolyte ions towards the micropores by offering a broader pathway for transport.12,25 Although the device capacitance and electrode surface area are directly correlated, the final performance of the electrode is affected by the electrode's accessibility to the interior surface area through porous pathways. Therefore, it is crucial to regulate the pore size based on the electrolyte type being utilized.23 Moreover, the synthesized pet-coke derived product consists of macroporous frameworks, mesoporous walls, and microporous textures, which are suitable for the diffusion of the active ions, which complements the FESEM results.5 However, for achieving better performance as an electrode, the pore size should be close to the electrolyte.
The pore size distribution of RAC and GAC was also estimated by the DFT method from N2 adsorption–desorption isotherms (Fig. 5d). Both the samples have pores in the micro–meso region (<4 nm) but more pores in the microporous region (<2 nm). The RAC shows major peaks at 0.7, 1, 1.3, and 1.7 nm, and GAC has a major peak at 1.6 nm followed by continuous pore distribution in the range of 1.7–4.0 nm. Thus, KOH activation of the pet-coke samples produces porous carbon with some mesopores smaller than 4.0 nm. The sample RAC showed more mesopore volume in the 2–4 nm range than GAC. Excessive mesopores can be considered ineffective since they reduce the specific surface area and the physical integrity of materials. According to a report, mesopores in the range of 2–4 nanometers can function as pathways for fast ion transfer and prevent specific surface area reduction.26 Thus, it is revealed that the formation of micro and small meso pores after the single step activation enhances the electrochemical properties of pet-coke derived porous carbon for further application in supercapacitor energy storage devices.
3.6 Chemical state of carbon and other elements in pet-coke derived porous carbon
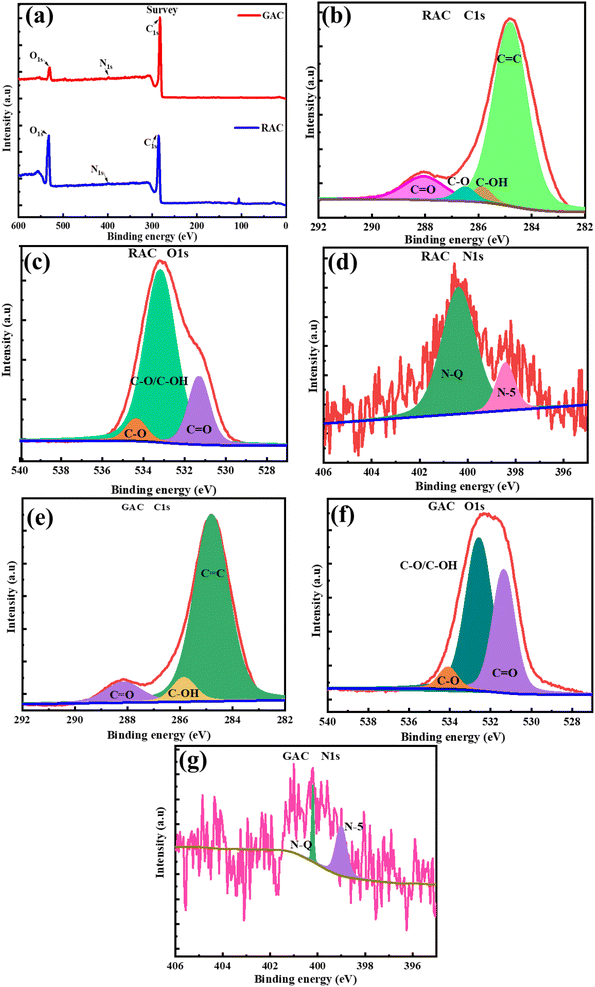
To elucidate the nature of chemical bonds and functional groups in the pet-coke derived porous carbon, X-ray photoelectron spectroscopy (XPS) analysis was employed. The analysis indicates the presence of C1s as the primary element, followed by O1s and N1s. The survey spectra of RAC and GAC are given in Fig. 6a, which show peaks at 284.7, 400.3, and 533 eV corresponding to C1s, N1s, and O1s, respectively.27 The XPS peak analysis of GAC and RAC indicates their atomic composition and it is summarised in Table 2. The high-resolution C1s spectra of RAC and GAC are depicted in Fig. 6b and c, respectively, which reveals that all carbon show a peak at 284.7 eV corresponding to sp2 hybridized carbon and demonstrations of a pronounced asymmetric shape to higher binding energies due to the quantum mechanical coupling of core electrons with conduction electrons.28 Also, there exist additional peaks at 288.1 eV and 285.8 eV attributed to C![[double bond, length as m-dash]](https://www.rsc.org/images/entities/char_e001.gif) O and C–OH bonds. The peak at 286.5 can be assigned to the C–O group. On the other hand, O1s displays three peaks at 530.1, 532.1 and 533.5 eV that can be ascribed to C
O and C–OH bonds. The peak at 286.5 can be assigned to the C–O group. On the other hand, O1s displays three peaks at 530.1, 532.1 and 533.5 eV that can be ascribed to C![[double bond, length as m-dash]](https://www.rsc.org/images/entities/char_e001.gif) O, C–O/C–OH, and C–O, which indicate different oxygen containing functional groups in petroleum coke-derived porous carbon21 [Fig. 6c and f]. The content of nitrogen in both the pet-coke derived porous carbon materials is very less compared to carbon and oxygen (Table 2). Although we fitted the two peaks at 399.9 and 400.4 eV corresponding to pyrrolic (N-5) and quaternary (N-Q), respectively [Fig. 6d and g]. Report suggests that quinone oxygen, as well as pyrrolic and pyridinic nitrogen, is considered to exert the greatest impact on capacitance owing to their pseudocapacitive contributions.13 The XPS analysis verifies that no metal impurities are present in the GAC and RAC.
O, C–O/C–OH, and C–O, which indicate different oxygen containing functional groups in petroleum coke-derived porous carbon21 [Fig. 6c and f]. The content of nitrogen in both the pet-coke derived porous carbon materials is very less compared to carbon and oxygen (Table 2). Although we fitted the two peaks at 399.9 and 400.4 eV corresponding to pyrrolic (N-5) and quaternary (N-Q), respectively [Fig. 6d and g]. Report suggests that quinone oxygen, as well as pyrrolic and pyridinic nitrogen, is considered to exert the greatest impact on capacitance owing to their pseudocapacitive contributions.13 The XPS analysis verifies that no metal impurities are present in the GAC and RAC.
| Elements | Atomic percentage (%) | Weight percentage (%) | ||
|---|---|---|---|---|
| RAC | GAC | RAC | GAC | |
| C | 70.94 | 79.30 | 64.74 | 74.23 |
| O | 28.62 | 20.47 | 34.79 | 25.52 |
| N | 0.45 | 0.25 | 0.48 | 0.25 |
3.7 Electrochemical performance of the pet-coke derived porous carbon
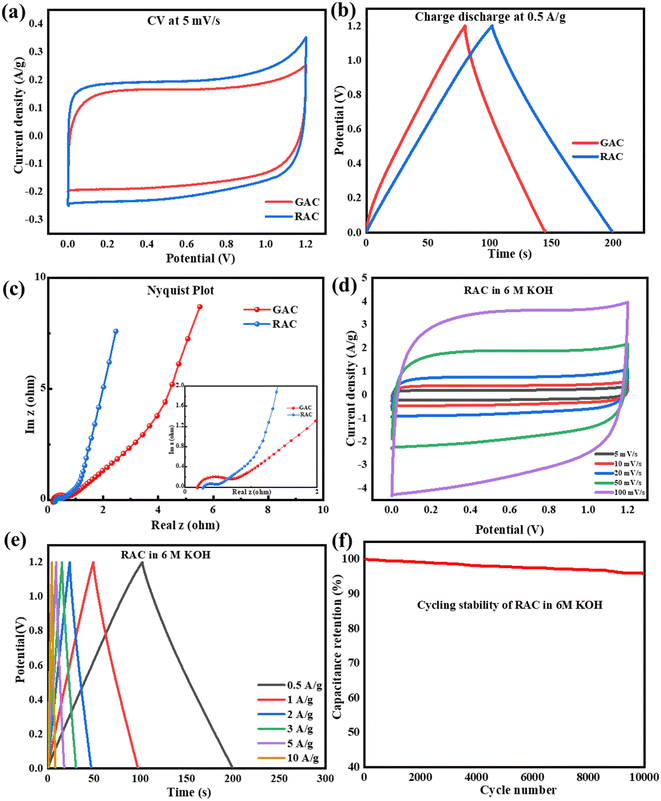
The EDLC properties of GAC and RAC, i.e., galvanostatic charge–discharge (GCD), were determined at a potential of 0–1.2 V, and the comparative GCD analysis of both the porous carbon materials at a current density of 0.5 A g−1, as shown in Fig. 7b. Both samples showed triangular shaped curves with linear behaviour with no IR drop, which indicates electrical double layer properties and high reversibility. However, the RAC electrode has a more prolonged charging and discharging cycle compared to the GAC electrode. The specific capacitances of the RAC and GAC were calculated using eqn (1) and determined to be 170 and 152 F g−1, respectively. The specific capacitance of a material depends upon pore size, pore distribution, presence of surface functional groups, and the relationship between solvated ion size and pore size.17 The micropores exhibit a densely packed double-layer capacitance, while the meso and macropores enable fast diffusion and movement of electrolyte ions within them.11
To study the resistive behaviour of the porous carbon materials towards supercapacitor applications, electrochemical impedance spectroscopy was conducted. The Nyquist plot recorded in the frequency range of 100 to 200 kHz is given in Fig. 7c. The typical Nyquist plot of an EDLC material shows the following components: the equivalent series resistance (Rs) is shown by the intersection of the EIS spectrum and the x-axis in the high-frequency region, the charge transfer resistance (Rct) is represented by a semicircle in the high-medium frequency region, the electrolyte ion diffusion resistance (Rd) is represented by a 45° Warburg impedance zone in the medium frequency region, and the vertical straight line in the low-frequency range illustrates the capacitive properties.29 The inset shows the zoomed high frequency region of the Nyquist plot, in which both samples show a small semicircle in the high-frequency region. This means that the electrolyte ions could quickly diffuse to the porous carbon electrode surface and the inner surface of macropores or mesopores, thus implying that there exists a faradaic impedance of charge transfer.11 The Rs obtained for RAC and GAC is 0.2 and 0.1 Ω, respectively, indicating the porous materials to be conductive.
The CV data were also recorded at the scan rates of 5, 10, 20, 50, and 100 mV s−1 for pet-coke-derived porous carbons. Even at higher scan rates, RAC showed a quasi-rectangular shape, representing the promising EDLC behaviour of the material [Fig. 7d]. As the scan rate increases, there is only a slight deformation in the CV curve, which implies excellent performance of the material.21 The rate capability, i.e., the discharge capacity of the porous carbon is important for its application in high-performance supercapacitors. The GCD analysis of RAC at different current densities is given in Fig. 7e, which shows that the porous carbon showed significant linear curves without any distortion as the current densities increased, implying excellent reversibility and rate capability. The specific capacitances are found to be 178, 160, 155, 150, 133, and 124 F g−1 for current densities of 0.5, 1, 2, 3, 5, and 10 A g−1, respectively. As the current density rises, there is insufficient time for the electrolyte to diffuse into the pores, consequently leading to a decline in specific capacitance. Here, even after increasing the current density ten times, the capacitance retained 56%, which indicates the fast charging discharging ability along with outstanding discharge rate performance of the material. The excellent electrochemical properties of both pet-coke derived porous carbon materials can be attributed to the integration of micro and mesopores that widen the charge transport of ions, high edge plane density, and the presence of functional groups that provide the EDLC mechanism to the electrodes.17
Cycle stability is a critical factor in assessing the electrochemical performance of supercapacitors and thus the capacitance and rate performance. Since there is no faradaic reaction involved in the charge storage process, the EDLC exhibits no discernible performance change even after thousands of cycles. Now, the EDLC research focuses on improving energy performance and temperature limits. The cycling stability analysis of the RAC sample was done in 6 M KOH for 10![[thin space (1/6-em)]](https://www.rsc.org/images/entities/char_2009.gif) 000 cycles at a current density of 5 A g−1, as shown in Fig. 7f. The capacitance retention was measured from the discharge curve and was 96% after cycling. From the discharge profiles obtained, energy and power density were calculated and the maximum energy and power density of RAC were 8.9 W h kg−1 and 6000 W kg−1, respectively. It is to be noted that in the case of aqueous electrolyte, the energy and power densities are limited by the voltage window of the cell. Thus, the electrochemical analysis of pet-coke derived porous carbon showed that the excellent porosity produced by KOH activation is favourable for the EDLC formation and quick transmission in KOH electrolyte, which has a notable effect on capacitance.
000 cycles at a current density of 5 A g−1, as shown in Fig. 7f. The capacitance retention was measured from the discharge curve and was 96% after cycling. From the discharge profiles obtained, energy and power density were calculated and the maximum energy and power density of RAC were 8.9 W h kg−1 and 6000 W kg−1, respectively. It is to be noted that in the case of aqueous electrolyte, the energy and power densities are limited by the voltage window of the cell. Thus, the electrochemical analysis of pet-coke derived porous carbon showed that the excellent porosity produced by KOH activation is favourable for the EDLC formation and quick transmission in KOH electrolyte, which has a notable effect on capacitance.
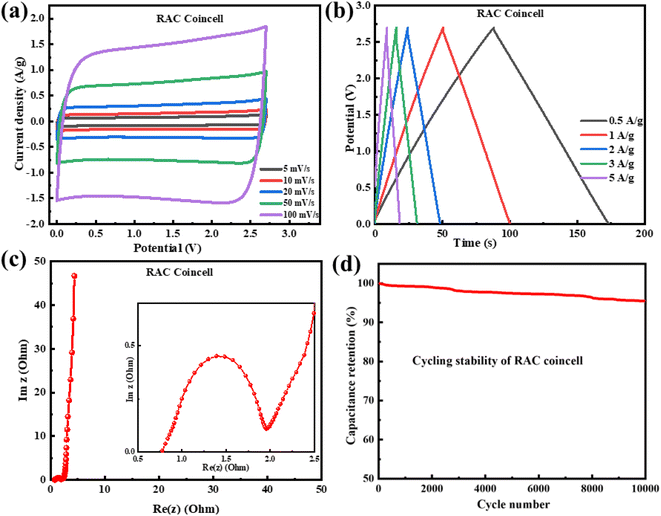
In order to understand the ion probing and electron transport in the fabricated RAC coin cell, the Nyquist plot in the frequency range of 10 mHz to 200 kHz is drawn, which exhibits a typical EDLC curve [Fig. 8c]. The inset displays an expanded region in the high-frequency range characterized by a semicircular shape, showing charge transfer resistance, followed by a straight line in the low frequency region. The point of intersection of the semicircle with the x-axis is the solution resistance, which is the integrated resistance of the material's inherent resistance and the interfacial resistance between the electrode material and the current collector.1 Here, the RAC coin cell shows a solution resistance of 0.7 Ω, which indicates excellent ion transport and conductivity between the surface of the electrode material and electrolyte. To test the long-term practical usability of the RAC coin cell, cycling tests were performed at the current density of 5 A g−1 for 10![[thin space (1/6-em)]](https://www.rsc.org/images/entities/char_2009.gif) 000 cycles, which showed that the RAC coin cell exhibits excellent coulombic efficiency with 95% capacitance retention [Fig. 8d]. The maximum energy and power density of the RAC coin cell are calculated to be 18 W kg−1 and 13.3 kW h kg−1, respectively. Thus, the factors like excellent capacitance, good cycle stability, great rate performance, and one-step synthesis methodology make this refinery pet-coke derived porous carbon one of the easily available electrode materials for near future supercapacitor fabrication technologies.
000 cycles, which showed that the RAC coin cell exhibits excellent coulombic efficiency with 95% capacitance retention [Fig. 8d]. The maximum energy and power density of the RAC coin cell are calculated to be 18 W kg−1 and 13.3 kW h kg−1, respectively. Thus, the factors like excellent capacitance, good cycle stability, great rate performance, and one-step synthesis methodology make this refinery pet-coke derived porous carbon one of the easily available electrode materials for near future supercapacitor fabrication technologies.
3.8 Application of the pet-coke derived porous carbon-based coin cell supercapacitor in a real time clock (RTC) module
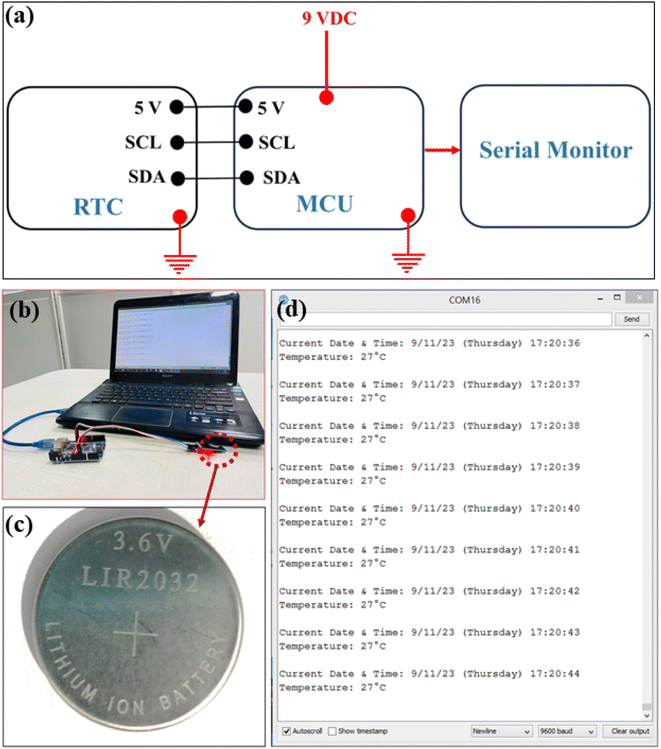
The developed RAC coin cell showed promising electrochemical properties in an organic electrolyte and therefore, it was chosen to utilize as a backup power source in real time clock (RTC) application. An RTC moiety is a digital clock that keeps accurate track of time even when the power supply is turned off in electronic gadgets. Generally, it consists of a controller, embedded quartz crystal resonator, and oscillator. When no other task is required, the RTC stays as the lowest current consuming device and thus solves the current draw problems. The uninterrupted timekeeping feature remains essential for modern electronics, medical equipment, and industrial tools, even if the Real-Time Clock (RTC) isn't utilized primarily for power conservation. This is particularly crucial in environments where efficient power usage and reliable backup timekeeping are highly valued. Secondary lithium batteries have long been utilized as a backup power source for real-time clocks and volatile memory, but they are not always the best option. In addition to having a short cycle life and a narrow working temperature range, lithium batteries also possess disposal problems. Therefore, supercapacitors with high energy density and power density are the solution to address these problems. Moreover, supercapacitors are more environmentally friendly, and have near infinite life cycles, and a wide operating temperature range.In this application study, the DS3231 AT24C32 IIC precision RTC module for timekeeping and the ATMEGA 328P microcontroller (MCU) for writing the initial data into the RTC module and reading the current data continuously from the RTC module were used. For the proper functioning of the system, the microcontroller (ARDUINO IDE, an open-source integrated development environment) was programmed using embedded C language. The interconnection between these components is shown in Fig. 9a. The experimental setup consisting of a computer monitor display, coin cell fabricated, and output data are depicted in Fig. 9b–d. The display is capable of showing the real time date, time, and temperature. The maximum energy stored by the fabricated EDLC coin cell is 0.35 mW h, whereas the calculated power consumption of the RTC is 0.135 μW, indicating its feasibility for powering the module. However, the cycle life of the coin cells can be improved by enhancing the specific capacitance, utilizing other high-potential electrolytes and thus increasing the energy density for their long-term use in the RTC system. Thus, this application result demonstrates that the pet-coke based coin cell supercapacitors can be satisfactorily used in a real time clock (RTC) module as a promising power provider; however, further improvement may be made for long-term use.
4. Conclusion
In this present innovative work, we have successfully synthesized porous carbon from abundant refinery pet-coke with excellent surface area and remarkable porosity by simple KOH activation. The comparative and comprehensive study of raw pet-coke and synthesized porous carbon samples was performed using chemical, structural, spectroscopic, and morphological studies by using advanced analytical techniques. The maximum specific capacitance of 170 F g−1 at 0.5 A g−1 with an excellent cycling stability of 96% after 10![[thin space (1/6-em)]](https://www.rsc.org/images/entities/char_2009.gif) 000 cycles is observed in an aqueous electrolyte. A coin cell supercapacitor prototype is developed using the porous carbon in an organic electrolyte. The coin cell showed a specific capacitance of 70 F g−1 at 0.5 A g−1 and a cycling stability of 95% after 10
000 cycles is observed in an aqueous electrolyte. A coin cell supercapacitor prototype is developed using the porous carbon in an organic electrolyte. The coin cell showed a specific capacitance of 70 F g−1 at 0.5 A g−1 and a cycling stability of 95% after 10![[thin space (1/6-em)]](https://www.rsc.org/images/entities/char_2009.gif) 000 cycles. The coin cell exhibits energy and power densities of 18 W kg−1 and 13.3 kW h kg−1, respectively. The coin cell supercapacitor is capable of operation in the potential window of 2.7 V, providing a cell capacitance of 0.35 F. The fabricated coin cell supercapacitor was satisfactorily used to provide backup power in a real time clock (RTC) module with excellent power applicability. Thus, petroleum coke is an ideal carbon precursor material for single step activation towards making supercapacitor electrodes with notable electrochemical properties with promising potential for future electronics application.
000 cycles. The coin cell exhibits energy and power densities of 18 W kg−1 and 13.3 kW h kg−1, respectively. The coin cell supercapacitor is capable of operation in the potential window of 2.7 V, providing a cell capacitance of 0.35 F. The fabricated coin cell supercapacitor was satisfactorily used to provide backup power in a real time clock (RTC) module with excellent power applicability. Thus, petroleum coke is an ideal carbon precursor material for single step activation towards making supercapacitor electrodes with notable electrochemical properties with promising potential for future electronics application.
Data availability
No new data were created or analyzed in this study. Data sharing is not applicable to this article.Conflicts of interest
There are no conflicts to declare.Acknowledgements
The authors would like to thank Director of CSIR-NEIST for his keen interest in the research work. The funds received from MeitY and CSIR, Govt. of India (GPP348, HCP0049 and OLP2077) are thankfully acknowledged by the authors. The valuable comments received from two reviewers are highly acknowledged by the authors.References
- S. S. Shah, M. A. Aziz and Z. H. Yamani, Diamond Relat. Mater., 2023, 140, 110450 CrossRef CAS.
- B. Pal, S. Yang, S. Ramesh, V. Thangadurai and R. Jose, Nanoscale Adv., 2019, 1, 3807–3835 RSC.
- S. M. Benoy, M. Pandey, D. Bhattacharjya and B. K. Saikia, J. Energy Storage, 2022, 52, 104938 CrossRef.
- Q. Wang, J. Yan and Z. Fan, Energy Environ. Sci., 2016, 9, 729–762 RSC.
- L. Qie, W. Chen, H. Xu, X. Xiong, Y. Jiang, F. Zou, X. Hu, Y. Xin, Z. Zhang and Y. Huang, Energy Environ. Sci., 2013, 6, 2497–2504 RSC.
- H. Park, J. Chung, B. Lim and C. Jung, J. Ind. Eng. Chem., 2019, 80, 301–310 CrossRef CAS.
- W. Cai, K. Li, K. Jiang, D. Lv, Y.-Q. Liu, D. Wang, X. Wang and C. Lai, Diamond Relat. Mater., 2021, 116, 108380 CrossRef CAS.
- J. A. Caruso, K. Zhang, N. J. Schroeck, B. McCoy and S. P. McElmurry, Int. J. Environ. Res. Public Health, 2015, 12, 6218–6231 CrossRef CAS PubMed.
- W. Li, B. Wang, J. Nie, W. Yang, L. Xu and L. Sun, Energies, 2018, 11(8), 2158 CrossRef.
- M. Tan, P. Li, J. Zheng, T. Noritatsu and M. Wu, New Carbon Mater., 2016, 31, 343–351 CrossRef CAS.
- M. Xu, D. Li, Y. Yan, T. Guo, H. Pang and H. Xue, RSC Adv., 2017, 7, 43780–43788 RSC.
- S. R. Mangisetti, M. Kamaraj and R. Sundara, ACS Omega, 2019, 4, 6399–6410 CrossRef CAS.
- H. Liu, H. Song, X. Chen, S. Zhang, J. Zhou and Z. Ma, J. Power Sources, 2015, 285, 303–309 CrossRef CAS.
- L. Chunlan, X. Shaoping, G. Yixiong, L. Shuqin and L. Changhou, Carbon, 2005, 43, 2295–2301 CrossRef.
- Z. Li, Z. Xu, X. Tan, H. Wang, C. M. B. Holt, T. Stephenson, B. C. Olsen and D. Mitlin, Energy Environ. Sci., 2013, 6, 871–878 RSC.
- J. Xu, Q. Gao, Y. Zhang, Y. Tan, W. Tian, L. Zhu and L. Jiang, Sci. Rep., 2014, 4, 5545 CrossRef CAS PubMed.
- I. I. Misnon, N. K. M. Zain, R. A. Aziz, B. Vidyadharan and R. Jose, Electrochim. Acta, 2015, 174, 78–86 CrossRef CAS.
- S. Wang, R. Wang, Y. Zhang and L. Zhang, Nanotechnology, 2017, 28, 445406 CrossRef.
- X. Qi, K. Huang, X. Wu, W. Zhao, H. Wang, Q. Zhuang and Z. Ju, Carbon, 2018, 131, 79–85 CrossRef CAS.
- S. Saha, P. Lakhe, M. J. Mason, B. J. Coleman, K. Arole, X. Zhao, S. Yakovlev, S. Uppili, M. J. Green and R. A. Hule, npj 2D Mater. Appl., 2021, 5, 75 CrossRef CAS.
- S. M. Benoy, D. Bhattacharjya, M. Bora and B. K. Saikia, ACS Appl. Electron. Mater., 2022, 4, 6322–6334 CrossRef CAS.
- X. Yuan, S. W. Choi, E. Jang and K. B. Lee, Chem. Eng. J., 2018, 336, 297–305 CrossRef CAS.
- Q. Abbas, M. Mirzaeian, A. A. Ogwu, M. Mazur and D. Gibson, Int. J. Hydrogen Energy, 2020, 45, 13586–13595 CrossRef CAS.
- M. Bora, J. Tamuly, S. Maria Benoy, S. Hazarika, D. Bhattacharjya and B. K. Saikia, Fuel, 2022, 329, 125385 CrossRef CAS.
- X. Cui, G. Xu, Z. Gao, S. Zhu, Y. Zhao, X. Mo, Z. Gao, Z. Zheng and J. Zhang, Energy Fuels, 2023, 37, 4038–4047 CrossRef CAS.
- X. Yang, S. Zhao, Z. Zhang, Y. Chi, C. Yang, C. Wang, Y. Zhen, D. Wang, F. Fu and R. Chi, J. Colloid Interface Sci., 2022, 614, 298–309 CrossRef CAS PubMed.
- M. Harilal, S. G. Krishnan, B. Pal, M. V. Reddy, M. H. Ab Rahim, M. M. Yusoff and R. Jose, Langmuir, 2018, 34, 1873–1882 CrossRef CAS PubMed.
- Z. Ding, V. Trouillet and S. Dsoke, J. Electrochem. Soc., 2019, 166, A1004–A1014 CrossRef CAS.
- F. Cheng, X. Yang, S. Zhang and W. Lu, J. Power Sources, 2020, 450, 227678 CrossRef CAS.
| This journal is © The Royal Society of Chemistry 2024 |

