 Open Access Article
Efficient and accurate detection of GC-associated miR-96-5p using a competitive lateral flow method based on SERS†
Long Jia‡
 a,
Yongxia Liu‡b,
Yanqing Zhanga,
Shuofeng Zhanga,
Xiaowei Cao
 a,
Yemin Xua,
Yi Zhaoa and
Bin Deng*c
aClinical Medical College, Yangzhou University, Yangzhou 225001, China
bDepartment of Gastroenterology, Traditional Chinese Medicine Hospital of Tongzhou District, Nantong, 8 Jianshe Road, Nantong 226300, China
cDepartment of Gastroenterology, Northern Jiangsu People's Hospital Affiliated to Yangzhou University, Yangzhou 225001, China. E-mail: chinadbin@126.com
First published on 8th October 2024
Abstract
To facilitate rapid, efficient, and accurate detection of miR-96-5p associated with gastric cancer (GC), we developed a bioanalytical platform by integrating surface-enhanced Raman spectroscopy with lateral flow assay (SERS-LFA). With these SERS-LFA strips, miR-96-5p within the specimen competed with Au rhombic dodecahedron (AuRD) conjugated single-stranded DNA (ssDNA) to bond to the immobilized hairpin DNA (hpDNA) probe on the T line. Consequently, higher abundance of miR-96-5p led to reduced conjugation of AuRD on the T line, thereby resulting in diminished SERS intensity. The biosensor exhibited a detection time of approximately 30 min and demonstrated a low limit of detection (LOD) for miR-96-5p in PBS buffer solution, down to 3.7 fM. To validate its clinical utility for the early diagnosis of patients with different degrees of gastric lesions, we performed quantitative evaluations in cohorts that included healthy individuals, patients with mild intraepithelial neoplasia, patients with severe intraepithelial neoplasia, as well as patients diagnosed with GC. The results obtained from the SERS-LFA strips were in agreement with those obtained from the quantitative real-time polymerase chain reaction (qRT-PCR). Given the accomplishments, this biosensor has significant potential for the clinical diagnosis of GC, offering a promising avenue for timely detection and improved patient prognoses.
1. Introduction
Gastric cancer (GC) is one of the five most prevalent malignancies globally, and is ranked fourth in global mortality rates.1,2 Reports from 2020 indicated that the global count of GC patients exceeded 1 million, representing 7.7% of all cancer cases, and resulted in over 700![[thin space (1/6-em)]](https://www.rsc.org/images/entities/char_2009.gif) 000 annual fatalities.3 In early gastric cancer (EGC), invasion of cancer tissue was restricted to the mucosal layer and submucosa. Timely surgical intervention can significantly improve the five-year survival rate. The condition often goes unnoticed due to its mild symptoms and minor physical signs, leading to late detection and diagnosis, typically in more advanced stages. Consequently, this leads to a poor prognosis and low survival rates for GC patients.4,5 During that period, GC diagnosis commonly involves gastroscopy, barium X-ray studies, ultrasound and similar methods. However, the approaches lack real-time monitoring capabilities, require skilled medical professionals, and are expensive and time-consuming.6 Therefore, the development of a new quantitative tumor marker detection method is imperative to allow the timely identification and effective therapy of patients with GC. The short non-coding RNA molecule microRNAs (miRNAs) play a crucial role in the regulation of gene expression and participate in the biological mechanisms that govern tumor cell migration, apoptosis, metastasis and amplification.7–10 Recent research revealed that miR-96-5p can suppress the apoptosis of GC cells, thus facilitating the growth of GC cells.11–13 MiR-96-5p accelerates gastric cancer cell proliferation by directly targeting the FOXO3 gene.14 Overexpression of miR-96-5p in plasma of patients with GC establishes its potential as an innovative tumor marker for GC detection. The technology for detecting tumor-associated miRNA has rapidly advanced. The quantitative real-time polymerase chain reaction (qRT-PCR), Northern blotting and DNA microarrays can be employed for miRNA detection. However, their applicability in cancer diagnosis is impeded by complex operations, stringent operator requirements, reliance on specialized equipment, high costs, and prolonged detection times.15–17
000 annual fatalities.3 In early gastric cancer (EGC), invasion of cancer tissue was restricted to the mucosal layer and submucosa. Timely surgical intervention can significantly improve the five-year survival rate. The condition often goes unnoticed due to its mild symptoms and minor physical signs, leading to late detection and diagnosis, typically in more advanced stages. Consequently, this leads to a poor prognosis and low survival rates for GC patients.4,5 During that period, GC diagnosis commonly involves gastroscopy, barium X-ray studies, ultrasound and similar methods. However, the approaches lack real-time monitoring capabilities, require skilled medical professionals, and are expensive and time-consuming.6 Therefore, the development of a new quantitative tumor marker detection method is imperative to allow the timely identification and effective therapy of patients with GC. The short non-coding RNA molecule microRNAs (miRNAs) play a crucial role in the regulation of gene expression and participate in the biological mechanisms that govern tumor cell migration, apoptosis, metastasis and amplification.7–10 Recent research revealed that miR-96-5p can suppress the apoptosis of GC cells, thus facilitating the growth of GC cells.11–13 MiR-96-5p accelerates gastric cancer cell proliferation by directly targeting the FOXO3 gene.14 Overexpression of miR-96-5p in plasma of patients with GC establishes its potential as an innovative tumor marker for GC detection. The technology for detecting tumor-associated miRNA has rapidly advanced. The quantitative real-time polymerase chain reaction (qRT-PCR), Northern blotting and DNA microarrays can be employed for miRNA detection. However, their applicability in cancer diagnosis is impeded by complex operations, stringent operator requirements, reliance on specialized equipment, high costs, and prolonged detection times.15–17
Surface-enhanced Raman spectroscopy (SERS) is a highly effective spectroscopic technique with a distinct molecular fingerprint, enabling rapid response and non-destructive analysis.18,19 Furthermore, SERS demonstrates exceptional sensitivity and ultra-high selectivity, surpassing those of conventional Raman techniques. This superior performance is attributed to the ability to SERS significantly enhance the Raman scattering signal of molecules adsorbed on the surface of the substrate, allowing the detection of even trace amounts of substances.20,21 The SERS technology has been widely used in the detection of various biological specimens and illnesses, incorporating biomolecules, immune proteins and tumor cells.22–24 The Raman signals of the analyte molecule are amplified when in proximity to the corners of nanoparticles or the spaces between neighboring nanoparticles, referred to as “hot spots”, representing regions of space with exceptionally strong electromagnetic fields.25 In the past, precious metal particles such as gold and silver had been widely employed in SERS applications, and in compared to silver nanoparticles, gold nanoparticles have attracted a lot of attention because of their strong stability, excellent biocompatibility and straightforward but powerful surface properties.26,27 In addition, the Raman reporter molecule with the SERS nanotag can also adsorb onto the surface of metal nanoparticles, inducing electromagnetic and chemical enhancement, resulting in a significant amplification of the Raman signal emitted by the target biomarker.28 Gold nanoparticles are available in various forms, including spherical, cubic and star-shaped structures.29,30 Compared with other shapes of gold nanoparticles, Au rhombic dodecahedron (AuRD) can demonstrate pronounced enhancements in the regional electric field strength and the emergence of numerous “hot spots”.31 Additionally, AuRD offers advantages such as low manufacturing cost, short synthesis cycle and mild preparation conditions. Lateral flow assay (LFA) is characterized by its cost-effectiveness, short detection duration and long-term stability.32 LFA has attracted much attention as a point of care test (POCT) in a variety of fields, such as food testing, environmental toxin analysis and infectious disease diagnosis.33–35 However, traditional LFA relied on visual detection and did not involve electronic devices or sample preparation, which led to limitations in sensitivity and quantitative detection.36 To overcome these limitations, SERS is integrated into LFA, resulting in a significant improvement in sensitivity and quantitative detection as discussed earlier.37,38 Furthermore, SERS nanotags have emerged as a preferred choice for LFA due to their robust stability, ability to detect multiple targets, and exceptional sensitivity compared to commonly used markers in bioanalysis, such as fluorescent nanoparticles and magnetic nanoparticles.39,40
In recent years, the application of the SERS-LFA strip platform has garnered significant attention due to its exceptional sensitivity and quantitative detection capabilities. This platform has been widely utilized for the detection of biomarkers, including proteins and miRNAs and has yielded promising results.41–43 For example, Shen et al. employed SERS-LFA strips to achieve ultrasensitive detection of procalcitonin, with a limit of detection (LOD) of 0.03 ng mL−1.44 Similarly, Liu et al. utilized SERS-LFA strips for the ultrasensitive detection of microRNAs using sandwich structures, achieving an estimated LOD of 1.24 pM.45 Compared to sandwich structures, the competitive structure can demonstrate high adaptability, typically being directly coated with metal nanoparticles, allowing flexible adjustment of nanoparticle size, distribution and other parameters. This facilitates the fabrication process, thereby reducing its complexity. SERS-LFA strips that incorporate a competitive structure demonstrate significant advantages, including reduced inspection time, enhanced testing efficiency, improved user convenience, and decreased costs.
In this study, an innovative and competitive LFA based on SERS was developed for ultrasensitive detection of miR-96-5p, enabling the rapid and accurate identification of biomarkers related to GC. The surface of AuRD was modified using the 4-MBA Raman reporter molecule and single-stranded DNA (ssDNA) to prepare SERS tags, replacing colloidal gold typically used in traditional LFA. Optimization was conducted for the categories and concentrations of Raman reporter molecules, as well as the ssDNA concentration and incubation time after the addition of ssDNA to ensure stable utilization of SERS tags on LFA strips. The repeatability of LFA detection experiments across different batches was tested, specificity of LFA strips was assessed by detecting other mismatched miRNAs, and consistency of LFA strips was evaluated by detecting Raman signals in various regions on the same strip. Furthermore, Raman signals of miR-96-5p were detected at different concentrations and calibration curves were constructed to assess experimental sensitivity. To further verify the feasibility of the method, the detection of miR-96-5p was performed in the serum of healthy individuals, patients with mild intraepithelial neoplasia, patients with severe intraepithelial neoplasia and patients with GC. SERS-LFA successfully determined the concentration of miR-96-5p in the serum of GC patients, demonstrating promising clinical potential for early disease detection and biomedical investigation.
2. Materials and methods
2.1 Materials
Cetyl trimethylammonium chloride (CTAC), chloroauric acid tetrahydrate (HAuCl4), sodium borohydride (NaBH4), 4-mercaptobenzoic acid (4-MBA), 1-ethyl-3-(3-dimethylaminopropyl)carbodiimide (EDC), n-hydroxy succinimide (NHS), ascorbic acid (AA) and absolute ethanol were produced by Shanghai Aladdin Biochemical Technology (China). Mouse monoclonal antibody (MIgG), goat anti-mouse antibody (GMIgG), streptavidin and oligonucleotides used were all produced by Shanghai Sangon Bioengineering (China). The oligonucleotides in Table 1 were used as described by the manufacturer. Sample pads, coupling pads, nitrocellulose (NC) membranes, absorbent pads, and PVC sheets were supplied by Shanghai Kinbio Biotechnology (China). All experiments used Milli-Q water sourced from Millipore (USA), with a resistivity exceeding 18 M.| Name | Sequences (5′–3′) |
|---|---|
| miR-96-5p | UUUGGCACUAGCACAUUUUUGCU |
| hpDNA-bio | Biotin-(CH2)6-AGCAAAAATGTGCTAGTGCCAAA |
| ssDNA | SH-(CH2)6-GGCACTAGCACATTTTT |
| MT1 | UUUGGCACGAGCACAUUUUUGCU |
| MT3 | UUUGGCACGAGCAAAUUUUAGCU |
| Random | UAGUAAUCCCGAGCCCCUGAU |
2.2 Collection and preservation of human serum samples
Blood samples from human veins were obtained from the Affiliated Hospital of Yangzhou University. A total of 120 venous blood samples were collected as shown in Table 2, consisting of 30 from healthy individuals, 30 from patients diagnosed with mild gastric mucosal intraepithelial lesions, 30 from patients diagnosed with severe gastric mucosal intraepithelial lesions, and 30 from patients diagnosed with GC. Serum samples were collected from fasting individuals and consent was obtained from all participants after providing them with relevant information. After collection, the samples were centrifuged at 4000 rpm for 5 min at 4 °C, and the resulting upper serum layer was carefully extracted. The resulting upper serum stratum was stored at −80 °C for preservation.| Groups | Healthy subjects | Mild | Severe | GC |
|---|---|---|---|---|
| Mean age (years) | 54 | 62 | 64 | 67 |
| Male | 14 | 15 | 16 | 18 |
| Female | 16 | 15 | 14 | 12 |
| Sample number | 30 | 30 | 30 | 30 |
2.3 Production of gold seed solution
CTAC (0.32 g) and 2.4 × 10⁻⁴ M HAuCl4 solution (150 μL) were added to 10 mL of water. Simultaneously, 0.02 M NaBH4 solution (10 mL) was prepared and refrigerated. Following this, NaBH4 solution (0.45 mL) was introduced to the stirred HAuCl4 solution, resulting in the solution turning brown, indicating the creation of gold seeds. The seed solution was left at room temperature for 1 h to eliminate excess borohydride, resulting in seed particles with a size range of approximately 3–5 nm.2.4 Composition of AuRD
To prepare the growth solution in two beakers, the surfactant CTAC (0.32 g) was introduced into each beaker, followed by the addition of 9.485 mL of water to attain a final total solution volume of 10 mL in each beaker. Subsequently, the bottles were placed in a water bath kept at 20–25 °C. Equal volumes of 0.01 M HAuCl4 solution (250 μL) and 1.0 × 10⁻³ M KI solution (20 μL) were introduced into both beakers. Finally, 0.04 M AA (220 μL) were introduced into the growth broth. After the introduction of AA, the solution lost its color, signifying the reduction of Au3+ to Au. Subsequently, the seed solution (60 μL) was injected into bottle A. Upon continuous stirring, the solution gradually turned light pink in approximately 5 s. Then, the contents of bottle A (60 μL) were transferred to bottle B and thoroughly mixed for 5 to 10 s. Subsequently, the solution in bottle B was left undisturbed for 15 min to facilitate the growth of the pellet, and it was centrifuged at 8000 rpm for 10 min using a centrifuge.2.5 Fabrication of SERS tags
5 mL of AuRD was added to 100 μL of 4-MBA (1 mM) at room temperature and stirred at 600 rpm for 3 h to ensure complete mixing. 4-MBA was allowed to bind to the surface of AuRD via Au–S bonds, serving as Raman reporter molecules to significantly enhance Raman signals. Subsequently, 100 μL of ssDNA (0.1 mM) was combined with 100 μL of TCEP (10 mM) solution and reacted at room temperature for 2 h. Following the completion of the reaction, the ssDNA and TCEP mixture was added to the solution containing 4-MBA-labeled AuRD and the mixture was vigorously combined for a duration of 12 h. Next, 30 μL of EDC (120 mM) and 30 μL of NHS (30 mM) were added to the aforementioned mixed solution and incubated for 3 h. MIgG was then added to the solution. EDC and NHS facilitated the activation of carboxyl groups in MIgG, enabling the coupling of MIgG with 4-MBA. Finally, 100 μL of BSA solution (1 wt%) was introduced into the resulting solution and incubated for approximately 2 h to mitigate nonspecific binding. Concurrently, the solution was spun in a centrifuge (8000 rpm, 10 min) to remove excess reagents. The centrifuged solution constituted the required SERS tags. After additional washing and centrifugation steps, the SERS tags were suspended in PBS buffer and stored in a freezer at −4 °C for the future.2.6 Preparation of LFA biosensors based on SERS
Sample pads, coupling pads, nitrocellulose (NC) membranes, and absorption pads collaborated to construct the lateral flow assay (LFA) strips. The coupling pads were initially immersed in a buffer solution that contained 0.35% Triton X-100, 600 mM Tris–HCl and 0.2 mM NaCl, followed by drying at 36.5 °C for 1 h and subsequent storage at room temperature. The prepared SERS tags were dispersed onto a coupling pad and then dried at room temperature. The NC membrane featured two lines, including the T line and the C line. Streptavidin facilitated the binding to biotin, enabling the immobilization of hairpin DNA conjugated to biotin (hpDNA-bio) on the NC membrane. For the preparation, 100 μL of hpDNA-bio (1 μg mL−1) was mixed with 60 μL of streptavidin (1 μg mL−1), followed by the addition of 600 μL of PBS solution. The mixture was then incubated at room temperature for 2 h, followed by removal of the surplus hpDNA-bio through centrifugation (8000 rpm, 15 min). The centrifuged solution was added to the PBS solution and diluted to 10 μL. The resulting solution was further diluted to 10 mL with PBS solution and dispersed onto the NC membrane to form the T line. Additionally, the C line on the NC membrane was generated by dispensing 10 μL of GMIgG (1![[thin space (1/6-em)]](https://www.rsc.org/images/entities/char_2009.gif) :
:![[thin space (1/6-em)]](https://www.rsc.org/images/entities/char_2009.gif) 50 dilution).
50 dilution).
2.7 SERS measurement
First, a 50 μL diluted sample was dispensed onto the sample pad of the SERS-LFA strips. Under the capillary action, the sample migrated along with the SERS tags toward the absorption pad. Half an hour later, a chromogenic band appeared on the LFA band, indicating that the sample contained miR-96-5p. In addition, if the C line is colored, it indicates that the biosensor is working. MiR-96-5p in the sample, as well as the ssDNA conjugated to the SERS tag, could be captured by immobilization of hpDNA-bio on the NC membrane due to the biotin interaction with streptavidin. Thus, it was possible to make relevant SERS measurements. SERS measurements were performed at 785 nm laser wavelength, a 5 mW excitation light power, and a 50× objective with an integration time of 20 s. Since the peak measured by the 4-MBA was 1073 cm−1, all spectra were measured in the interval of 600–1800 cm−1. Each obtained spectrum has been baseline corrected and smoothed before processed, while removing the noise from the instrument. Furthermore, on the SERS-LFA strip T line, we selected 10 different points for SERS measurement each time and then obtained the average SERS spectrum for the quantitative analysis of miR-96-5p to ensure the validity and accuracy of the information.2.8 Characterization
UV-vis absorption spectra of the nanoparticles were detected using an Agilent ultraviolet absorption spectrometer from the United States. S-4800II field emission scanning electron microscope was used for scanning electron microscope (SEM) measurement at 3.0 kV. Select TECNAI 12 transmission electron microscope for transmission electron microscopy (TEM) scanning under an accelerated voltage of 60 kV. High-resolution TEM (HRTEM) images of nanoparticles were acquired using FEI Tecnai G2 F30 s-twin TEM. Selected area electron diffraction (SAED) measurements were performed using a 200 kV field emission transmission electron microscope. Raman spectra of all samples were acquired using the Renishaw inVia Micro-Raman system.3. Results and discussion
3.1 Design concept of LFA biosensors based on SERS
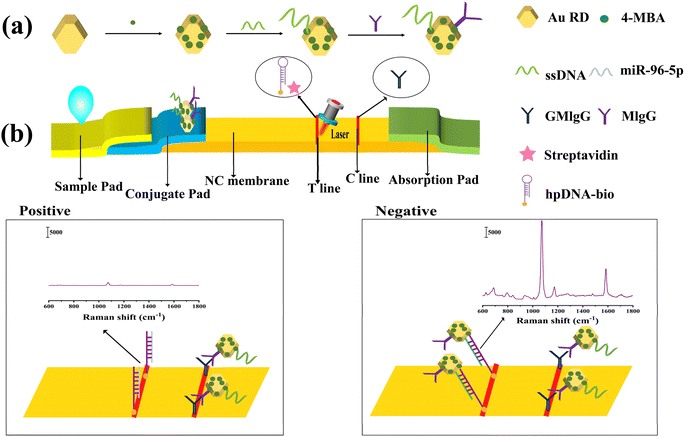
The design concept of the LFA biosensor based on SERS for detecting miR-96-5p was depicted in Fig. 1(a), illustrating the composition process of the AuRD and SERS tags. The Au–S bonds allowed the 4-MBA to be conjugated to the AuRD surface. 4-MBA could enhance Raman signals through physical and chemical effects and serve as a Raman reporter molecule. Under specific conditions, ssDNA modified with thiol groups was activated and coupled with AuRD through Au–S bonds. Subsequently, MIgG could be coupled with 4-MBA via amide bonds. Ultimately, the preparation of the AuRD@4-MBA@ssDNA@MIgG SERS tags was completed.As shown in Fig. 1(b), during the assay, a sample containing miR-96-5p was dropped onto a sample pad and transported toward the absorption pad by capillary action. When traversing the conjugate pad, AuRD@4-MBA@ssDNA@MIgG moved along with the sample pad towards the absorption pad. HpDNA-bio was immobilized in T cells by streptavidin. HpDNA-bio acted as a complement to ssDNA and miR-96-5p, both of which were competitively bound to hpDNA-bio. Compared to ssDNA, miR-96-5p had more complementary base pairs with hpDNA-bio, so miR-96-5p bound to hpDNA-bio more strongly. Consequently, when miR-96-5p was present in the sample, its strong binding affinity would preferentially bind to hpDNA-bio. At this point, there was no attachment of the AuRD@4-MBA@ssDNA@MIgG to the top of the T line. However, the GMIgG on the C line would capture AuRD@4-MBA@ssDNA@MIgG, which forms AuRD@4-MBA@ssDNA@MIgG@GMIgG. Upon observation with the naked eye, only the C line would exhibit color. Conversely, when miR-96-5p was absent from the sample, hpDNA-bio on the C would capture AuRD@4-MBA@ssDNA@MIgG, forming AuRD@4-MBA@ssDNA@MIgG@HpDNA-bio. In this case, the color would appear on both the T line and C line upon naked eye. Therefore, qualitative detection of miR-96-5p could be achieved through color comparison, and quantitative detection could be achieved by analyzing the SERS spectrum of 4-MBA.
3.2 Characteristics of AuRD
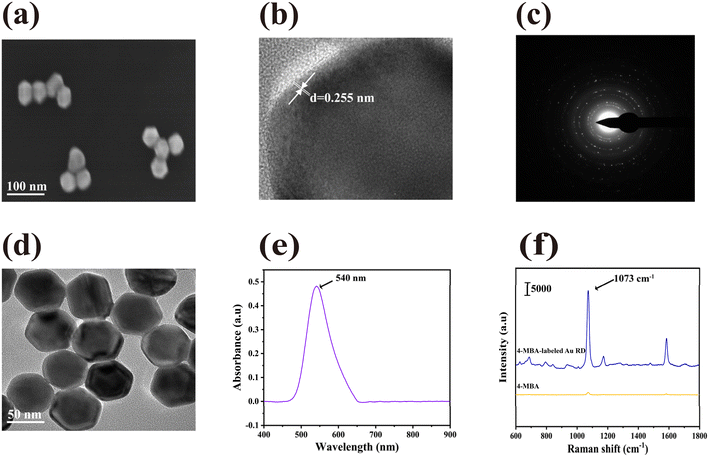
We characterized the morphology and structural characteristics of AuRD by using SEM and TEM. As shown in the typical SEM image in Fig. 2(a), AuRD was well distributed in the solution with uniform morphology and similar structure. Meanwhile, these nanoparticles formed a sharp vertex at the intersection of each edge. In Fig. 2(b), the partially enlarged HRTEM image displayed the crystal structure with a spacing of 0.255 nm. To further characterize its crystal structure, we also captured SAED images of AuRD, as shown in Fig. 2(c), clearly displaying the crystal diffraction pattern. As shown in the TEM image in Fig. 2(d), the typical length of AuRD measured approximately 40 nm, while its typical width was around 35 nm. As shown in Fig. 2(e), the typical UV visible near-infrared spectrum of AuRD showed a pronounced absorption peak at a wavelength of 540 nm. The Raman spectra of 4-MBA-labeled AuRD were shown in Fig. 2(f). Due to the bending of the C–H bonds in the plane and the symmetric stretching of the C![[double bond, length as m-dash]](https://www.rsc.org/images/entities/char_e001.gif) C bonds in 4-MBA, its characteristic peak appeared at 1073 cm−1. As shown in Fig. S1,† 4-MBA had good stability and reproducibility.
C bonds in 4-MBA, its characteristic peak appeared at 1073 cm−1. As shown in Fig. S1,† 4-MBA had good stability and reproducibility.
Finally, according to the formula for calculating the enhancement factor (EF): EF = (ISERS/CSERS)/(IRS/CRS), we calculated the EF of AuRD. I and C represented the intensity and concentration. ISERS represents the SERS intensity of AuRD measured at CSERS concentration. IRS was the Raman intensity of AuRD at CRS concentration under non-SERS conditions. The concentrations of CSERS and CRS were 10−6 M and 10−2 M, respectively. When using the SERS intensity in Fig. 2(f), the calculated SERS EF for AuRD was 3.55 × 10⁵, suggesting that AuRD exhibited a strong surface enhancement effect.
3.3 Qualitative analysis
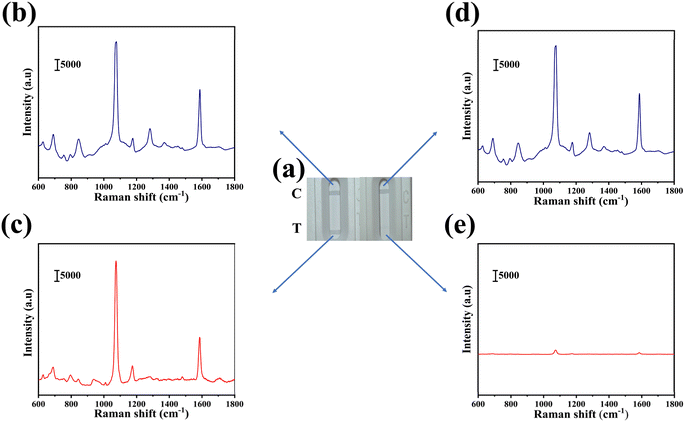
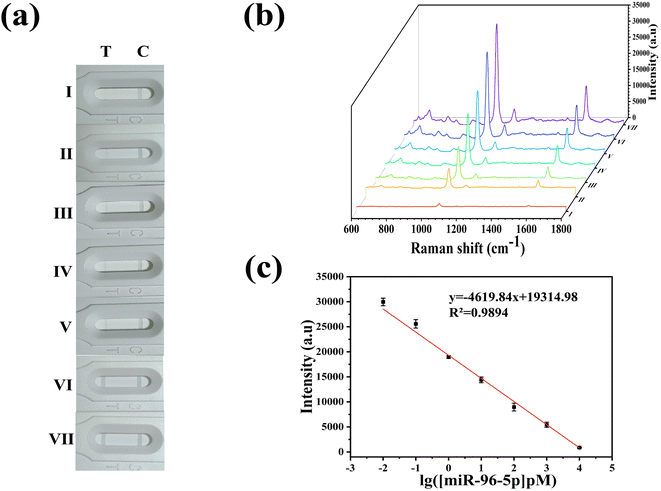
Fig. 3(a) presented two different test outcomes on the T line, which served as indicators for the presence or absence of miR-96-5p in the sample. SERS spectra corresponding to the T line and the C line were depicted in Fig. 3(b)–(e). In cases where miR-96-5p was detected in the sample, it exhibited a preference for binding to hpDNA-bio, leading to the accumulation of the corresponding SERS marker on the C line, while minimal accumulation occurred on the T line. This differential accumulation was qualitatively analyzed by observing visible color changes. By comparing color intensities between the C line and the T line, the presence or absence of miR-96-5p in the sample could be determined. On the contrary, when miR-96-5p was absent in the sample, the SERS tags bound to hpDNA-bio and accumulated predominantly on the T line, causing observable color changes. The qualitative analysis of miR-96-5p was performed by comparing the colors on the T line. Observation of color intensity or the presence of the SERS marker on the T line enabled the identification of the absence of miR-96-5p in the sample. This color-based analysis offered a concise and efficient approach for qualitatively detecting miR-96-5p. Due to the binding of GMIgG and MIgG, the unreacted SERS tag aggregated on the C line. Consequently, the C line consistently exhibited coloration regardless of the presence or absence of miR-96-5p in the sample, serving as a reliable control indicator to ensure the accuracy of the test result. As illustrated in Fig. 3(c), the absence of miR-96-5p (0 μg mL−1) in the sample resulted in coloration on the T line, accompanied by the characteristic peak at 1073 cm−1. Similarly, in Fig. 3(e), the presence of miR-96-5p (1000 μg mL−1) led to the disappearance of color on the T line, and the characteristic peak at 1073 cm−1 vanished. Thus, the presence or absence of color and the maximum value at 1073 cm−1 could serve as indicators for determining positive or negative miR-96-5p results in the sample. Fig. 3(b) and (d) illustrated the corresponding characteristic peaks at 1073 cm−1 on the corresponding C line. The presence of color and peaks provided a reliable indicator for the qualitative analysis of miR-96-5p deletions in the sample.3.4 Optimized the parameters of SERS-LFA strips
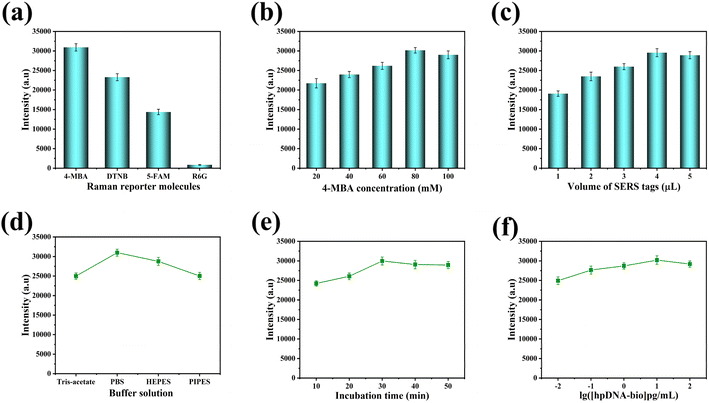
We examined various analytical parameters, including types of Raman reporter molecules, 4-MBA concentrations and volumes, buffer solutions, incubation times, and hpDNA-bio concentrations, to determine their effects on the sensitivity of SERS-LFA strips. These parameters were subjected to optimization procedures. Furthermore, a SERS intensity of 1073 cm−1 was utilized to gauge the sensitivity achieved in the analysis. Optimization experiments were conducted to identify the most suitable Raman reporter molecule for maximizing SERS signal enhancement. 4-MBA, DTNB, 5-FAM, and R6G were selected as candidates for evaluation and comparison due to their known enhancement properties of SERS. Experimentally, it was determined that 4-MBA yielded the highest and most robust signal enhancement for the specific application. As shown in Fig. 4(a), the SERS intensity was optimized when 4-MBA served as the Raman reporter molecule, underscoring its superiority among the tested candidates. Therefore, 4-MBA was considered the most appropriate choice to maximize the enhanced SERS signal. Subsequently, the concentration of 4-MBA as the Raman reporter molecule was optimized. As depicted in Fig. 4(b), the SERS intensity peaked at 80 mM of 4-MBA concentration, signifying its optimal selection to maximize the SERS intensity. Next, the volume of the 4-MBA solution was optimized. As portrayed in Fig. 4(c), the maximum intensity of SERS was achieved with the addition of 4 μL of the 4-MBA solution, designating 4 μL as the optimal volume for attaining the highest SERS intensity. Various buffers were assessed for their impact on the binding of ssDNA to hpDNA-bio. Among Tris-acetate, PBS, HEPES, and PIPES, PBS exhibited the strongest SERS intensity and was therefore chosen as the buffer solution for the experiment in Fig. 4(d). The incubation time was optimized by evaluating durations of 10 min, 20 min, 30 min, 40 min, and 50 min. As demonstrated in Fig. 4(e), the SERS intensity reached a peak at 30 min of incubation time, indicating optimal reaction saturation. The impact of increasing the concentration of the hpDNA-bio solution on SERS intensity was also investigated. As depicted in Fig. 4(f), SERS intensity saturated when the hpDNA-bio concentration reached 10 pg mL−1, thus designating 10 pg mL−1 as the optimal concentration to achieve maximum SERS intensity in the experiment.3.5 Specificity, reproducibility, and consistency of SERS-LFA strips
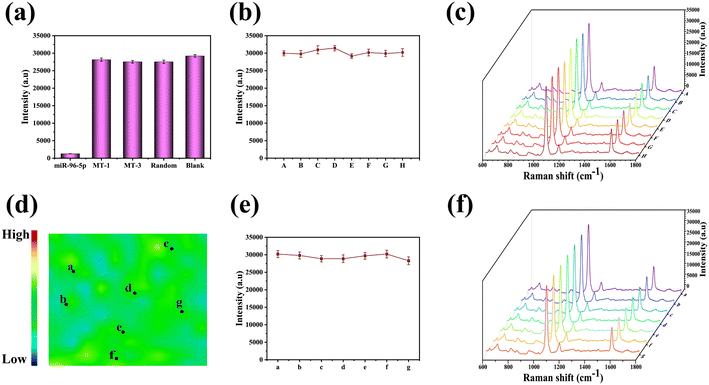
Under optimal test factors, the specificity of SERS-LFA strips was investigated, a critical aspect for the accuracy of the SERS-LFA. Single-nucleotide mismatch (MT1), triplet-nucleotide mismatch (MT3), and random sequences were chosen as interfering miRNAs to assess the specificity of the SERS-LFA strips. The concentrations of miR-96-5p and the interfering miRNAs were standardized at 10 mM in a PBS solution. Furthermore, the intensity of the peak at 1073 cm−1 was designated as the characteristic peak to observe and analyze miR-96-5p in our experiments. As depicted in Fig. 5(a), the experimental findings revealed efficient binding of SERS tags to hpDNA-bio when the sample included MT1, MT3, random sequences, and blank control, leading to visible coloration on the strips and a significant increase in the measured SERS intensity. Importantly, in the presence of miR-96-5p in the sample, it competitively interacted with the ssDNA on the SERS tags for binding to hpDNA-bio. MiR-96-5p exhibited superior binding affinity compared to ssDNA, consequently diminishing the binding of the SERS tags to the SERS-LFA strips and resulting in a reduction in the measured SERS intensity. To assess the reproducibility of SERS-LFA strips, 8 distinct batches of strips were fabricated at various time points. As illustrated in Fig. 5(b) and (c), minimal discrepancies were observed in the measured SERS spectral intensity and shape across the different batches. This finding underscores the reproducibility of SERS-LFA strips, confirming that consistent and reliable results can be achieved using this approach in multiple batches.Consistency played a crucial role in detection using the SERS-LFA strips. Initially, the T line was labeled with 4-MBA, and the resulting SERS profile measurements are presented in Fig. 5(d). The scanning range of the T line was evaluated as 50 × 50 mm2, and the maximum intensity at 1073 cm−1 was graphed for each point. The SERS signal strength was depicted using a spectrum of colors, which transitioned from blue (indicating the lowest intensity) through green, orange, and yellow, to red (representing the highest intensity). Although minor variations were observed, the overall consistency of the SERS-LFA strips was deemed satisfactory. Additionally, the SERS spectra were measured at 7 randomly selected points along the T line. As illustrated in Fig. 5(e) and (f), the deviation in signal intensity at 1073 cm−1 among these 7 points on the T line was calculated to be 2.65%. This observation indicated that the SERS-LFA strips exhibited relatively minimal deviations in signal intensity at different points on the T line, thereby further confirming their consistency and reliability.
3.6 Sensitivity of the SERS-LFA strips
To test the sensitivity of the SERS-LFA strips, we experimented with various dilutions of miR-96-5p in human serum. Fig. 6(a) and (b) showed a photographic image of the miR-96-5p test system (ranging from 10 fM to 10 nM). As the concentration of miR-96-5p decreases, the SERS signal increases and the corresponding color change in the test system becomes apparent. Furthermore, we observed a strong linear correlation between the SERS intensity measured at 1073 cm−1 and the logarithm of the concentration of miR-96-5p. According to Fig. 6(c), the relevant linear regression equation was y = −4619.84x + 19![[thin space (1/6-em)]](https://www.rsc.org/images/entities/char_2009.gif) 314.98 and R2 was 0.9894. We calculated the detection limit of miR-96-5p in human serum applying the formula LOD = 3 × SDblank (where SDblank was the standard deviation of the blank measurement) as LOD = 3.7 fM. As shown in Table 3, the LOD was relatively low compared to most miRNA assays. Therefore, SERS-LFA strips could detect miR-96-5p with high sensitivity and could meet the clinical needs for diagnosis.
314.98 and R2 was 0.9894. We calculated the detection limit of miR-96-5p in human serum applying the formula LOD = 3 × SDblank (where SDblank was the standard deviation of the blank measurement) as LOD = 3.7 fM. As shown in Table 3, the LOD was relatively low compared to most miRNA assays. Therefore, SERS-LFA strips could detect miR-96-5p with high sensitivity and could meet the clinical needs for diagnosis.
| Method | Detection target | Linear range | LOD | Time | Ref. |
|---|---|---|---|---|---|
| SERS | miR-21 | 10 pM to 10 nM | 4 pM | 90 min | 46 |
| SERS | miR-375 | 10 fM to 1 nM | 10 fM | 60 min | 47 |
| Immunoassay | miR-21 | 200 fM to 2 nM | 13 fM | 120 min | 48 |
| Electrochemical | miR-21 | 10 pM to 10 mM | 1.73 pM | 60 min | 49 |
| Fluorescence | miR-141 | 5 pM to 5 nM | 0.42 pM | 90 min | 50 |
| SERS | miR-96-5p | 10 fM to 10 nM | 3.7 fM | 30 min | This work |
3.7 Clinical application of the SERS-LFA strips
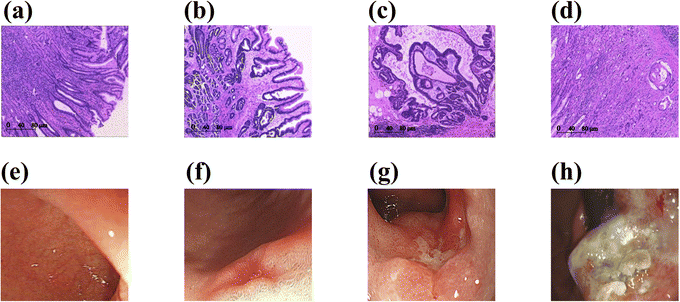
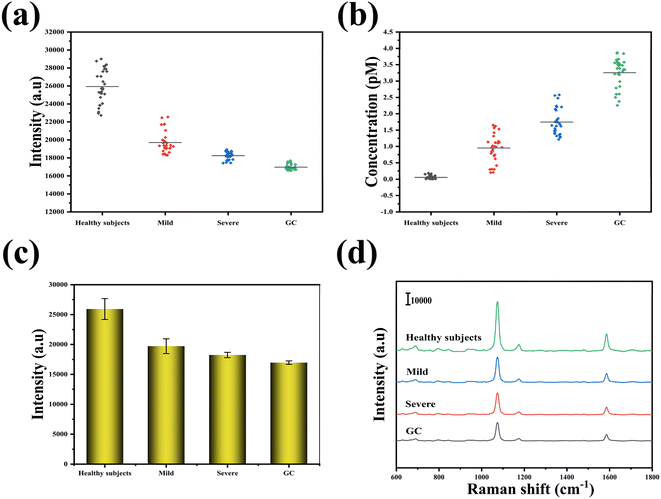
To assess the practicality of using SERS-LFA strips in clinical settings, we employed them to detect the presence of miR-96-5p in serum specimens collected from a cohort consisting of 30 healthy subjects, 30 patients with mild intraepithelial neoplasia, 30 patients with severe intraepithelial neoplasia, and 30 patients diagnosed with GC. Typical pathological and gastroscopic images of the four populations are shown in Fig. 7. The SERS intensities and concentration of miR-96-5p in the serum of 120 patients were shown in Fig. 8(a) and (b). Through the analysis of the SERS signals acquired from these specimens, we aimed to determine the potential diagnostic or prognostic utility of miR-96-5p in various disease conditions. An intensity histogram of the SERS spectra measured at 1073 cm−1 was presented in Fig. 8(b). As illustrated in Fig. 8(c), mean SERS spectra of miR-96-5p were derived for the four distinct populations under investigation: healthy subjects, patients with mild intraepithelial neoplasia, patients with severe intraepithelial neoplasia and patients with GC. This histogram offered a visual representation of the distribution of SERS signal intensity at specific characteristic peaks of miR-96-5p within the population studied. The intensity of SERS at 1073 cm−1 exhibited a gradual decline with disease progression. Subsequently, the varying peak intensities were substituted into the previous regression equation to determine the concentration of miR-96-5p. As shown in Tables S1–S4,† miR-95-5p was measured by SERS and qRT-PCR in 120 patients, and the relative error between the two methods was presented. The mean values of miR-95-5p measured by SERS and qRT-PCR in four different populations were shown in Table 4. The relative errors between SERS-LFA and qRT-PCR for the detection of medical serum were presented in Table 4, showing values of −3.509%, 5.692%, −3.693%, and 4.908%. The congruence of the results obtained from these two methods suggests promising clinical utility for SERS-LFA.| SERS (pM) | qRT-PCR (pM) | Relative error (%) | |
|---|---|---|---|
| Healthy subjects | 0.055 | 0.057 | −3.509 |
| Mild | 0.947 | 0.896 | 5.692 |
| Severe | 1.747 | 1.814 | −3.693 |
| GC | 3.249 | 3.097 | 4.908 |
4. Conclusion
To summarize, we developed a competitive LFA technique utilizing SERS that provided high-sensitivity and quantitative analysis capabilities for miR-96-5p. The upregulated expression of miR-96-5p in patients with GC made it an ideal and emerging biomarker for diagnostic purposes. In our approach, miR-96-5p competed with ssDNA on the SERS tag and bound to capture hpDNA-bio immobilized on the T line of the SERS-LFA strips. By measuring the SERS intensity along the T line, we quickly and accurately measured miR-96-5p levels. The sensitivity of our method was assessed, yielding a LOD value of 3.7 fM. Furthermore, our method exhibited a robust linear relationship between miR-96-5p concentration and SERS intensities in the range of 10 fM to 10 nM. Moreover, the SERS-based competitive LFA technique offered simplicity, convenience, and rapidity, holding great promise for clinical applications in GC detection.Ethical statement
During the experiment, ethical guidelines were strictly adhered to, and donors all signed informed consent forms. This work was approved by the Ethics Committee. The guidelines of the Declaration of Helsinki were followed.Data availability
We confirm that the data supporting the findings of this study are available in the main article and ESI.†Conflicts of interest
There are no conflicts that need to be declared.Acknowledgements
This work was supported by the key project of the Jiangsu Provincial Health Commission (No. ZD2021038), the Key Project for Social Development of Yangzhou (No. YZ2023147).References
- H. Sung, J. Ferlay, R. L. Siegel, M. Laversanne, I. Soerjomataram, A. Jemal and F. Bray, Ca-Cancer J. Clin., 2021, 71, 209–249 CrossRef PubMed
.
- F. Bray, J. Ferlay, I. Soerjomataram, R. L. Siegel and L. A. Torre, Ca-Cancer J. Clin., 2018, 68, 394–424 CrossRef PubMed
.
- E. C. Smyth, M. Nilsson, H. I. Grabsch, N. C. T. van Grieken and F. Lordick, Lancet, 2020, 396, 635–648 CrossRef PubMed
.
- F. Kamangar, G. M. Dores and W. F. Anderson, J. Clin. Oncol., 2006, 24, 2137–2150 CrossRef PubMed
.
- M. Alsina, V. Arrazubi, M. Diez and J. Tabernero, Nat. Rev. Gastroenterol. Hepatol., 2023, 20, 155–170 CrossRef CAS PubMed
.
- F. Lordick, F. Carneiro, S. Cascinu, T. Fleitas, K. Haustermans, G. Piessen, A. Vogel and E. C. Smyth, Ann. Oncol., 2016, 27, v38–v49 CrossRef
.
- D. J. Gibbings, C. Ciaudo, M. Erhardt and O. Voinnet, Nat. Cell Biol., 2009, 11, 1143–1149 CrossRef CAS
.
- A. M. Cheng, M. W. Byrom, J. Shelton and L. P. Ford, Nucleic Acids Res., 2005, 33, 1290–1297 CrossRef CAS PubMed
.
- Y. Cai, X. Yu, S. Hu and J. Yu, Genomics, Proteomics Bioinf., 2009, 7, 147–154 CrossRef CAS PubMed
.
- K. H. Yeom, Y. Lee, J. Han, M. R. Suh and V. N. Kim, Nucleic Acids Res., 2006, 34, 4622–4629 CrossRef CAS
.
- H. Y. Zhou, C. Q. Wu and E. X. Bi, World J. Gastroenterol., 2019, 25, 6823–6834 CrossRef CAS PubMed
.
- C. Zhang, C. D. Zhang, Y. Liang, K. Z. Wu, J. P. Pei and D. Q. Dai, Life Sci., 2020, 106, 312–317 Search PubMed
.
- A. E. Heverhagen, N. Legrand, V. Wagner, V. Fendrich, D. K. Bartsch and E. P. Slater, Neuroendocrinology, 2018, 106, 312–317 CrossRef CAS
.
- X. H. He and K. J. Zou, J. Biochem., 2020, 167, 101–108 CrossRef CAS PubMed
.
- N. Patenge, R. Pappesch, A. Khani and B. Kreikemeyer, Front. Genet., 2015, 6, 189 CrossRef
.
- X. Li, M. Ni and Y. Zhang, Methods, 2012, 58, 151–155 CrossRef CAS
.
- P. White, RNA Interference Techniques, 2011, vol. 58, pp. 91–111 Search PubMed
.
- J. F. Li, Y. F. Huang, Y. Ding, Z. L. Yang, S. B. Li, X. S. Zhou, F. R. Fan, W. Zhang, Z. Y. Zhou, D. Y. Wu, B. Ren, Z. L. Wang and Z. Q. Tian, Nature, 2010, 464, 392–395 CrossRef CAS
.
- S. Nie and S. R. Emory, Science, 1997, 275, 1102–1106 CrossRef CAS PubMed
.
- C. Y. W. Cao, J. Rongchao and C. A. Mirkin, Science, 2002, 297, 1536–1540 CrossRef
.
- H. Torul, E. Yıldırım and U. Tamer, Curr. Opin. Biomed. Eng., 2023, 28, 100510 CrossRef CAS
.
- M. Lu, Y. Joung, C. S. Jeon, S. Kim, D. Yong, H. Jang, S. H. Pyun, T. Kang and J. Choo, Nano Convergence, 2022, 9, 39 CrossRef CAS PubMed
.
- E. Song, I. Kim, C. Jeon and S. Pyun, Microchem. J., 2023, 193, 108962 CrossRef CAS
.
- G. Li, S. Ge, P. Niu, J. Zhang, Y. Mao, Y. Wang and A. Sun, Biomed. Opt. Express, 2022, 13, 4102–4117 CrossRef CAS
.
- K. L. Wustholz, A. I. Henry, J. M. McMahon, R. G. Freeman, N. Valley, M. E. Piotti, M. J. Natan, G. C. Schatz and R. P. V. Duyne, J. Am. Chem. Soc., 2010, 132, 10903–10910 CrossRef CAS
.
- V. Amendola, R. Pilot, M. Frasconi, O. M. Maragò and M. A. Iatì, J. Phys.: Condens. Matter, 2017, 29, 203002 CrossRef PubMed
.
- C. J. Murphy, A. M. Gole, J. W. Stone, P. N. Sisco, A. M. Alkilany, E. C. Goldsmith and S. C. Baxter, Acc. Chem. Res., 2008, 41, 1721–1730 CrossRef PubMed
.
- K. Rhee, A. Tukova, M. T. Yaraki and Y. Wang, Nanoscale, 2023, 15, 2087–2095 RSC
.
- M. Grzelczak, J. Pérez-Juste, P. Mulvaney and L. M. Liz-Marzán, Colloidal Synth. Plasmonic Nanomet., 2020, 197–220 Search PubMed
.
- A. R. Tao, S. Habas and P. Yang, Small, 2008, 4, 310–325 CrossRef
.
- H. L. Wu, H. R. Tsai, Y. T. Hung, K. U. Lao, C. W. Liao, P. J. Chung, J. S. Huang, I. C. Chen and M. H. Huang, Inorg. Chem., 2011, 50, 8106–8111 CrossRef PubMed
.
- Q. Hu, Q. Wei, P. Zhang, S. Li, L. Xue, R. Yang, C. Wang and L. Zhou, Analyst, 2018, 143, 4646–4654 Search PubMed
.
- J. Li, J. Xu, Y. Pan, Y. Zhu, Y. Wang and S. Chen, Food Sci. Hum. Wellness, 2023, 12, 912–919 CrossRef
.
- D. M. Nathan, A. Griffin, F. M. Perez, E. Basque, L. Do and B. Steiner, J. Diabetes Sci. Technol., 2019, 13, 1149–1153 CrossRef PubMed
.
- C. Wang, C. Wang, J. Li, Z. Tu, B. Gu and S. Wang, Biosens. Bioelectron., 2022, 214, 114525 CrossRef PubMed
.
- M. K. Dey, M. Iftesum, R. Devireddy and M. R. Gartia, Anal. Methods, 2023, 15, 4351–4376 RSC
.
- S. R. Peng, M. Fan, C. X. Xiao, Y. T. Chen, R. Y. You, Y. J. Xu, Y. M. Chen, Y. Z. Liu, X. F. Xiao, S. Y. Feng and Y. D. Lu, Sens. Actuators, B, 2024, 401, 135012 CrossRef
.
- K. Kim, D. K. Han, N. Choi, S. H. Kim, Y. Joung, K. Kim, N. T. Ho, S. W. Joo and J. Choo, Anal. Chem., 2021, 93, 6673–6681 CrossRef
.
- V. T. Nguyen, S. Song, S. Park and C. Joo, Biosens. Bioelectron., 2020, 152, 112015 CrossRef CAS
.
- Q. Zhang, L. Fang, B. Jia, N. Long, L. Shi, L. Zhou, H. Zhao and W. Kong, TrAC, Trends Anal. Chem., 2021, 144, 116427 CrossRef CAS
.
- K. Kim, D. K. Han, N. Choi, S. H. Kim, Y. Joung, K. Kim, N. T. Ho, S. W. Joo and J. Choo, Anal. Chem., 2021, 93, 6673–6681 CrossRef CAS PubMed
.
- Y. Pan, D. Fei, P. Liu, X. Guo, L. Peng, Y. Wang, N. Xu and X. Wei, Food Anal. Methods, 2021, 14, 2642–2650 CrossRef
.
- Y. Mao, Y. Sun, J. Xue, W. Lu and X. Cao, Anal. Chim. Acta, 2021, 1178, 338800 CrossRef CAS
.
- H. Shen, E. Song, Y. Wang, L. Meng, J. Dong, B. Lin, D. Huang, Z. Guan, C. Yang and Z. Zhu, Anal. Bioanal. Chem., 2022, 414, 507–513 CrossRef CAS
.
- J. Liu, J. Shi, Q. Feng, W. Fan and C. Liu, Chem. Commun., 2023, 59, 11851–11854 RSC
.
- Y. Cui, J. Zheng, W. Zhuang and H. Wang, New J. Chem., 2021, 45, 10907–10913 RSC
.
- C. Tang, Z. Huang, H. Li, R. Zhang, G. Yu, J. Kong, H. Chen and W. Weng, Sens. Diagn., 2023, 2, 1553–1560 RSC
.
- J. Hu, Z. Li, H. Zhang, R. Liu and Y. Lv, Anal. Chem., 2020, 92, 8523–8529 CrossRef PubMed
.
- S. Kasturi, Y. Eom, S. R. Torati and C. Kim, J. Ind. Eng. Chem., 2021, 93, 186–195 CrossRef
.
- Y. Sun, C. Wang, L. Tang, Y. Zhang and G. J. Zhang, RSC Adv., 2021, 11, 2968–2975 RSC
.
Footnotes |
| † Electronic supplementary information (ESI) available. See DOI: https://doi.org/10.1039/d4ra03880k |
| ‡ Both authors contributed equally to this work. |
| This journal is © The Royal Society of Chemistry 2024 |

