 Open Access Article
Mechanical properties and water vapour corrosion behaviour of AlxCoCrFeNi high-entropy alloys
Jingyu Zhang†
ac,
Lin Huang†ac,
Ke Xiong*ac,
Xiaofeng Wangd,
Zhengyun Wangb,
Dashan Guoac,
Ziqi Liac and
Wei Feng *abce
*abce
aSchool of Mechanical Engineering, Chengdu University, Chengdu 610106, China. E-mail: fengwei@cdu.edu.cn; xiongke@stu.cdu.edu.cn
bKey Laboratory of Materials and Surface Technology (Ministry of Education), School of Materials Science and Engineering, Xihua University, Chengdu 610039, Sichuan, China
cSichuan Province Engineering Technology Research Center of Powder Metallurgy, Chengdu 610106, China
dGuang'an Vocational and Technical College, Sichuan 638000, China
eMaterial Corrosion and Protection Key Laboratory of Sichuan Province, Zigong 643002, China
First published on 7th August 2024
Abstract
AlxCoCrFeNi (x = 0.1, 0.5 and 1) high-entropy alloys (HEAs) were prepared using a spark plasma sintering (SPS) technique combined with aerosol powder. Their microstructure and phase constituents were characterized using an X-ray diffractometer and SEM, and their tensile properties, hardness and compactness were tested. The results show that the crystal structure of the AlxCoCrFeNi HEAs changed significantly with the Al content, from the original single face-centered cubic FCC phase (Al0.1CoCrFeNi) to an FCC + BCC structure (Al0.5CoCrFeNi), and then to FCC + BCC + sigma (σ) phase structures (AlCoCrFeNi). Chemical composition analysis showed that the crystal structure transformation was related to the segregation caused by the increased Al content. The hardness of the AlxCoCrFeNi HEAs increases with increasing Al content, and the hardness of AlCoCrFeNi reaches a maximum of 507.3 HV. The tensile properties of the alloy show a trend of first increasing and then decreasing with increasing Al content, and the yield strength, ultimate tensile strength and elongation of the Al0.5CoCrFeNi alloy reach maximum values of 527.4 MP, 943.3 MPa and 28.2%, respectively. The fracture mechanism of the Al0.1CoCrFeNi and Al0.5CoCrFeNi alloys is typical ductile fracture, while that of the AlCoCrFeNi alloy is cleavage fracture. The compactness of the alloy increases with the Al content. The samples were also subjected to high-temperature water vapour corrosion, and corrosion products such as Al3Fe5O12, CoCr2O4 and NiCr2O4 were found in the Al0.1 and Al0.5 alloys, whereas no oxide peaks were detected using XRD for the Al1 alloy. It was also presumed that a very thin alumina film was generated on the surface of the Al1 alloy, preventing the oxidation of the sample, in combination with the analysis of SEM, EDS and XPS behaviour.
1. Introduction
With the continuous progress of science and technology, the service temperature, strength and corrosion resistance requirements of materials continue to increase. When the contents of various elements are too high in traditional alloys, the brittleness of the material will increase, and its toughness and plasticity will decrease, and as a result, the comprehensive properties of the material will not meet the performance requirements.1–6 The Taiwanese scholar Ye Junwei first designed and fabricated a high-entropy alloy using arc melting. High-entropy alloys are dominated by multiple elements, with no less than five types of elements, and the atomic percentage of each element ranges from 5% to 35%.7–10 Compared with traditional alloys, the high-entropy alloys exhibit improved properties due to the addition of multiple elements, and the properties are different from those of traditional alloys due to the combination of multiple elements.11–13At present, there are many methods to prepare high-entropy alloys. Vacuum arc melting is a popular method to prepare high-entropy alloys due to its short preparation time and low cost. However, the grain size of the resulting alloy is large. Vacuum hot pressing sintering has a relatively long preparation cycle due to the slow heating rate, the sintering temperature is too high, the sample density is not high enough. Due to these and other shortcomings, this method has fallen out of favour.14–17
Compared with hot pressing sintering, the sintering temperature of spark plasma sintering (SPS) technology can be reduced by 100–200 °C, because the pulse current and pressure are applied to the powder at the same time in the sintering process to achieve rapid low-temperature sintering and obtain a high-performance dense block material.18 In spark plasma sintering technology, the sintering time is short because of the rapid heating rate, the alloy prepared has high density, and the sample grain is small. At present, there are few reports on the preparation of AlxCoCrFeNi high-entropy alloys using spark plasma sintering.
Moreover, research into the mechanism of the high-temperature steam corrosion of high-entropy alloys is still in the stage of describing the basic corrosion phenomenon.19–22 The addition of Al, Cr and other elements can promote the formation of BCC phase, and can lead to the formation dense Al2O3 and Cr2O3 films at high temperature to prevent further corrosion of the material.23 J. M. Guilemany et al. found that the oxidation layer was uniform and continuous at 900 °C, and speculated that 900 °C was the boundary temperature for oxidation resistance.24 The lack of systematic and comprehensive research on corrosion mechanisms has gradually affected the service process of high-entropy alloys, so it is urgent to study the mechanism of high-temperature steam corrosion of alloys.25
In this paper, spark plasma sintering was used to prepare AlxCoCrFeNi high-entropy alloys, and the effect of the Al content on the microstructure and properties of the AlxCoCrFeNi high-entropy alloys was studied. An ultra-high temperature water vapour reaction device developed by the research group with its own patent was used.26 The effect of the Al content on water vapour corrosion behaviour of the AlxCoCrFeNi high-entropy alloy was studied.
2. Experimental procedure
2.1 AlxCoCrFeNi high-entropy alloy prepared using SPS
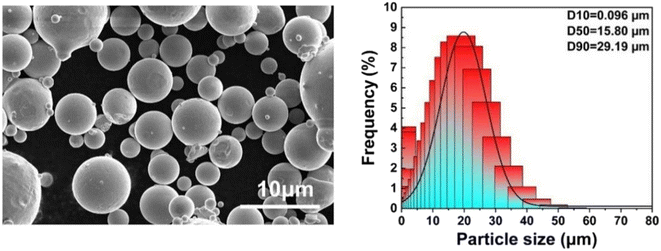
In the experiment, AlxCoCrFeNi (x = 0.1, 0.5, 1) was prepared as a spherical metal powder using the aerosol method. The powder size was 100–300 mesh (Jiangsu Vilory Advanced Materials Technology Co. Ltd, Jiangsu, China). It can be seen that the powder particles are spherical, and that small nearly spherical particles are attached to the surface, which is related to the pre-cooling solidification of the powder in the process of atomization into powder.27,28 About 90% of the powder particles have a size of ≤31.6 μm, about 50% of the powder particles have a size of ≤16.8 μm, and 10% of the powder particle sizes have a size ≤ 8.3 μm, indicating the overall normal distribution of powder particle size.The powder was filled into a ∅ 20 mm graphite mold and sintered using spark plasma sintering (SPS, LABOX-350, SINTER LAND INC., Chiyo, Japan) with a constant axial pressure of 30 MPa. Cylindrical samples with a diameter of 20 mm and thickness of about 10 mm were produced by sintering for 10 min at 1050 °C. The pressure was removed immediately after sintering was completed and the sample was taken out after the furnace had cooled. The samples are denoted as Al0.1CoCrFeNi (Al0.1), Al0.5CoCrFeNi (Al0.5), and AlCoCrFeNi (Al1), respectively.
2.2 Microstructural and mechanical property characterization
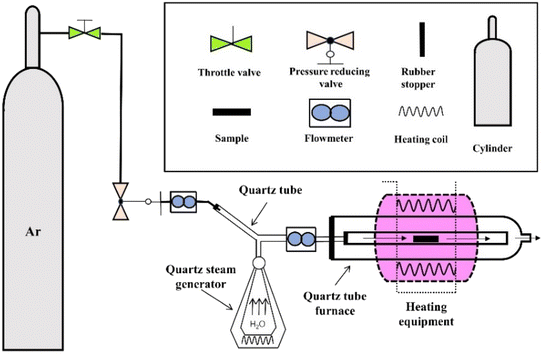
The phase compositions of the powders and the samples were identified using X-ray diffraction equipment (XRD, DX-2700B, Dandong Haoyuan Instrument Co. Ltd, Dandong, China) with Cu Kα radiation (λ = 0.154598 nm). The microstructure of the milled powders and bulk samples were observed using scanning electron microscopy (SEM, Inspect F50, FEI, USA) using backscattered electron (BSE) imaging. Energy-dispersive X-ray spectroscopy (EDS, Inca X-sight) was also employed to determine the phase composition. The micro-hardness (HV) of the samples was measured using a Vickers hardness tester (MHVD-50AP, Shanghai Jujing Precision Instrument Co., Ltd, Shanghai, China) with a load of 5 kg using 7 indents for each alloy at ambient temperature. Room-temperature tensile tests were performed using an ETM-105 D universal testing machine (Shenzhen Wance Test Equipment Co., Ltd, Shenzhen, China). Test conditions: tensile specimens had an original scale distance of 5 mm, a cross-sectional area of 1.5 mm × 1 mm, and a tensile rate of 0.2 mm min−1. Five samples of each alloy were tested to avoid errors.High-temperature steam corrosion was carried out on the sintered sample by means of an independently built high-temperature steam reaction device (shown in Fig. 1). First, the sample was cut into 10 × 10 × 1 mm alloy slices, and the surface oxide layer was polished with sandpaper. The sample was placed into an OTOL-1200 quartz tube furnace, and the Ar gas inlet was closed after the sample was heated to 900 °C at a rate of 10 °C min−1. Steam (flow rate 20–25 mL s−1) was added to maintain the temperature for 5 h, and then the cooled with the furnace. X-ray photoelectron spectroscopy (XPS) was conducted using a Thermo Scientific™ K-Alpha™+ spectrometer equipped with a monochromatic Al Kα X-ray source (1486.6 eV) operating at 100 W.
3. Results and discussion
3.1 Powder micro-morphology analysis
Fig. 2 shows the SEM morphology and particle size distribution of the aerosolised AlxCoCrFeNi (x = 0.1, 0.5, 1) high-entropy alloy powders. From Fig. 2, it can be seen that most of the powder particles are spherical and have relatively smooth surfaces, and their particle size D50 is about 15 μm. A small number of non-spherical powders with small particles (satellites) attached are also found in the figure. Due to the small size of the satellite particles, their solidification speed is fast. The solidified satellite particles will be splashed out under the action of the atomising gas (the large particles require more time to solidify than the satellite particles, and the splashed satellite particles will collide with the large particles), so the satellite particles will combine with the large particles to form an irregular powder. The satellite particles will also reduce the obtuseness of the powder and increase its particle size, which is an important factor leading to decreased powder fluidity.293.2 XRD
Fig. 3 shows the XRD patterns of the AlxCoCrFeNi (x = 0.1, 0.5, 1) high-entropy alloy powders and sintered nuggets. It can be seen that before sintering, the Al0.1CoCrFeNi powder has a single-phase FCC structure, the XRD pattern of the Al0.5CoCrFeNi powder has a two-phase BCC + FCC structure, and the Al1 powder has a single-phase BCC structure. After sintering, the Al0.1CoCrFeNi and Al0.5CoCrFeni alloys were the same as before sintering, with a single-phase FCC and two-phase BCC + FCC structure, respectively. The AlCoCrFeNi alloy, on the other hand, changed from a single-phase BCC structure to a BCC + FCC + σ three-phase structure, which is in agreement with the literature.30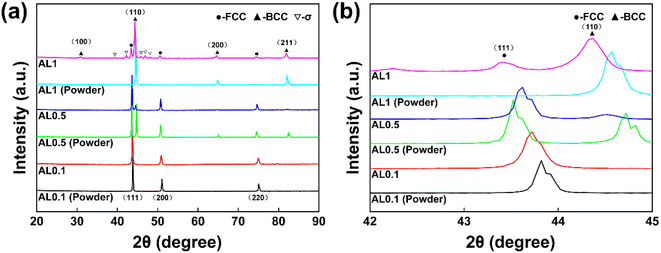 | ||
| Fig. 3 XRD patterns of AlxCoCrFeNi (x = 0.1, 0.5 and 1) HEA powders and alloys. (a): XRD patterns of the powders and alloys, (b): magnification of one region of the pattern. | ||
The Al content has a great influence on the microstructure and structural stability of the high-entropy alloy. The atomic lattice density of the FCC phase is higher, so it is easy to produce lattice distortion energy and lattice strain energy in the FCC phase. With increasing Al content, the FCC phase is gradually transformed into the relatively stable BCC phase in order to release the distortion energy effectively.31,32 With the addition of Al, the diffraction peak of the (110) crystal plane shifts significantly to the right, which is related to the lattice distortion caused by the larger atomic radius of Al atom.33
3.3 Microstructure
Fig. 4 shows the SEM backscattered electron image of the AlxCoCrFeNi high-entropy alloys. As shown in Fig. 4, some microscopic holes were present on the surface of the sample, which is due to the inhomogeneity of the current during the SPS sintering process, resulting in a high local current density and high temperature in the sintered neck. Also, the powder is volatile at higher sintering temperatures, which results in the formation of micropores. As shown in Fig. 4(a), the microstructure of the Al0.1 alloy has a uniform distribution along with some micropores, indicating the formation of a single solid solution phase. The EDS results for different regions of the three samples are shown in Table 1. Based on the relative peak intensities in the XRD plots and the EDS results, the white matrix portion is the Fe-, Co- and Cr-rich FCC phase. The BCC phase precipitated in an irregular lumpy manner when the Al content was increased from 0.1 to 0.5. In Fig. 4(b), the bulk BCC phase with a size range of 0.6–5 μm forms two different organisations (white matrix phase, black irregular bulk phase) in the Al0.5 alloy. According to the XRD and EDS results, the white matrix part is the Fe-, Co- and Cr-rich FCC phase and the irregular massive part is the Al- and Ni-rich BCC phase. When the Al content is increased to 1, the irregular massive part disappears and a reticulated and walled structure appears, as shown in Fig. 4(c). The size of the BCC phase is obviously coarsened, and three phases appear at the same time, which are the BCC phase, FCC phase and σ phase, which have the elemental contents shown in the EDS results in Table 1. | ||
| Fig. 4 SEM backscattering electron images of the AlxCoCrFeNi HEAs ((a) Al0.1CoCrFeNi, (b) Al0.5CoCrFeNi, (c) Al1CoCrFeNi). | ||
| AlxCoCrFeNi | Phase | Chemical composition (at%) | ||||
|---|---|---|---|---|---|---|
| Al | Co | Cr | Fe | Ni | ||
| Al0.1 | FCC | 2.40 | 24.84 | 24.37 | 24.17 | 24.37 |
| Al0.5 | FCC | 6.50 | 24.02 | 22.62 | 22.39 | 24.48 |
| BCC | 26.32 | 17.36 | 7.06 | 9.59 | 39.66 | |
| Al1 | FCC | 7.52 | 23.21 | 26.67 | 27.98 | 14.61 |
| BCC | 21.98 | 21.24 | 11.38 | 14.05 | 31.35 | |
| σ | 2.64 | 23.03 | 36.84 | 29.02 | 8.47 | |
Fig. 5 shows the EDS surface scanning spectra of the AlxCoCrFeNi HEAs. In Fig. 5(a), the elements are uniformly distributed in the region, and there is no elemental segregation in the alloy. This indicates that the Al0.1 alloy forms a single phase, i.e., the FCC phase, which is consistent with the results of THE XRD and SEM analyses. When the aluminium content was increased from 0.1 to 0.5, the BCC phase appeared due to the fact that the enthalpy of mixing of aluminium with other elements is more negative than that of the other component-atom pairs in the system (higher enthalpy of mixing of aluminium–nickel), which leads to the phase separation effect. In Fig. 5(c), the elements Al and Ni are mainly distributed in the black (BCC) phase; the elements Fe, Co and Cr are mainly distributed in the grey (FCC) phase; and the elements Cr and Fe are mainly distributed in the bright white (σ) phase, which is consistent with Fig. 4(c) and Table 1. It can be seen that the content of Al plays a crucial role in the formation and stabilisation of the phases.
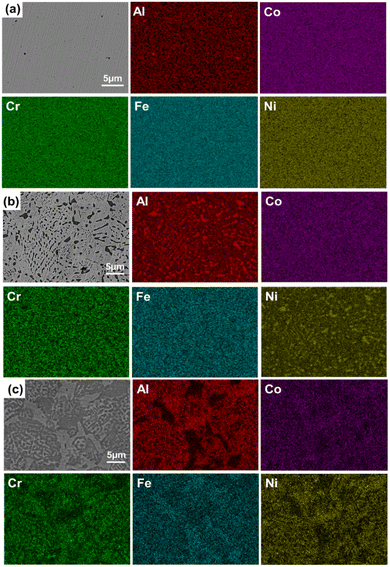 | ||
| Fig. 5 EDS scan results of the AlxCoCrFeNi HEA samples ((a) Al0.1CoCrFeNi, (b) Al0.5CoCrFeNi, (c) Al1CoCrFeNi). | ||
3.4 Vickers hardness and densification analysis
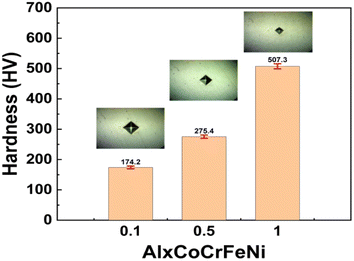
Fig. 6 shows the Vickers hardness diagram of the alloys with different Al content. The element Al plays an important role in promoting the formation of the BCC phase, which is a hard phase in HEAs. The volume fraction of the BCC phase increases with increasing Al content, and hence, the hardness value of the alloys increases with the increase in the Al content. At the same time, the presence of the σ phase in Al1 alloy further improves the hardness of the alloy so that the hardness of Al1 alloy reaches 507.3 HV (about two times higher than the hardness of Al0.1 alloy). Table 2 shows the density and densification of the AlxCoCrFeNi HEAs, and it can be seen that the densification of all three alloys is higher than 98.8%, which is mainly due to the densification sintering process of SPS, which can significantly improve the densification of the alloy lumps during the solid-phase sintering process, thus enhancing the mechanical properties of the materials.| Al0.1 | Al0.5 | Al1 | |
|---|---|---|---|
| Theoretical density (g cm−3) | 7.99 | 7.33 | 6.72 |
| Actual density (g cm−3) | 7.93 | 7.30 | 6.64 |
| Relative density (%) | 99.2 | 99.6 | 98.8 |
3.5 Room-temperature tensile properties and fracture analysis
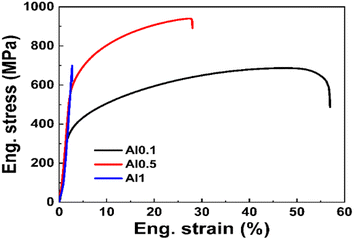
The tensile engineering stress–strain curves of the AlxCoCrFeNi HEAs at room temperature are shown in Fig. 7. Table 3 demonstrates the mechanical properties of the alloys. As shown in Fig. 7, the Al0.1 and Al0.5 alloys underwent plastic deformation fracture and Al1 underwent brittle fracture. The ultimate tensile strength (σmax) of the alloys increases from 687.3 MPa (Al0.1 alloy) to 941 MPa (Al0.5 alloy) and then decreases to 699.8 MPa (Al1 alloy) as the Al content is increased; the yield strength (σ0.2) increases from 243.9 MPa (Al0.1 alloy) to 520.6 MPa (Al0.5 alloy), and then to 0 (Al1 alloy); the plasticity (ε) plasticity changes from 57% (Al0.1 alloy) to 28% (Al0.5 alloy), and then to 2.7% (Al1 alloy). The solid solution of large-size Al atoms into the FCC matrix exacerbates the lattice distortion, impeding the dislocation movement to achieve solid solution strengthening, thus increasing the hardness and strength of the material. The higher the Al content, the more serious the elemental segregation becomes. The lattice distortion is intensified, and the effect of solid solution strengthening is enhanced, thus increasing the hardness and strength of the alloy. At the same time, the BCC phase also enhances the strength and hardness of the alloy. However, the presence of a large number of BCC phases and σ phases (the σ phase is a brittle intermetallic phase in the microstructure of the Al1 alloy) decreases the σmax and plasticity of the Al1 alloy, and Al1 breaks without reaching the ultimate tensile strength during tensile process and does not show any yield performance because the Al1 alloy is too brittle and prone to cracking and extension. When x = 0.5, a better combination of strength and plasticity is achieved, so the overall mechanical properties of the Al0.5 alloy are superior. The phase structure of the alloys varies with the Al content, reflecting the fact that the phase structure plays a crucial role in the strength and plasticity of the material system.| AlxCoCrFeNi | σ0.2 (MPa) | σmax (MPa) | ε (%) | Hardness (HV) |
|---|---|---|---|---|
| Al0.1 | 243.9 ± 3.2 | 687.3 ± 1.2 | 57.0 ± 1.2 | 174.2 ± 4.1 |
| Al0.5 | 520.6 ± 4.1 | 941.0 ± 2.3 | 28.0 ± 0.2 | 275.4 ± 6 |
| Al1 | Unyielding | 699.8 ± 5.3 | 2.7 ± 0.2 | 507.3 ± 4.3 |
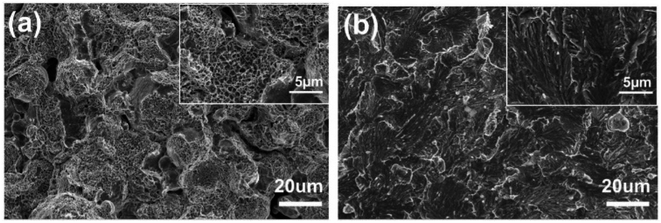
Fig. 8 shows the microscopic morphology of the compression fracture of the AlxCoCrFeNi high-entropy alloy. It can be seen that the SPS-Al1 fracture mode is brittle fracture. In compression, cracks are prone to appear at the interface of the alloy particles and expand along the interface, and when the crack encounters particles in the process of expansion, it will lead to the deflection of cracks and expansion of particles; the fracture mechanism of the SPS-Al1 high-entropy alloy is along-crystal fracture.
3.6 High-temperature steam corrosion morphology and composition analysis
Fig. 9 shows the XRD diffraction patterns of the AlxCoCrFeNi high-entropy alloys after reaction in high-temperature water vapor at 900 °C for 5 h. Based on comparisons with the standard pdf cards, it is found that corrosion products are detected in the alloys of Al0.1 and Al0.5, and the corrosion products are in the form of spinel phases such as Al3Fe5O12, CoCr2O4 and NiCr2O4, while for the alloys of Al1, oxide peaks were not detected using XRD.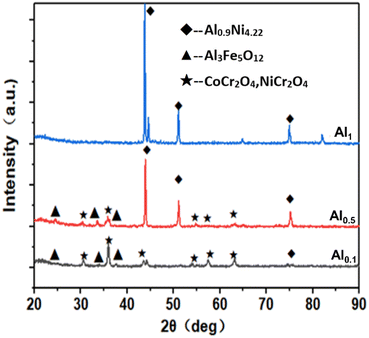 | ||
| Fig. 9 XRD diffraction patterns of AlxCoCrFeNi high-entropy alloys after 5 hours of reaction in water vapor at 900 °C. | ||
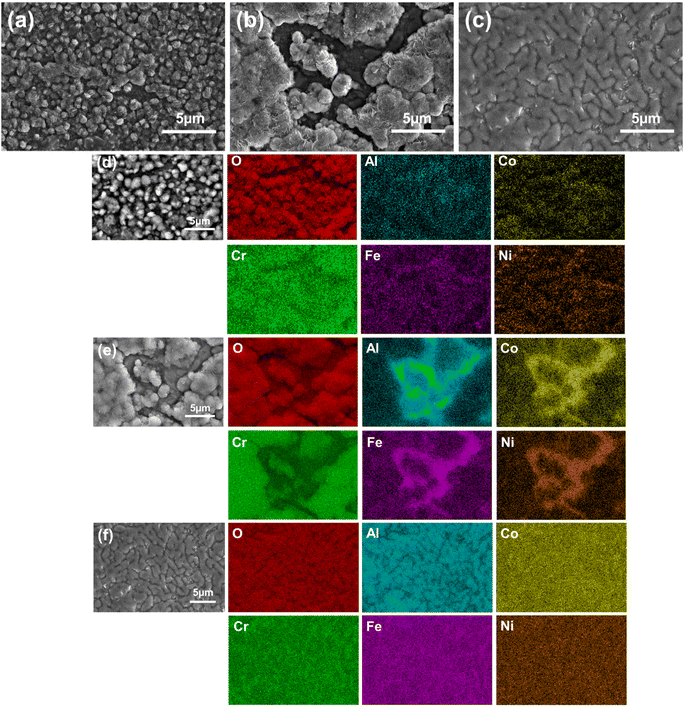
Fig. 10 shows the water vapour corrosion morphologies and EDS scanning spectra of the AlxCoCrFeNi high-entropy alloys at 900 °C. The corrosion products on the surfaces of SPS-Al0.1 and SPS-Al0.5 are in the form of spherical and irregular particles, and the size of the corrosion products is relatively small, whereas those on the corrosion surfaces of the SPS-Al1 alloys are connected to the flakes. The area covered by corrosion products on the surface of the alloy increases gradually with the increase in the content of Al. In order to determine the composition of the corrosion products, EDS was used to analyse the elements on the surfaces. The corrosion products of the Al0.1 and Al0.5 alloys can be seen in Fig. 10(d) and (e) as granular Al3Fe5O12, spinel-like CoCr2O4, NiCr2O4. When the Al content is increased from 0.1 to 0.5, the area covered by the oxide film is obviously increased, and uniformly distributed elements can be observed in the depressed part, which is considered to be the matrix part under the oxide layer. Fig. 10(f) shows the EDS energy spectrum of the Al1 alloy, and it can be seen that the surface of the alloy is essentially completely covered by the oxide of Al without flaking. It is presumed that the corrosion product is a dense aluminium oxide film. This shows that the water vapour corrosion resistance of the AlxCoCrFeNi high-entropy alloys at 900 °C is mainly related to the Al content, and the higher the Al content, the better the high-temperature water vapour corrosion resistance.
In order to further analyse the valence state of Al, XPS was carried out on the corrosion products. As can be seen from Fig. 11, the corrosion products are mainly 3-valent Al. As a result, the corrosion products in Fig. 10 consist mainly of the elements Al and oxygen, so it can be inferred that the corrosion product is Al2O3.
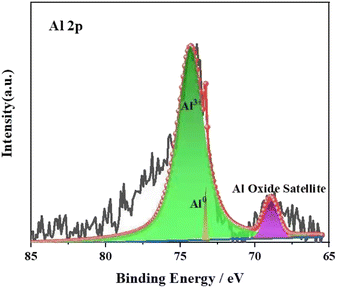 | ||
| Fig. 11 XPS spectra of elemental Al on the sample surface after reaction with water vapour at 900 °C. | ||
4. Conclusion
(1) AlxCoCrFeNi high-entropy alloys with a simple solid solution structure were prepared using SPS, and the resulting solid solution effect leads to enhanced lattice distortion of the FCC matrix in the alloys as the content of aluminium increases.(2) The Vickers hardness of the alloy increases from 174.2 HV in Al0.1 to 507.3 in Al1 with increasing Al content, and the plasticity decreases from 57% in Al0.1 to 2.7% in Al1. The tensile strength, on the other hand, reaches its maximum in Al0.5 alloy at 941 MPa, and the mode of fracture is ductile fracture in the Al0.1 and Al0.5 alloys and cleavage fracture in the Al1 alloy. The solid solution strengthening effect of aluminium and σ-phase precipitation are the main reasons for the changes in the mechanical properties of the alloys.
(3) After water vapour corrosion at 900 °C, the corrosion products in the Al0.1 and Al0.5 alloys are granular Al3Fe5O12, spinel-like CoCr2O4, and NiCr2O4. In the Al1 alloy, the corrosion product is a layer of dense alumina film, and the area of corrosion product increases with increasing Al content.
(4) Based on XPS analysis, the oxidation product of Al1 under water vapour corrosion at 900 °C is an Al2O3 film, and the higher the content of Al, the better the resistance of the alloy to high-temperature water vapour corrosion.
Data availability
All relevant data are within the paper.Author contributions
Conceptualization, X. W., L. H. and W. F.; methodology, J. Z., K. X. and L. H.; validation, J. Z., L. H. and K. X.; formal analysis, L. H. and K. X.; investigation, J. Z. and Z. W.; resources, W. F. and K. X.; data curation, X. W., D. G.; writing—original draft preparation, J. Z., L. H. and K. X.; writing—review and editing, J. Z., L. H. and K. X.; visualization, D. G., W. F.; supervision, W. F. and L. H.; project administration, W. F.; funding acquisition, W. F. and Z. W. All authors have read and agreed to the published version of the manuscript.Conflicts of interest
The authors declare no conflict of interest.Acknowledgements
Research was supported by the Key Laboratory of Materials and Surface Technology, Ministry of Education (No. xxx-2023-yb004) and the Opening Project of Material Corrosion and Protection Key Laboratory of Sichuan Province (2023CL01).References
- C. Shang, E. Axinte, W. Ge, Z. Zhang and Y. Wang, Surf. Interfaces, 2017, 9, 36–43 CrossRef CAS.
- J. Panda, P. Arya, K. Guruvidyathri, Ravikirana and B. Murty, Metall. Mater. Trans. A, 2021, 52, 1679–1688 CrossRef CAS.
- L. Wang, F. Zhang, S. Yan, G. Yu, J. Chen, J. He and F. Yin, J. Alloys Compd., 2021, 872, 159607 CrossRef CAS.
- J. Lu, L. Li, H. Zhang, Y. Chen, L. Luo, X. Zhao, F. Guo and P. Xiao, Corros. Sci., 2021, 181, 109257 CrossRef CAS.
- R. Gawel, Ł. Rogal, J. Dąbek, M. Wójcik-Bania and K. Przybylski, Vacuum, 2021, 184, 109969 CrossRef CAS.
- J. W. Qiao, S. G. Ma, E. W. Huang, C. P. Chuang, P. K. Liaw and Y. Zhang, Mater. Sci. Forum, 2011, 688, 419–425 CAS.
- X. Gao, Y. Lu, B. Zhang, N. Liang, G. Wu, G. Sha, J. Liu and Y. Zhao, Acta Mater., 2017, 141, 59–66 CrossRef CAS.
- Q. Li, W. Chen, J. Zhong, L. Zhang, Q. Chen and Z.-K. Liu, Metals, 2017, 8, 16 CrossRef.
- P. Zhou, D. Xiao and T. Yuan, Acta Metall. Sin. (Engl. Lett.), 2020, 33, 937–946 CrossRef CAS.
- A. Karati, K. Guruvidyathri, V. Hariharan and B. Murty, Scr. Mater., 2019, 162, 465–467 CrossRef CAS.
- X. Hu and D. Chen, J. Mater. Eng. Perform., 2018, 27, 3566–3573 CrossRef CAS.
- P. Zhou, Y. Liu, Y. Yu and D. Xiao, Mater. Rep., 2016, 30, 95–98 Search PubMed.
- L. Guo, D. Xiao, W. Wu, S. Ni and M. Song, Intermetallics, 2018, 103, 1–11 CrossRef CAS.
- S. Mohanty, T. Maity, S. Mukhopadhyay, S. Sarkar, N. Gurao, S. Bhowmick and K. Biswas, Mater. Sci. Eng. A, 2017, 679, 299–313 CrossRef CAS.
- Q. Li, T. M. Yue, Z. Guo and X. Lin, Metall. Mater. Trans. A, 2013, 44, 1767–1778 CrossRef CAS.
- S. Rohila, R. B. Mane, G. Ummethala and B. B. Panigrahi, J. Mater. Res., 2019, 34, 777–786 CrossRef CAS.
- L. Meshi, Y. Linden, A. Munitz, S. Salhov and M. Pinkas, Mater. Charact., 2019, 148, 171–177 CrossRef CAS.
- P. Edalati, A. Mohammadi, Y. Tang, R. Floriano, M. Fuji and K. Edalati, Mater. Lett., 2021, 302, 130368 CrossRef CAS.
- L. Chen, K. Bobzin, Z. Zhou, L. Zhao, M. Öte, T. Königstein, Z. Tan and D. He, Metals, 2018, 8, 974 CrossRef CAS.
- A. O. Moghaddam, N. A. Shaburova, M. V. Sudarikov, S. N. Veselkov, O. V. Samoilova and E. A. Trofimov, Vacuum, 2021, 192, 110412 CrossRef.
- M. Karpets, O. Rokytska, M. Yakubiv, V. Gorban, M. Krapivka and A. Samelyuk, Powder Metall. Met Ceram., 2020, 59, 467–476 CrossRef CAS.
- J. Zhang, B. Ren, R. Zhao, Z. Liu, B. Cai and G. Zhang, Micron, 2021, 142, 102995 CrossRef CAS PubMed.
- J. Zhu, S. Lu, Y. Jin, L. Xu, X. Xu, C. Yin and Y. Jia, Oxid. Met., 2020, 94, 265–281 CrossRef CAS.
- J. Guilemany, N. Cinca, S. Dosta and C. Lima, Intermetallics, 2007, 15, 1384–1394 CrossRef CAS.
- Y. Linden, M. Pinkas, A. Munitz and L. Meshi, Scr. Mater., 2017, 139, 49–52 CrossRef CAS.
- W. Feng, Q. Wang, Q. Kong, X. Zhu, J. Wu and C. Sun, Oxid. Met., 2016, 86, 179–192 CrossRef CAS.
- Y. Feng and T. Qiu, J. Alloys Compd., 2012, 513, 455–459 CrossRef CAS.
- Y. Chen, J. Zhang, B. Wang and C. Yao, Vacuum, 2018, 156, 302–309 CrossRef CAS.
- P. Zhou, D. Xiao, Z. Wu and M. Song, Mater. Res. Express, 2019, 6, 0865e0867 Search PubMed.
- K. Xiong, L. Huang, X. Wang, L. Yu and W. Feng, Metals, 2022, 12, 1254 CrossRef CAS.
- C.-C. Tung, J.-W. Yeh, T.-t. Shun, S.-K. Chen, Y.-S. Huang and H.-C. Chen, Mater. Lett., 2007, 61, 1–5 CrossRef CAS.
- C. Li, J. Li, M. Zhao and Q. Jiang, J. Alloys Compd., 2010, 504, S515–S518 CrossRef.
- Y. Wang, Y. Yang, H. Yang, M. Zhang, S. Ma and J. Qiao, Mater. Chem. Phys., 2018, 210, 233–239 CrossRef CAS.
Footnote |
| † J. Z. and L. H. contributed equally to this work. |
| This journal is © The Royal Society of Chemistry 2024 |

