 Open Access Article
Creative Commons Attribution 3.0 Unported Licence
Influence of nickel hydroxide catalyst ink formulation on direct bar coating of anion exchange membranes†
Mohamed Elshamya,
Lukas Metzler ab,
Joey Disch
 ab,
Severin Vierrath
 ab and
Susanne Koch
 *ab
*ab
aElectrochemical Energy Systems, IMTEK Department of Microsystems Engineering, University of Freiburg, Georges-Koehler-Allee 103, 79110 Freiburg, Germany. E-mail: susanne.koch@imtek.uni-freiburg.de
bHahn-Schickard, Georges-Koehler-Allee 103, 79110 Freiburg, Germany
First published on 10th December 2024
Abstract
Achieving uniform and high-performing catalyst-coated membranes (CCMs) is a critical challenge in the field of electrochemical energy conversion technologies. This challenge is particularly pronounced in the coating of catalyst inks, where optimizing ink formulations and mixing conditions is essential for producing homogeneous catalyst layers that enhance electrochemical performance. In this study, we investigate the influence of mixing parameters and solvent composition on the rheological behavior and performance of nickel hydroxide-based anode inks, specifically for application in anion exchange membrane (AEM) electrolysis. We systematically explored the effects of roller mixing speed (30 and 80 rpm), mixing duration (4, 24, and 48 hours), and water content (0, 25, 34, and 51 %) on the morphology and homogeneity of the catalyst layers. Our findings reveal that a mixing speed of 80 rpm and a duration of at least 24 hours are necessary to achieve desirable catalyst layer morphology. Additionally, the presence of water in the ink formulation was critical, with an optimal water content of 34 % (3![[thin space (1/6-em)]](https://www.rsc.org/images/entities/char_2009.gif) :
:![[thin space (1/6-em)]](https://www.rsc.org/images/entities/char_2009.gif) 1, water
1, water![[thin space (1/6-em)]](https://www.rsc.org/images/entities/char_2009.gif) :
:![[thin space (1/6-em)]](https://www.rsc.org/images/entities/char_2009.gif) IPA) yielding the best morphological homogeneity and reproducible electrochemical performance. The study demonstrates a 70 mV reduction in overpotential, resulting in a voltage of 2.05 V at a current density of 1 A cm−2. While mixing parameters minimally impacted the rheological behavior of the inks, they significantly influenced the electrochemical performance and morphology of the CCMs.
IPA) yielding the best morphological homogeneity and reproducible electrochemical performance. The study demonstrates a 70 mV reduction in overpotential, resulting in a voltage of 2.05 V at a current density of 1 A cm−2. While mixing parameters minimally impacted the rheological behavior of the inks, they significantly influenced the electrochemical performance and morphology of the CCMs.
1. Introduction
Amid the intensely growing interest in green hydrogen production, anion exchange membrane (AEM) water electrolysis has garnered significant attention due to its unique capability of combining the main advantages of two commercial water electrolysis technologies. AEM electrolysis allows the use of low-cost, abundant catalysts, as seen in alkaline water electrolysis, while also achieving high current densities similar to proton exchange membrane water electrolysis.1,2 Nickel-based oxygen evolution reaction (OER) catalysts exemplify these low-cost materials, having demonstrated superior electrochemical performance compared to the scarce and expensive iridium oxides in alkaline media.3–5 Despite this progress, identifying an effective substitute for carbon-supported platinum black catalysts for the hydrogen evolution reaction (HER) remains an ongoing challenge.6Ink mixing methods are usually based on ball milling, for example roller and planetary mixers.7,8 Roller mixers are simpler, cheaper and require less maintenance, however, due to their relatively low speed, they require several hours up to two days for ink mixing.7,9 While parameters like solvent composition, mixing time and speed can have a strong effect on ink homogeneity and thus cell performance, the exact influence remains unclear.
Coating these catalysts directly onto a membrane via bar coating has emerged as a promising approach, yielding catalyst layers with state-of-the-art performance that can be scaled for production.9,10 Unlike layer-by-layer spray coating, direct one-step deposition on the membrane demands inks with moderate to high viscosity, depending on the coating technique.7,9 Bar coating, a type of Mayer rod coating, is a popular method due to its ability to generate large-area films efficiently and cost-effectively. The wet thickness of the coating is proportional to the wire diameter of the Mayer rod, and surface tension and viscosity of the ink play critical roles in achieving uniform coatings. Factors such as wetting, leveling, and dewetting are strongly influenced by these properties.11
The microstructure of the catalyst layer (CL) formed during coating is crucial for performance, as it impacts electrode kinetics, mass transport, and overall cell efficiency. The CL microstructure, governed by the interactions between catalyst particles and ionomer within the ink, determines key characteristics such as catalyst-ionomer interaction, ionomer phase continuity, and pore size distribution.12 The microstructure is significantly influenced by the ink's rheological properties, which in turn depend on factors like solvent composition, mixing time, and mixing speed. Rheology serves as a sensitive technique to characterize the bulk microstructure of inks, providing insights into how these properties affect coating uniformity, thickness, and ink penetration into porous substrates, as well as the final CL morphology after drying.13 Thus, understanding and optimizing the rheological behavior of catalyst inks is critical for establishing effective materials-processing-performance relationships in electrode fabrication.
In this study, we focus on optimizing the ink fabrication process for nickel hydroxide (Ni(OH)2)-based catalysts as part of the catalyst-coated membrane (CCM) architecture. Ni(OH)2 is commercially available, cost-effective, and demonstrates acceptable electrochemical performance, making it an ideal candidate for research purposes. The study was conducted in two phases: the first phase varied roller mixer parameters while maintaining a consistent ink composition with deionized water (DI-H2O) as the primary solvent. The second phase explored the effect of solvent composition by adjusting the DI-H2O to isopropanol (IPA) ratio. We investigated the rheological behavior of the inks, followed by ex situ and in situ characterization of the resulting catalyst layers.
2. Methods
2.1. Materials
Anion-exchange ionomers (AP3-HNN9-00-X, Lot: JMY220604) and anion-exchange membranes (AF3-HNN9-50-X, reinforced, 50 μm, Lot: A30425C01 & Lot: 2B16R01) were provided by Ionomr Innovations Inc. Ni(OH)2 powder (Merck, SKU: 283622) and Pt/C (50 wt %, Elyst Pt50 0550) were used as anode and cathode catalysts, respectively. Ethanol (EtOH, 99.5 % Ph. Ezr., extra pure), (IPA, 70 %, pure) were purchased from Carl Roth GmbH + Co. KG. Potassium hydroxide (KOH) pellets (85 %, VWR) were used to prepare 1 M KOH electrolytes. Nickel fiber felts (BEKIPOR® 2NI06-0.20), were purchased from Bekaert and Freudenberg H24C5 carbon paper with a microporous layer was purchased from FuelCellStore. Polytetrafluoroethylene (PTFE) sheets were purchased from Böhme-Kunststofftechnik GmbH & Co. KG as gaskets and spacers.Spray coated gas diffusion electrodes (GDE) were coated with the Pt/C ink using an ultrasonic spray coater (SNR 300, Sonocell) adapting a procedure published previously.1,14 The GDEs were held at 40 °C and catalyst layers were deposited slowly (0.3 ml min−1 flow rate with a nozzle speed of 140 mm s−1) and with a 5 s pause between each layer to allow the layer to dry. Spray coating was done until a loading of 0.4 mgpt cm−2 was achieved as measured by weighing a control substrate that was placed next to the GDEs.14
Anode inks for bar coating contained Ni(OH)2 dispersed in DI-water (0.9 g). After addition of the previously prepared ionomer solution (0.45 g, 5 wt % Aemion+-HNN9 in EtOH/acetone 1/1, w/w) and (0.45 g of a EtOH/acetone solvent mixture 1/1, w/w), ZrO2 grinding balls (Retsch 22.455.0009) were added. This resulted in an overall solid content of 15.36 %. The inks were then placed on a roll mixer for various time intervals (4, 24 and 48 hours) at two set rolling speeds (30 rpm and 80 rpm). The Ni(OH)2 inks were then deposited on the membranes via bar coating, producing so called half catalyst coated membranes (HCCM).
Bar coated HCCMs were prepared as previously described by Koch & Metzler et al., adapting the procedure to coating only one side of the membrane.9 A bar coater (Thierry, PG-032-320150) with nominal wet film thickness of 150 μm and a casting table (Zehntner by proceq, ZAA 2300) were used to coat the membrane at a speed of 40 mm s−1. The HCCM was subsequently left to dry in the fume hood at room temperature for at least 24 hours. Each HCCM was fabricated with a freshly made catalyst ink and three samples were cut from each HCCM to measure identical samples for the determination of error bars.
For the solvent variation study, the same ink with different water contents have been synthesized. In addition to the ethanol and acetone used in the ionomer solution, DI-H2O to IPA ratios were varied to synthesize four different inks. Starting with only DI-H2O (100 % H2O) as per the standard ink, DI-H2O![[thin space (1/6-em)]](https://www.rsc.org/images/entities/char_2009.gif) :
:![[thin space (1/6-em)]](https://www.rsc.org/images/entities/char_2009.gif) IPA 1
IPA 1![[thin space (1/6-em)]](https://www.rsc.org/images/entities/char_2009.gif) :
:![[thin space (1/6-em)]](https://www.rsc.org/images/entities/char_2009.gif) 1 (50 % H2O), DI-H2O
1 (50 % H2O), DI-H2O![[thin space (1/6-em)]](https://www.rsc.org/images/entities/char_2009.gif) :
:![[thin space (1/6-em)]](https://www.rsc.org/images/entities/char_2009.gif) IPA 3
IPA 3![[thin space (1/6-em)]](https://www.rsc.org/images/entities/char_2009.gif) :
:![[thin space (1/6-em)]](https://www.rsc.org/images/entities/char_2009.gif) 1 (75 % H2O) and only IPA (0 % H2O). The ionomer to catalyst ratio was fixed to 0.08 and the solid content to 15.36 %. All inks were mixed on the roller mixer at 80 rpm for 24 hours.
1 (75 % H2O) and only IPA (0 % H2O). The ionomer to catalyst ratio was fixed to 0.08 and the solid content to 15.36 %. All inks were mixed on the roller mixer at 80 rpm for 24 hours.
For electrochemical measurements, three cells were measured for each variation, except for the cell with 50 % DI-H2O, where one cell encountered an operational failure. The overall trend remained, however, unaffected. The prepared electrodes were assembled in a MEA sandwiched between two flow fields, connected to two electrolyte tanks and to a potentiostat (BioLogic VSP300 with two 10 A/5 V amplifiers). The electrochemical characterization protocol started with preconditioning steps followed by galvanostatic electrochemical impedance spectroscopy (GEIS) as follows: (1) 10 min step of electrolyte heating up and circulation, (2) voltage ramp up to 1.8 V then down to 0 V, (3) 1 min resting period, (4) two consecutive GEIS measurements of 0.5 and 1 A, at frequencies from 100 kHz to 100 mHz, (5) a polarization curve was measured via current density step values according to the EU harmonized measurement protocol as previously published by Koch et al.1 (6) same as step 4 but with applied currents of 2.5 and 5 A, (7) second polarization curve as step 5. Unless otherwise noted, the first polarization curve (#5) is displayed as electrochemical performance. The safety limit was set to 2.3 V for all measurements, which means that the highest achieved current density was at a voltage of 2.3 V.
For the viscosity measurements, a pre-shear step was applied at 500 s−1 shear rate for 30 s to eliminate any load history, then the sample was left to rest for 30 s. Subsequently, a viscosity sweep from 1000 to 0.001 s−1 shear rate was carried out and recorded.
For frequency sweeps, the storage and loss moduli were measured at a constant strain amplitude of 5 % across a range of angular frequencies from 1 to 600 rad s−1. Strain sweeps were conducted at a constant angular frequency of 10 rad s−1, where the storage and loss moduli were determined for varying strain amplitudes between 1 and 100 %.
3. Results and discussion
The aim of this study was to systematically investigate and improve the homogeneity and the electrochemical performance of the anode catalyst layer fabricated via direct bar coating. The study consisted of two phases as shown in Fig. 1. Firstly, the mixing parameters of the ink were varied and secondly, the primary solvent (DI-H2O) of the ink was substituted by a DI-H2O and IPA mixture. For both variations, rheological behavior of the inks was investigated, followed by morphological and finally electrochemical characterization.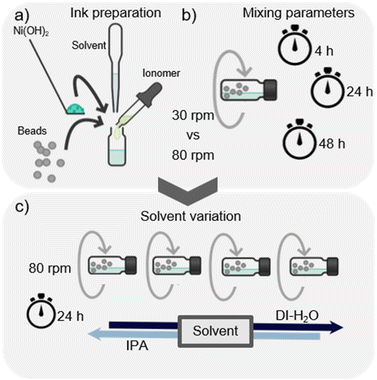 | ||
| Fig. 1 (a) Ink mixing process, (b) description of the mixing parameters variation process, and (c) description of the primary solvent variation process. Created with Chemix. | ||
3.1. Mixing parameter variation
Further decreasing the shear rate, the viscosity continues to increase even at very low shear rates which is known as yield stress. This suggests that the inks form a 3D percolated network in contrast to isolated agglomerates as mentioned by Khandavalli et al. for carbon-based inks.15
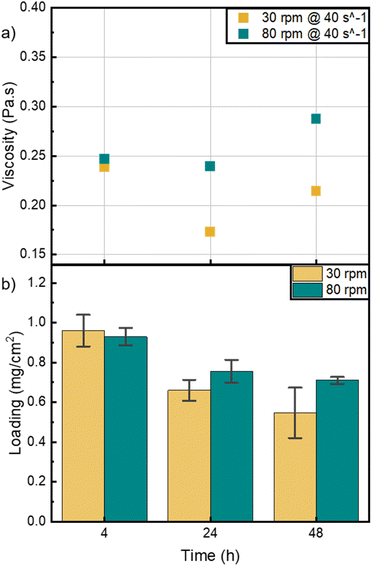
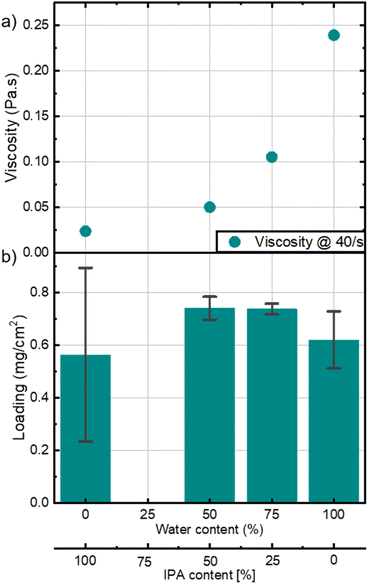
The bar coating window, as mentioned by Dan et al., specifies that viscosity values at shear rates between 10 and 100 s−1, should vary between 0.01 and 1 Pa s for optimum coating properties.10 Fig. 2a shows the relative viscosities of the different inks at a shear rate of 40 s−1, where the inks showed no striking difference. This indicates that all inks have similar rheological characteristic in the shear rate regime relevant to the bar coating technique. However, the abovementioned viscosity behavior of the different inks at lower shear rates acts as a pre-indicator to the catalyst layer morphology.
The effects of mixing speed and mixing time can also be seen in the images of the HCCMs taken by SEM and by a microscope with 5× magnification, (Fig. S5 and S6†). Overall, the visible agglomerates are becoming smaller with longer mixing time, and the pores are getting smaller in size and fewer in number (Fig. S5a–c†). In Fig. S5d–f,† the inks mixed at 80 rpm show a significant improvement in the catalyst-pore distribution from 4 to 24 hours and less prominent from 24 to 48 hours. Furthermore, inks mixed at 30 rpm exhibited improved morphological homogeneity after 24 hours compared to those mixed for just 4 hours. However, even after 48 hours, the 30 rpm inks did not achieve the level of morphological homogeneity observed in inks mixed at 80 rpm for 24 and 48 hours.
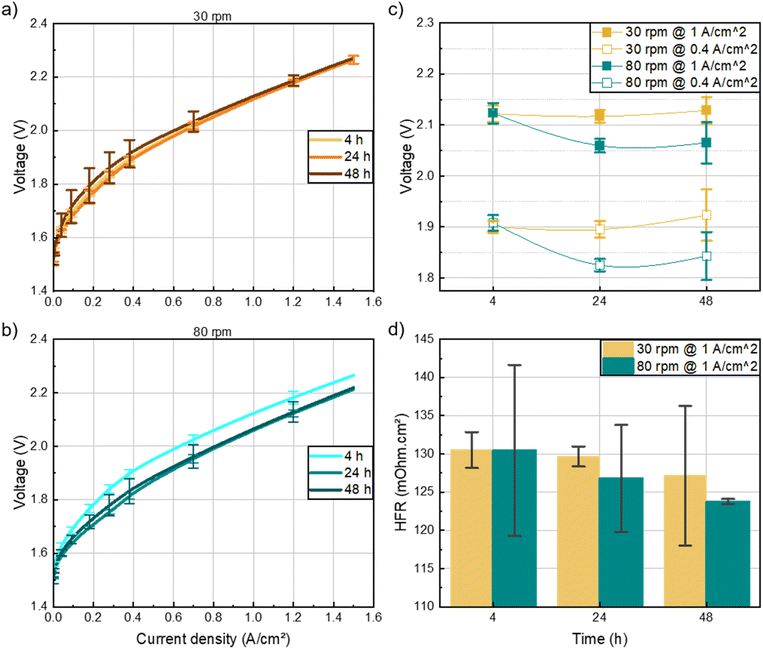
At high current densities, the performance of cells for the varied mixing time converged, suggesting that the effect of mixing time at 30 rpm is negligible on the cell performance at relevant operational current densities (i.e. ≥1 A cm−2). On the other hand, Fig. 3b shows that for the 80 rpm inks, the smooth morphology of the catalyst layer obtained after 24 hours of mixing appeared to have a significant impact on the electrochemical performance of the cells. Specifically, the 24 hours ink demonstrated a 70 mV reduction in overpotential at 1 A cm−2 compared to the 4 hours ink (Fig. 3c). Notably, the performance plateaued between 24 and 48 hours, indicating that 24 hours of mixing is sufficient to achieve optimal results. The improvement in the electrochemical performance for the 24 and 48 hours, 80 rpm-cells can also be attributed to the high frequency resistance (Fig. 3d). The lower cell overpotential and HFR could be due to the better interconnectivity of the catalyst-ionomer agglomerates within the layer as depicted in the SEM images (Fig. S5†). As the HFR of the cells was the same at 0.4 A cm−2 and 1 A cm−2, only the HFR at 1 A cm−2 is shown. Based on these findings, all subsequent inks were mixed at 80 rpm for 24 hours to achieve optimal performance while minimizing fabrication time.
3.2. Water content variation in the ink
The homogeneity and coatability of a catalyst layer fabricated via bar coating is highly dependent on the ink's viscosity.10 A homogeneous layer is crucial for consistent performance across large batches and active areas of CCMs.16,17 To explore how ink rheology impacts bar-coated HCCMs, we altered the solvent composition by adjusting the ratio of deionized water (DI-H2O) to isopropanol (IPA) in the primary solvent, which was initially just DI-H2O in the first phase of the study. The secondary solvents which are ethanol and acetone from the ionomer solution, remained unchanged. All inks were mixed at 80 rpm for 24 hours as concluded from the section above.The impact of the water content is also demonstrated in Fig. S3,† where the y-intercept of the shear stress curves is higher for inks with more water content. This intercept is known as the yield stress, which is high when the ink behaves less like a fluid at rest and a certain force has to be applied before the ink starts to flow.20 This parameter is essential for the bar coating process, to prevent the ink from spreading outside the coating area during bar coating.
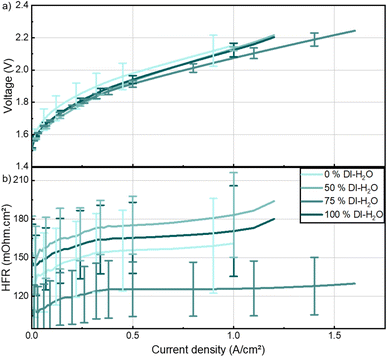
Fig. S4a–c† assesses the viscoelastic behavior of the inks with different water contents. Inks containing water exhibit a viscoelastic solid behavior as storage modulus (G′) is bigger than loss modulus (G′′) and both are independent of strain at low strain values.19 The magnitude of the storage modulus also depicts the strength of the ink which is in this case proportional to the water content in the ink. The ink with no water content is shown to be a viscoelastic liquid, and is entirely dependent on strain, depicting the absence of a gel like inner network.21 Inks with 0 % water, and therefore the lowest viscosity, resulted in highly inhomogeneous layers (Fig. 4b and S7†). The error bars depict the standard deviation of the three measured cells cut from a fabricated HCCM. A mixture between water and IPA is beneficial to improve homogeneity, especially with more water than IPA. This ratio allowed to coat an area of 48 cm2 with very homogeneous loading (Fig. S8†). These findings highlight the importance of optimizing ink viscosity through careful solvent selection, particularly for scale-up of the CCM fabrication.
4. Conclusion
In this study, we investigated how the composition of anode inks and mixing parameters influence catalyst layer morphology and electrochemical performance in AEM water electrolysis. Through our examination of ink rheology, catalyst loading, and layer homogeneity, we found that a mixing speed of 80 rpm, combined with a mixing time of at least 24 hours, was required to achieve optimal homogeneity and electrochemical performance. Our findings emphasized that high mixing rates are essential to break up agglomerates in the catalyst inks, as increasing the mixing time alone will not suffice if the mixing rate is too low. At higher mixing rates, such as 80 rpm, the mixing time can be reduced to 24 hours or potentially further, but this needs to be individually determined for each catalyst ink.22,23Additionally, our results highlighted the critical role of solvent composition, with a 75 % water content using a 3![[thin space (1/6-em)]](https://www.rsc.org/images/entities/char_2009.gif) :
:![[thin space (1/6-em)]](https://www.rsc.org/images/entities/char_2009.gif) 1 DI-H2O to IPA ratio proving optimal for both homogeneity and cell performance. This underscores the importance of identifying the ideal combination of IPA and DI-H2O in the catalyst ink to ensure consistent results. Overall, the study highlights the necessity of thoroughly optimizing both catalyst ink composition and mixing parameters to achieve homogeneous catalyst layers and reproducible electrochemical performance. This is particularly important as we advance toward scalable fabrication of catalyst-coated membranes with large active areas, where the increased viscosity of direct bar-coating inks demands different considerations compared to those typically used for spray-coating at the lab scale. The optimized conditions may be specific to the experimental setup, particularly for nickel hydroxide-based inks and the bar coating technique in this study. Further studies are necessary to determine the universality of these findings across different materials and fabrication methods.
1 DI-H2O to IPA ratio proving optimal for both homogeneity and cell performance. This underscores the importance of identifying the ideal combination of IPA and DI-H2O in the catalyst ink to ensure consistent results. Overall, the study highlights the necessity of thoroughly optimizing both catalyst ink composition and mixing parameters to achieve homogeneous catalyst layers and reproducible electrochemical performance. This is particularly important as we advance toward scalable fabrication of catalyst-coated membranes with large active areas, where the increased viscosity of direct bar-coating inks demands different considerations compared to those typically used for spray-coating at the lab scale. The optimized conditions may be specific to the experimental setup, particularly for nickel hydroxide-based inks and the bar coating technique in this study. Further studies are necessary to determine the universality of these findings across different materials and fabrication methods.
Data availability
Data for this article, including raw data of electrochemical measurements is available at https://freidata.uni-freiburg.de/records/dyytp-zjv65 with DOI: 10.60493/dyytp-zjv65.Author contributions
Mohamed Elshamy: investigation, methodology, validation, experimental work, writing – original draft. Lukas Metzler: investigation, methodology, validation, writing – review & editing. Joey Disch: project administration, supervision, writing – review & editing. Severin Vierrath: conceptualization, writing – review & editing. Susanne Koch: conceptualization, investigation, methodology, validation, writing – review & editing.Conflicts of interest
The authors declare no competing financial interest.Acknowledgements
The authors gratefully acknowledge financial support by the Federal Ministry of Education and Research of Germany in the projects AEMready (Grant No. 03SF0613A) and H2Meer (Grant No. 03SF0611E). The authors also acknowledge the contribution of the student Emine Cimen, who assisted with fabrication and characterization. During the preparation of this work the authors used chat GPT-4 to correct spelling, grammar and to rephrase some paragraphs for readability. After using this tool/service, the authors reviewed and edited the content as needed and take full responsibility for the content of the published article.References
- S. Koch, P. A. Heizmann, S. K. Kilian, B. Britton, S. Holdcroft, M. Breitwieser and S. Vierrath, The Effect of Ionomer Content in Catalyst Layers in Anion-Exchange Membrane Water Electrolyzers Prepared with Reinforced Membranes (Aemion+™), J. Mater. Chem. A, 2021, 9(28), 15744–15754, 10.1039/D1TA01861B.
- E. K. Volk, M. E. Kreider, S. Kwon and S. M. Alia, Recent Progress in Understanding the Catalyst Layer in Anion Exchange Membrane Electrolyzers – Durability, Utilization, and Integration, EES Catal., 2024, 2(1), 109–137, 10.1039/D3EY00193H.
- M. Klingenhof, H. Trzesniowski, L. Metzler, S. Koch, F. Dionigi, S. Vierrath and P. Strasser, Nife LDH: From Molecular Understanding to Highly Active Single Cell Measurements, ECS Meet. Abstr., 2023, MA2023-01(36), 2064, DOI:10.1149/MA2023-01362064mtgabs.
- R. Weber, M. Klingenhof, S. Koch, L. Metzler, T. Merzdorf, J. Meier-Haack, P. Strasser, S. Vierrath and M. Sommer, Meta -Kinks Are Key to Binder Performance of Poly(Arylene Piperidinium) Ionomers for Alkaline Membrane Water Electrolysis Using Non-Noble Metal Catalysts, J. Mater. Chem. A, 2024, 12(13), 7826–7836, 10.1039/D3TA06916H.
- H. Koshikawa, H. Murase, T. Hayashi, K. Nakajima, H. Mashiko, S. Shiraishi and Y. Tsuji, Single Nanometer-Sized NiFe-Layered Double Hydroxides as Anode Catalyst in Anion Exchange Membrane Water Electrolysis Cell with Energy Conversion Efficiency of 74.7% at 1.0 A cm−2, ACS Catal., 2020, 10(3), 1886–1893, DOI:10.1021/acscatal.9b04505.
- H. A. Miller, K. Bouzek, J. Hnat, S. Loos, C. I. Bernäcker, T. Weißgärber, L. Röntzsch and J. Meier-Haack, Green Hydrogen from Anion Exchange Membrane Water Electrolysis: A Review of Recent Developments in Critical Materials and Operating Conditions, Sustain. Energy Fuels, 2020, 4(5), 2114–2133, 10.1039/C9SE01240K.
- G. Liu, D. McLaughlin, S. Thiele and C. Van Pham, Correlating Catalyst Ink Design and Catalyst Layer Fabrication with Electrochemical CO2 Reduction Performance, Chem. Eng. J., 2023, 460, 141757, DOI:10.1016/j.cej.2023.141757.
- C. M. Baez-Cotto, J. P. Pfeilsticker, A. O. Godoy, M. Batool, S. Zaccarine, M. Wang, O. Bird, S. Pylypenko, J. Jankovic, M. Ulsh and S. Mauger, The Effect of Ink Ball Milling Time on Interparticle Interactions and Ink Microstructure and Their Influence on Crack Formation in Rod-Coated Catalyst Layers, J. Power Sources, 2023, 583, 233567, DOI:10.1016/j.jpowsour.2023.233567.
- S. Koch, L. Metzler, S. K. Kilian, P. A. Heizmann, F. Lombeck, M. Breitwieser and S. Vierrath, Toward Scalable Production: Catalyst-Coated Membranes (CCMs) for Anion-Exchange Membrane Water Electrolysis via Direct Bar Coating, Adv. Sustain. Syst., 2023, 7(2), 2200332, DOI:10.1002/adsu.202200332.
- B. Dan, G. C. Irvin and M. Pasquali, Continuous and Scalable Fabrication of Transparent Conducting Carbon Nanotube Films, ACS Nano, 2009, 3(4), 835–843, DOI:10.1021/nn8008307.
- Y. Meng, X.-B. Xu, H. Li, Y. Wang, E.-X. Ding, Z.-C. Zhang and H.-Z. Geng, Optimisation of Carbon Nanotube Ink for Large-Area Transparent Conducting Films Fabricated by Controllable Rod-Coating Method, Carbon, 2014, 70, 103–110, DOI:10.1016/j.carbon.2013.12.078.
- S. Holdcroft, Fuel Cell Catalyst Layers: A Polymer Science Perspective, Chem. Mater., 2014, 26(1), 381–393, DOI:10.1021/cm401445h.
- S. Khandavalli, J. H. Park, N. N. Kariuki, D. J. Myers, J. J. Stickel, K. Hurst, K. C. Neyerlin, M. Ulsh and S. A. Mauger, Rheological Investigation on the Microstructure of Fuel Cell Catalyst Inks, ACS Appl. Mater. Interfaces, 2018, 10(50), 43610–43622, DOI:10.1021/acsami.8b15039.
- C. Klose, T. Saatkamp, A. Münchinger, L. Bohn, G. Titvinidze, M. Breitwieser, K. Kreuer and S. Vierrath, All-Hydrocarbon MEA for PEM Water Electrolysis Combining Low Hydrogen Crossover and High Efficiency, Adv. Energy Mater., 2020, 10(14), 1903995, DOI:10.1002/aenm.201903995.
- S. Khandavalli, J. H. Park, N. N. Kariuki, D. J. Myers, J. J. Stickel, K. Hurst, K. C. Neyerlin, M. Ulsh and S. A. Mauger, Rheological Investigation on the Microstructure of Fuel Cell Catalyst Inks, ACS Appl. Mater. Interfaces, 2018, 10(50), 43610–43622, DOI:10.1021/acsami.8b15039.
- P. Liu, D. Yang, B. Li, C. Zhang and P. Ming, Recent Progress of Catalyst Ink for Roll-to-Roll Manufacturing Paired with Slot Die Coating for Proton Exchange Membrane Fuel Cells, Int. J. Hydrog. Energy, 2023, 48(51), 19666–19685, DOI:10.1016/j.ijhydene.2023.02.022.
- T. Carine and N.-C. Christine, Improvement of Active Layers Homogeneity for the MEA's (Membrane Electrode Assembly) of PEMFC (Proton Exchange Membrane Fuel Cell): Impact of the Ink Quality Formulation, Nanomater. Sci. Eng., 2020, 135–143, DOI:10.34624/NMSE.V2I3.19554.
- T. T. Ngo, T. L. Yu and H.-L. Lin, Influence of the Composition of Isopropyl Alcohol/Water Mixture Solvents in Catalyst Ink Solutions on Proton Exchange Membrane Fuel Cell Performance, J. Power Sources, 2013, 225, 293–303, DOI:10.1016/j.jpowsour.2012.10.055.
- Y. Guo, D. Yang, B. Li, D. Yang, P. Ming and C. Zhang, Effect of Dispersion Solvents and Ionomers on the Rheology of Catalyst Inks and Catalyst Layer Structure for Proton Exchange Membrane Fuel Cells, ACS Appl. Mater. Interfaces, 2021, 13(23), 27119–27128, DOI:10.1021/acsami.1c07070.
- P. Liu, B. Li, D. Yang, C. Zhang and P. Ming, New Insights on the Agglomeration and Sedimentation Behaviours of Catalyst Ink of Proton Exchange Membrane Fuel Cells Affected by Ionomers Concentration, J. Power Sources, 2023, 556, 232427, DOI:10.1016/j.jpowsour.2022.232427.
- Amplitude sweeps|Anton Paar Wiki. Anton Paar, https://wiki.anton-paar.com/en/amplitude-sweeps/ (accessed 2024-04-18).
- M. Wang, J. H. Park, S. Kabir, K. C. Neyerlin, N. N. Kariuki, H. Lv, V. R. Stamenkovic, D. J. Myers, M. Ulsh and S. A. Mauger, Impact of Catalyst Ink Dispersing Methodology on Fuel Cell Performance Using In-Situ X-Ray Scattering, ACS Appl. Energy Mater., 2019, 2(9), 6417–6427, DOI:10.1021/acsaem.9b01037.
- S. Du, W. Li, H. Wu, P.-Y. Abel Chuang, M. Pan and P.-C. Sui, Effects of Ionomer and Dispersion Methods on Rheological Behavior of Proton Exchange Membrane Fuel Cell Catalyst Layer Ink, Int. J. Hydrog. Energy, 2020, 45(53), 29430–29441, DOI:10.1016/j.ijhydene.2020.07.241.
Footnote |
| † Electronic supplementary information (ESI) available. See DOI: https://doi.org/10.1039/d4ra03969f |
| This journal is © The Royal Society of Chemistry 2024 |

