 Open Access Article
Eco-conscious upcycling of sugarcane bagasse into flexible polyurethane foam for mechanical & acoustic relevance
Esraa A. El-Metwaly a,
Hadeel E. Mohameda,
Tarek M. El-Basheer
 b,
Manal T. H. Moselhyc,
Sonia Zulfiqar
 *def,
Eric W. Cochran
 *e and
Ahmed Abdelhamid Maamoun*g
aDepartment of Mechanical Engineering, Materials Engineering Program, Faculty of Engineering, Ain Shams University, Cairo 11517, Egypt
bDepartment of Acoustics, Mass and Force Metrology Division, National Institute of Standards (NIS), El-Sadat Street, El-Haram, El-Giza, 12211, Egypt
cAl-Safwa High Institute of Engineering, Cairo, 12613, Egypt
dDepartment of Physical Sciences, Lander University, 320 Stanley Ave, Greenwood, South Carolina 29649, USA. E-mail: szulfiqar@lander.edu
eDepartment of Chemical and Biological Engineering, Iowa State University, Sweeney Hall, 618 Bissell Road, Ames, Iowa 50011, USA. E-mail: ecochran@iastate.edu; zulfiqar@iastate.edu
fDepartment of Chemistry, Faculty of Science, University of Ostrava, 30. Dubna 22, Ostrava 701 03, Czech Republic. E-mail: sonia.zulfiqar@osu.cz
gDepartment of Engineering Physics and Mathematics, Chemistry Division, Faculty of Engineering, Ain Shams University, Cairo 11517, Egypt. E-mail: ahmed.maamoun@eng.asu.edu.eg
First published on 29th July 2024
Abstract
This study explores the use of sugarcane bagasse (SCB), a byproduct of sugarcane processing, as a bio-filler in the production of flexible polyurethane foam (FPU), focusing on its benefits for both the environment and the economy. By varying the inclusion of SCB waste from 1 to 6 wt%, the research aims to enhance the FPU's mechanical and acoustic characteristics. Techniques such as Fourier transform infrared (FTIR) spectroscopy and field emission scanning electron microscopy (FESEM) were utilized to analyze the chemical structure and surface characteristics of both SCB and the FPU/SCB composites. Additionally, tests on gel fraction, density, and mechanical properties were conducted. The results indicate that adding 4 wt% SCB to FPU considerably improved the foam's properties. This modification resulted in a 148.63% increase in apparent density, a 228.47% rise in compressive strength, and a 116.24% boost in tensile strength. Furthermore, sound absorption across various frequency ranges was enhanced compared to the control foam. Additionally, the findings show that SCB effectively shifts sound absorption characteristics to lower frequencies. Specifically, at a low frequency of 500 Hz, the sound absorption coefficient increased to 0.4 with a foam thickness of 20 mm. This demonstrates that SCB can significantly improve FPU's performance, making it an attractive option for applications requiring noise mitigation, such as in the automotive and construction industries, thereby offering a sustainable solution to waste management and materials innovation.
1. Introduction
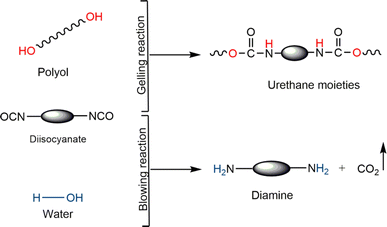
With the advancement of technology, noise has become a significant issue in many countries, hindering individuals from achieving a fulfilling quality of life. Reducing or eliminating noise that negatively impacts human health, both physically and mentally, is a key objective.1 One effective method to achieve this is through the use of sound absorption materials, such as glass wool, mineral fibers, and foams. Traditionally, synthetic fibers like glass wool and mineral fibers have been employed for this purpose. However, growing concerns regarding the potential health impact of these fibers and their negative environmental effects, particularly their long or indefinite decomposition time, have limited their usage. As a result, there has been a noticeable shift towards the development of safer alternative sound absorption materials that provide benefits for both human health and the environment.2,3The utilization of flexible polyurethane foam (FPU) has gained significant recognition as a highly favorable material for mitigating noise pollution. This can be attributed to its distinctive interconnected pore structure, which facilitates the dispersion of sound waves and enhances sound absorption efficiency.4 Polyurethanes, with an annual global consumption of roughly 20 million metric tons, stand among the foremost commercially significant speciality polymers.5 FPU is a synthetic polymer that encompasses (NHCOO) moieties. The chemistry of FPU involves two main reactions: the gelling reaction, which occurs between the polyol and isocyanate, and the blowing reaction, which involves the reaction of isocyanate with water. The cellular structure of FPU can be effectively controlled by balancing these reactions.3,6 The remarkable feature of FPU foams is their unparalleled sound absorption qualities, rendering them indispensable in various construction settings, such as theatres, cinemas, offices, and sound studios. Additionally, FPU finds applications in the transportation sector for sound dampening, comfort, and support.7
The sound absorption mechanism in FPUs is facilitated by their three-dimensional porous structure, allowing sound waves to penetrate and be dissipated through tension and torsion within the cell walls.8–10 Despite their effectiveness, there's a limit to the sound absorption capacity of FPU foams, indicating the necessity for modification to enhance their performance. A conventional method to boost FPU foams involves incorporating fillers during production.11 Recent strategies have shifted towards using organic waste fibers as sustainable fillers, highlighting the growing emphasis on recycling, and integrating waste materials into production processes as a sustainable waste management approach. This is particularly critical in developing countries where waste management remains a challenge, with Egypt, for instance, generating over 16.8 million tons of sugarcane residue annually.12 The exploration into improving FPU's pore structure, mechanical and acoustic properties has led to studies employing various natural organic and inorganic fillers including rich husk,13 cellulose,14 coconut husk,15 feather fiber,16 seashell,17 chitosan,11 walnut shells,18 wood19 and eggshell20 as filler for FPU.
The use of natural fibers is increasingly popular due to benefits like affordability, eco-friendliness, lightness, satisfactory strength, effective thermal and sound insulation, ease of manufacturing, low production energy needs, and biodegradability.21,22 Olcay et al.23 explored how adding treated and untreated artichoke stem waste fibers to FPU at different ratios (5%, 10%, 15%, and 20%) affected its properties. They discovered that composites with 5% treated artichoke fibers had better tensile strength than pure PU, and such composites were also ranked second in elongation, following PU foam. The study highlighted that alkali treatment, and using a 5% fiber reinforcement, improved the material's elastic modulus. Tensile strength and elongation of the artichoke fiber composites were enhanced by up to 102% and 99%, respectively, with alkali treatment. Notably, the best mechanical properties were observed in composites reinforced with treated 5% and 10% as well as untreated 5% artichoke stem waste fibers. These treated 5% fiber composites also showed outstanding sound absorption.
In a separate study, Chris-Okafor et al.24 analyzed how coconut husk and corn cob fillers affected FPUF characteristics by varying filler percentages (5%, 10%, 15%, 20%, and 25%). They noted that density and compression resistance improved with more filler, while elongation at break and tensile strength dropped due to poor interaction with the polyurethane and void formation in the material. Further research with a mixture of rice husk and corn cob fillers confirmed these outcomes. Additionally, Chen and Jiang's25 work on adding bamboo leaf particles to polyurethane foam showed that a composite foam containing 6% bamboo fiber had the maximum noise reduction and sound absorption coefficients at 6.3 kHz, while an 8% inclusion of bamboo chips with particle sizes between 2–3 mm provided the most effective sound insulation. These studies collectively highlight the potential of enhancing PU foam's properties through the integration of natural fibers, emphasizing the need for careful selection of fiber type and concentration to maximize benefits without compromising other qualities.
This manuscript presents a study focusing on the integration of Sugarcane Bagasse (SCB) waste as reinforcement in FPU for the first time, aiming to enhance mechanical performance and sound absorption capabilities. SCB, an abundant agricultural waste product, was incorporated at varying ratios (1–6 wt%) to investigate its impact on the chemical composition and morphology of the composites determined through FTIR and FESEM analyses. Adding SCB as a filler in FPU foam in the industry offers a sustainable solution that enhances the foam's properties while reducing environmental impacts. By incorporating SCB, a byproduct of sugarcane processing, into FPU foam production, the industry can achieve improved mechanical properties and cost-effectiveness. This utilization not only enhances the foam's characteristics but also contributes to reducing waste and promoting the use of renewable resources. The study also examined the composites' compressive and tensile strength, alongside their sound absorption properties.
2. Experimental section
2.1. Materials
The Konix KE1990, a styrene-acrylonitrile copolymer-based polymeric polyol containing solid content of 10 wt%, supplied by KPX Chemicals, Korea was utilized in the production of polyurethane flexible foam. This material has a hydroxyl number of 41 mg KOH per g, an average molecular weight of 4100 g mol−1, and a viscosity of 950 mPa s at ambient temperature. Lupranate T80, from BASF Polyurethanes, Germany, consists of a blend of 20% 2,6- and 80% 2,4-toluene diisocyanate (TDI). The amine catalyst, Dabco 33-LV, contains 33% diethylenediamine and 67% dipropylene glycol, procured from Air Products, UK, as does the stannous catalyst, Dabco T-9. Evonik, Germany supplied the silicon surfactant Dabco DC5933. The solvent dimethylformamide (DMF) was obtained from EL Gomhorya Chemical Co. Raw sugarcane bagasse was obtained from the local market in Cairo, Egypt. Crushed sugarcane stalks were collected after the extraction of the juice. All chemicals were used as received, without further purification.2.2. Preparation of SCB bio-filler
Initially, the SCB underwent a washing process with water and was allowed to rest for 24 h to guarantee its cleanliness. Subsequently, it was chopped into smaller pieces, given another wash, and exposed to sunlight to dry for another 24 h. To ensure complete drying, the material was placed in an oven at 100 °C for 24 h to eliminate any leftover moisture. The final step involved grinding the dried pieces and sieving them into a smooth powder with a 425 μm mesh size. The preparation steps of SCB bio-filler are summarized in Fig. 1a.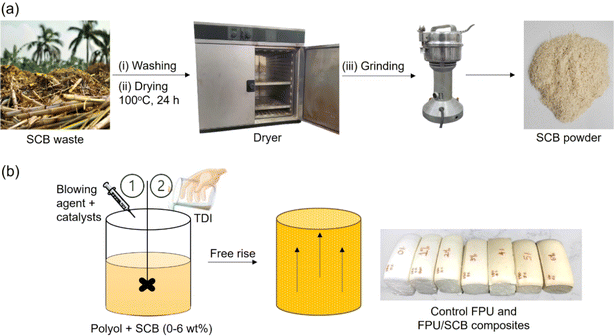 | ||
| Fig. 1 Representative scheme for (a) SCB filler preparation and (b) fabrication of FPU/SCB composites. | ||
2.3. Fabrication of FPU/SCB composites
Flexible polyurethane foam was produced through a one-shot polymerization technique and a cup foaming method. The representative scheme for the preparation of FPU/SCB composites is illustrated in Fig. 1b. Table 1 provides the specific formulations for both the control sample and the composite materials. The process began with a mechanical blending of polyol, surfactant, catalysts, and a water-blowing agent for 1 minute at a speed of 2000 rpm. Following this, different amounts of SCB (ranging from 1–6 wt%) were incorporated into the polyol mixture and stirred at a speed of 3000 rpm until a uniform mixture was obtained. Then, pre-weighed TDI, was added to the mixture and stirred for 4 seconds at 3000 rpm, after which it was immediately poured into a mold measuring 200 × 200 × 200 mm3. The mixture was left for 24 h at ambient conditions to complete the reaction inside the mold and to harden sufficiently for demolding. The control sample followed the same procedure but without the addition of SCB filler. The resulting composites were designated as FPU/SCB1, FPU/SCB2, FPU/SCB3, FPU/SCB4, FPU/SCB5, and FPU/SCB6. The reaction scheme for FPU preparation is demonstrated in Fig. 2. The isocyanate index (NCO/OH equivalents) was adjusted at 1.05 in all formulations. The amount of TDI was calculated using the following equation:
 | (1) |
2.4. Characterization and testing
The investigation of the chemical structure for the SCB bio filler and the resulting FPU/SCB composites was conducted using a Thermo Scientific Nicolet FTIR spectrometer. The analysis was performed in transmission mode, spanning a spectral range of 500–4000 cm−1, utilizing the ATR technique with a resolution of 4 cm−1. To examine the surface features of both SCB and the fabricated FPU/SCB composites, a field emission scanning electron microscope (FESEM, FEI Quanta FEG 250, USA) was employed, capturing images at a constant voltage of 20 kV. The pore size of the fabricated composite materials was determined using the ImageJ software. For gel fraction analysis, the composites were sectioned into tiny pieces and measured in their dry state (Wo). These pieces were then immersed in a dimethylformamide (DMF) solution for 72 hours until equilibrium was reached. Afterward, the swollen specimens were firstly dried in an oven set at 70 °C for 24 h. Following this initial drying phase, the specimens were weighed again (W1) using a precise 4-digit scale to ensure higher accuracy. The calculation of the gel content followed, as outlined in eqn (1):
 | (2) |
The apparent density of the samples was measured following the ASTM D-3574 test A guidelines and calculated as the ratio between the mass and the volume of regular cubic-shaped samples (50 × 50 × 40 mm3). The final density value for each formulation was obtained by averaging the results from three samples. The compressive and tensile strengths, along with the percentage of elongation at break, for both the control FPU sample and FPU/SCB composites were measured using a ZwickRoell/Z100 universal testing machine from Germany equipped with a 1 kN load cell, adhering to ASTM D-3574 tests C and E respectively. For the compressive strength test, samples measuring 50 × 50 × 40 mm3 were compressed to half their thickness at a crosshead speed of 50 mm min−1, and the average compressive strength was calculated from the data collected. In the tensile strength test, samples prepared along the foam's rise direction were stretched at a constant speed of 500 mm min−1 until they broke, using a gauge length of 35 mm for all tests. The sound absorption coefficient of the composites was measured using an impedance tube, following the ASTM E1050 standards. Samples, 20 mm in thickness, were prepared using cylindrical steel dies to achieve diameters of 30 mm for high-frequency tests ranging from 2000–6300 Hz, and 100 mm for low-frequency assessments between 200–1600 Hz, respectively.
3. Results and discussion
3.1. FTIR spectroscopy
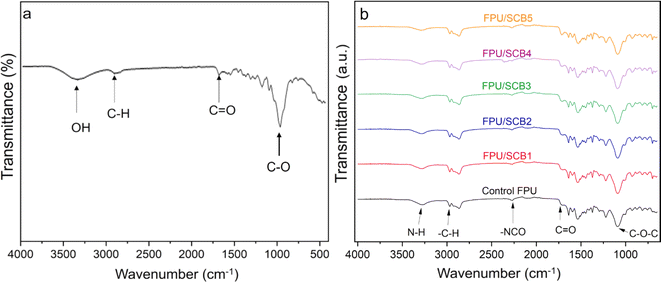
FTIR analysis was utilized to examine the chemical composition of SCB, the control FPU, and the FPU/SCB composites. SCB is a complex lignocellulosic material composed primarily of cellulose, hemicellulose, and lignin. While FTIR spectroscopy is a useful technique for analyzing the functional groups and chemical structure of bagasse, it has limitations in fully elucidating the intricate structure of this biomass. Fig. 3a illustrates the presence of hydroxyl groups (O–H) in cellulose, hemicellulose, and lignin, as evidenced by the band at 3337 cm−1. The stretching vibrations at 2919 cm−1 correspond to both asymmetric and symmetric –CH2 groups.26 Additionally, the signals of the carbonyl group (C![[double bond, length as m-dash]](https://www.rsc.org/images/entities/char_e001.gif) O) and the alkene group (C
O) and the alkene group (C![[double bond, length as m-dash]](https://www.rsc.org/images/entities/char_e001.gif) C) were identified at 1728 cm−1 and 1603 cm−1, respectively. The band at 1426 cm−1 signifies the symmetric deformation of CH2 groups in cellulose, while the signal at 1240 cm−1 indicates the C–O–C stretching of the acetyl group in hemicellulose. The C–O stretching in lignin, cellulose, and hemicelluloses was confirmed by the appearance of a band at 1025 cm−1.27,28
C) were identified at 1728 cm−1 and 1603 cm−1, respectively. The band at 1426 cm−1 signifies the symmetric deformation of CH2 groups in cellulose, while the signal at 1240 cm−1 indicates the C–O–C stretching of the acetyl group in hemicellulose. The C–O stretching in lignin, cellulose, and hemicelluloses was confirmed by the appearance of a band at 1025 cm−1.27,28
Fig. 3b displays the FTIR spectrum for the control FPU sample along with the FPU/SCB composites. The presence of stretching vibrations of (N–H) groups of urethanes at 3276 cm−1 confirms the successful formation of urethane bonds.29 The stretching vibrations of (C–H) bonds within CH2 groups were observed at 2967 cm−1 and 2866 cm−1.30 These bands are characteristic of the aliphatic segments present in the FPU matrix and provide further evidence of the successful synthesis of the polymer. Furthermore, the FTIR spectrum also reveals the presence of unreacted NCO groups at 2273 cm−1 and the C–O–C stretching in soft segments at 1088 cm−1.13 The carbonyl groups (C![[double bond, length as m-dash]](https://www.rsc.org/images/entities/char_e001.gif) O) in urethane, the monodentate hydrogen-bonded C
O) in urethane, the monodentate hydrogen-bonded C![[double bond, length as m-dash]](https://www.rsc.org/images/entities/char_e001.gif) O in urea groups, and the bidentate hydrogen-bonded C
O in urea groups, and the bidentate hydrogen-bonded C![[double bond, length as m-dash]](https://www.rsc.org/images/entities/char_e001.gif) O in urea groups are associated with the distinctive bands at 1720 cm−1, 1640 cm−1, and 1595 cm−1, respectively.31–33 Hence, these findings substantiate the contribution of SCB filler to physical interactions with the FPU matrix.
O in urea groups are associated with the distinctive bands at 1720 cm−1, 1640 cm−1, and 1595 cm−1, respectively.31–33 Hence, these findings substantiate the contribution of SCB filler to physical interactions with the FPU matrix.
3.2. Field emission scanning electron microscopy (FESEM)
Fig. 4a and b illustrate the FESEM images of SCB, showcasing a mix of compact and fibrous textures within the SCB filler. This highlights the intricate characteristics of the SCB biomass. The compact areas signify dense regions, possibly indicating higher lignin content.34Fig. 5a–g displays FESEM images that compare the control FPU with FPU/SCB composites, highlighting the crucial role of morphology and pore architecture in the foam's sound absorption capabilities. Each sample demonstrates three distinct pore categories: closed, partially open, and fully open. The formation of these cavities and pores can be elucidated as follows: the reaction between isocyanate and water initially produces transient carbamic acid, which then decomposes into CO2 gas and amine, causing cavities to expand. If the gelation rate is slow, the narrow cavity walls fail to withstand pressure from both directions, leading to pore creation. When the cavity walls thicken, solidification is delayed, and partially open pores predominate. On the other hand, a quick gelation rate ensures strong cell walls that prevent gas inside the cell from rupturing the bubble wall, ensuring the gelation reaction completes before the cavity wall ruptures, resulting in closed pores.4,35 The presence of these diverse pore types enhances the composites' ability to efficiently absorb sound waves.
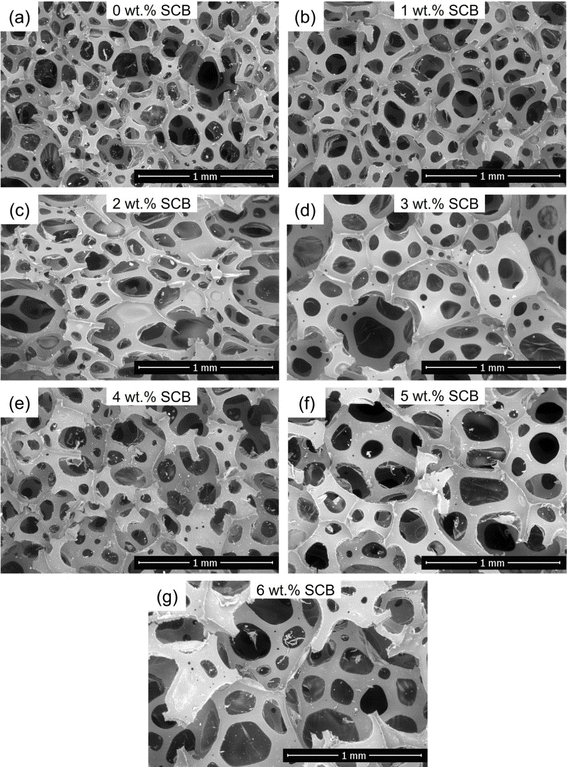 | ||
| Fig. 5 FESEM micrographs of (a) control FPU sample, (b) FPU/SCB1, (c) FPU/SCB2, (d) FPU/SCB3, (e) FPU/SCB4, (f) FPU/SCB5, and (g) FPU/SCB6. (FPU: flexible polyurethane; SCB: sugarcane bagasse). | ||
Table 2 displays the pore size of both the control FPU and FPU/SCB composites. The findings indicate that the inclusion of SCB filler resulted in a reduction in the pore size of the FPU foam, reaching a minimum of 0.145 mm for FPU/SCB4. This decrease can be attributed to the SCB filler serving as nucleation sites that facilitate cell formation, resulting in the creation of smaller cells and, consequently, smaller pores. However, when the SCB content exceeded 4 wt%, there was a reversal in this trend, and the pore size began to increase. This increase is a consequence of the high concentration of filler causing agglomeration, which disrupts the foam cell structure and leads to the formation of larger pores.
| Sample | Pore size (mm) | Density (kg m−3) | Gel fraction (%) |
|---|---|---|---|
| Control FPU | 0.242 ± 0.125 | 32.9 ± 0.61 | 92.144 |
| FPU/SCB1 | 0.195 ± 0.116 | 44.2 ± 0.48 | 92.638 |
| FPU/SCB2 | 0.211 ± 0.118 | 36.8 ± 1.17 | 93.121 |
| FPU/SCB3 | 0.181 ± 0.094 | 44.9 ± 0.59 | 93.847 |
| FPU/SCB4 | 0.145 ± 0.066 | 48.9 ± 0.38 | 94.516 |
| FPU/SCB5 | 0.286 ± 0.149 | 45.6 ± 0.44 | 93.363 |
| FPU/SCB6 | 0.327 ± 0.203 | 42.1 ± 1.26 | 92.037 |
3.3. Apparent density
The density of the FPU is a crucial factor in assessing its durability.36 Table 2 displays the densities for both the control FPU and the FPU/SCB composites. The findings indicate that the composites exhibit greater densities than the control FPU, with the highest density observed at a 4 wt% addition of SCB. This increase in density may result from the addition of SCB, which leads to a higher viscosity in the polyol system and results in a dense and compact structure. This densification, in turn, elevates the mass per unit volume, thereby enhancing the density. There is an abnormal trend observed for FPU/SCB2 which may be attributed to the complex interaction between the SCB filler and the FPU matrix during the foaming process. At 2 wt% SCB loading, the filler distribution, and dispersion may not be optimal, leading to a reduction in density. However, when the SCB content exceeds 4 wt%, the density decreases by 6.7% and 13.9% for FPU/SCB5 and FPU/SCB6, compared to FPU/SCB4, respectively. This reduction is likely due to poor dispersion of SCB at higher concentrations, leading to agglomeration, which in turn causes large pores and reduction in the density.3.4. Gel fraction
The gel fraction serves as an indicator of the extent of crosslinking between the SCB filler and the FPU matrix. Table 2 outlines the gel fraction values for both the control FPU and the FPU/SCB composites. The data reveals that incorporating SCB bio-filler enhances the gel fraction, with the FPU/SCB4 composite achieving a peak value of 94.516%. This improvement is attributed to the high lignin content in SCB, which provides a large number of hydroxyl groups on its surface. These hydroxyl groups facilitate the physical interactions with the FPU matrix, leading to reduced sorption and, consequently, a higher gel fraction.3.5. Mechanical performance
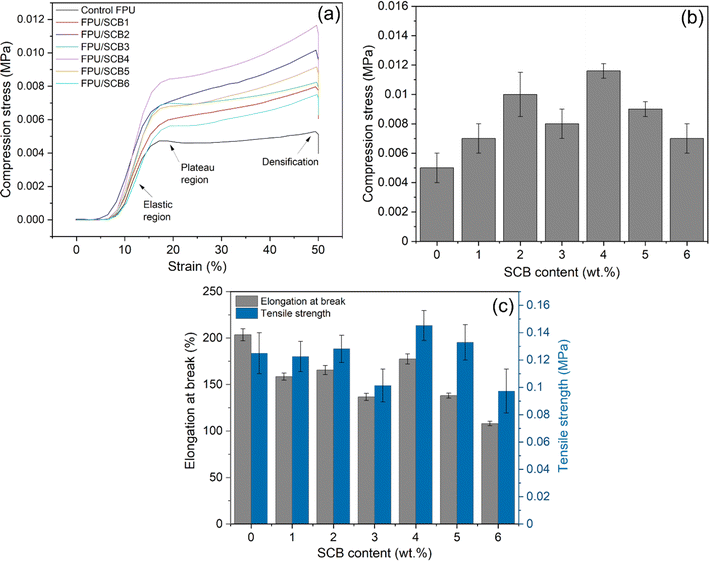
Fig. 6a shows the compression stress–strain plots for the control FPU and FPU/SCB composite samples, illustrating the typical behavior of FPU foams under compressive stress. The curves delineate three discernible regions. The initial phase signifies a linear elastic deformation, where the stress directly correlates with the strain due to the stiffness of the polymer matrix that inhibits cell collapse. This is followed by a prolonged plateau region, which reflects the buckling or deformation of the polymer cells. Finally, the third region entails densification, wherein the material undergoes compaction under high stress conditions.37,38The compression stress of the FPU/SCB composites generally exceeds that of the control FPU foam, with the FPU/SCB4 variant demonstrating the highest strength, as illustrated in Fig. 6b. This enhanced strength is due to the high concentration of hydroxyl (OH) groups from lignin, cellulose, and hemicellulose on the SCB surface. These OH groups promote physical interactions, especially hydrogen bonding, with the polymer matrix, thereby increasing the foam's stiffness and strength, enabling it to withstand external loads more effectively. The improvement is also supported by a rise in density and the gel fraction of the composite. While the FPU/SCB3 sample displays an abnormal trend, it still exhibits greater compression stress than the unfilled FPU. This discrepancy may result from improper mixing during preparation, potentially causing inconsistencies in the material's properties. However, when the SCB content exceeds 4 wt%, a slight reduction in compression stress was observed, though it remains higher than that of the control FPU foam. This reduction is likely caused by the clumping of SCB filler particles, which leads to an inconsistent distribution within the foam and creates weak spots, diminishing its compressive stress.
Fig. 6c presents the tensile strength data for both the control FPU foam and the FPU composites enriched with SCB bio-filler. The results indicate an increase in tensile strength with the addition of SCB up to 4 wt%, which can be attributed to the enhanced stiffness of the foam due to the presence of SCB. This improvement is significantly supported by the homogenous distribution of SCB within the polymer matrix and the increased crosslinking between the SCB and the FPU matrix. However, as shown in Fig. 6c, there is a noticeable decrease in the elongation at break for the composites compared to the control foam, indicating a reduction in flexibility with the addition of SCB.
3.6. Acoustic performance
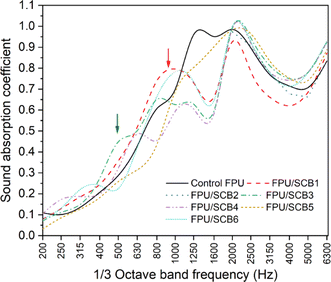
Upon incorporating SCB, the resonance peak shifts to a lower frequency of 800 Hz (SAC ∼ 0.8) along with an enhancement in absorption with 1 wt% SCB inclusion. The sound absorption capability of the FPU/SCB1 composite between 200–630 Hz surpassed that of the control FPU, displaying a slight resonance peak at 2000 Hz with SAC ∼ 0.9. This alteration may be attributed to the modifications in the chemical structure arising from the interaction between FPU and SCB during their reaction. For the FPU/SCB2 composite, a pattern similar to that of FPU/SCB1 was observed, albeit with a marginal increase in SAC amplitude at the second resonance peak, indicating that sound absorption efficiency tends to improve with higher SCB percentages in the higher frequency ranges. Remarkably, the FPU/SCB3 composite shows a significant sound absorption peak at 500 Hz with SAC ∼ 0.45, reflecting a shift of the resonance peak to lower frequencies with an increase in SCB content.
The FPU/SCB4 composite demonstrates higher absorption amplitude at lower frequencies up to 500 Hz than the control FPU sample, although these levels are lower than those of previous samples, with SAC of ∼0.4 at 500 Hz. This highlights the effect of SCB addition on shifting absorption characteristics towards lower frequencies. On the other hand, FPU/SCB5 shows a decrease in SAC amplitude at lower frequencies compared to earlier composites, potentially due to SCB agglomerating within the FPU matrix. For FPU/SCB6, the first resonance peak was observed a higher frequency of 1000 Hz with a SAC of ∼0.8, suggesting that further additions or higher percentages of SCB can result in frequency shifts towards higher ranges while maintaining peaks lower than those of the control FPU. The second sound absorption peak remains consistent in frequency and amplitude across these variations.
Several studies have investigated the effects of various fillers on the acoustic properties of FPU foam. For instance, Liu et al.39 examined the impact of silica fumes, by adding 1.4 wt% silica fumes to FPU foam resulting in a sound absorption coefficient SAC ∼ 0.3 in the frequency range of 200–1600 Hz, with a foam thickness of 50 mm. Maamoun et al.17 explored the use of seashell filler, reporting a sound absorption peak located at 2000–4000 Hz with an amplitude of approximately 0.9 when using 25 wt% seashell filler. Olcay et al.2 studied the effect of rice plant filler, observing an absorption behavior of the FPU at 800 Hz with an amplitude of approximately 0.4 using 5 wt% rice plant waste. In the present work, sound absorption was observed at 500 Hz with an amplitude of approximately 0.4, with a foam thickness of 20 mm. This peak occurs at a lower frequency compared to the previous studies, presenting a unique challenge in the application of noise mitigation at low frequencies.
![[thin space (1/6-em)]](https://www.rsc.org/images/entities/char_2009.gif) log(1 − α), where α is the sound absorption coefficient. This coefficient (α) is related to the damping (or loss) factor (η) through the relationship η = αλ/π, with λ representing the wavelength, expressed in Np m−1 (Neper, a unit without dimensions, employed in numerical computations) where 8.6 dB equals 1 Np.40,41 The α values used in this formula were taken from the attenuation in Fig. 7. The damping factor (η) is considered as the ratio of total energy conserved to total energy wasted in each cycle.
log(1 − α), where α is the sound absorption coefficient. This coefficient (α) is related to the damping (or loss) factor (η) through the relationship η = αλ/π, with λ representing the wavelength, expressed in Np m−1 (Neper, a unit without dimensions, employed in numerical computations) where 8.6 dB equals 1 Np.40,41 The α values used in this formula were taken from the attenuation in Fig. 7. The damping factor (η) is considered as the ratio of total energy conserved to total energy wasted in each cycle.Fig. 8a displays the decibel drop values across a frequency spectrum, where the drop varies between 10 and 45 dB. Each sample demonstrates maximum attenuation at its resonance frequency (peak). Both control and composite samples exhibit effective decibel drop in the mid to high frequency zones. Despite possessing a lower absorption compared to the composite samples, the blank sample shows a significant decibel drop.
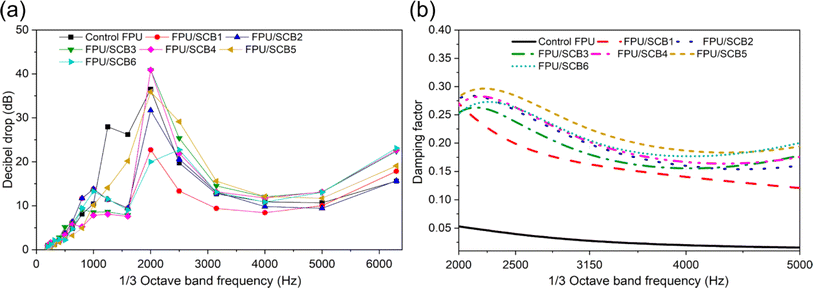 | ||
| Fig. 8 (a) Decibel drop versus frequency and (b) damping factor versus frequency for control FPU and FPU/SCB composites. | ||
In Fig. 8b, the performance of the damping factor across varying frequencies for the composite materials is illustrated. Composites containing 4 and 5 wt% of SCB exhibit higher amplitudes, whereas the differences among other composites are minimal. The control sample demonstrates a lower damping capability compared to the composite samples. The damping efficiency improved as the compatibility between the SCB material and the FPU sample increased. Elevating the filler content improves the damping ability up to the sample with 5 wt% SCB, which showcases the highest damping ability. Beyond this point, the ability begins to decline, which can be attributed to the unfavorable combination of SCB filler at higher loadings and FPU foam.
4. Conclusions
The study demonstrates the innovative use of sugarcane bagasse (SCB) waste fibers as a reinforcing agent in flexible polyurethane (FPU), focusing on its impact on enhancing the mechanical and acoustic properties of the resultant foam. Incorporating SCB fibers into the FPU matrix significantly influences the polymerization process, altering the density and affecting the foam's structure and properties, therefore it is crucial to recognize the significance of incorporating fillers into the FPU matrix. The successful preparation of FPU/SCB composites was confirmed by the FTIR technique. The morphological structure of the obtained composites exhibited a three-dimensional pore structure with three types of pores: closed, partially open, and completely open. The addition of SCB improved the tensile and compressive strength of the composites, particularly noticeable in the FPU/SCB 4 wt% composite, which outperformed the control sample. Adding 4 wt% of SCB resulted in the gel fraction reaching 94.516%, while the apparent density increased by 48.63% compared to the control FPU foam. Moreover, this reinforcement resulted in decent sound absorption capabilities, particularly in certain frequency ranges, with up to 4 wt% SCB addition improving low-mid frequency range absorption, and higher percentages favouring the higher frequency ranges without the need to increase the material's thickness. This demonstrates the potential of converting agricultural waste into valuable materials for industrial applications while addressing waste management challenges and sound pollution concerns. By incorporating SCB into FPU foams, this study exemplifies the promise of waste-to-worth transformations, advancing material science in alignment with environmental sustainability goals. The research underscores the importance of selecting natural filler concentrations to enhance specific properties of FPU foams, paving the way for future investigations into sustainable filler utilization for enhancing polymeric material performance.Data availability
All data generated or analyzed during this study are included in this article.Conflicts of interest
The authors declare that there is no conflict of interest.Acknowledgements
Prof. Dr Sonia Zulfiqar is highly thankful for the support provided by the Statutory City of Ostrava, Czechia through the Research Grant “Global Experts”. Profs. Cochran and Zulfiqar are grateful to the National Science Foundation for financial support through research grants NSF-2113695, NSF-2218070 and NSF-2242763.References
- A. A. Maamoun, A. Elkhateeb and S. Zulfiqar, Ind. Eng. Chem. Res., 2022, 61, 17937–17949 CrossRef CAS.
- H. Olcay and E. D. Kocak, Applied Acoustics, 2021, 173, 107733 CrossRef.
- E. M. Samsudin, L. H. Ismail and A. A. Kadir, ARPN J. Eng. Appl. Sci., 2016, 11, 3703–3711 Search PubMed.
- H. Choe, G. Sung and J. H. Kim, Compos. Sci. Technol., 2018, 156, 19–27 CrossRef CAS.
- B. Eling, Ž. Tomović and V. Schädler, Macromol. Chem. Phys., 2020, 221, 2000114 CrossRef CAS.
- A. Maamoun, A. Mahmoud, E. Nasr, E. Soliman, M. I. Sarwar and S. Zulfiqar, J. Polym. Res., 2019, 26, 1–10 CrossRef.
- S. Suleman, S. M. Khan, T. Jameel, W. Aleem and M. Shafiq, Asian J. Appl. Sci., 2014, 105, 7552–7557 Search PubMed.
- L. Cao, Q. Fu, Y. Si, B. Ding and J. Yu, Compos. Commun., 2018, 10, 25–35 CrossRef.
- N. Rastegar, A. Ershad-Langroudi, H. Parsimehr and G. Moradi, Iran. Polym. J., 2022, 1–23 Search PubMed.
- J. P. Arenas and M. J. Crocker, J. Sound Vib., 2010, 44, 12–18 Search PubMed.
- A. Maamoun and A. Mahmoud, Cellulose, 2022, 29, 6323–6338 CrossRef CAS.
- A. Micheal and R. R. Moussa, Ain Shams Eng. J., 2021, 12, 3297–3303 CrossRef.
- V. R. Da Silva, M. A. Mosiewicki, M. I. Yoshida, M. C. Da Silva, P. M. Stefani and N. E. Marcovich, Polym. Test., 2013, 32, 438–445 CrossRef.
- M. Stanzione, M. Oliviero, M. Cocca, M. Errico, G. Gentile, M. Avella, M. Lavorgna, G. Buonocore and L. Verdolotti, Carbohydr. Polym., 2020, 231, 115772 CrossRef CAS PubMed.
- C. C. B. da Silva, F. J. H. Terashima, N. Barbieri and K. F. de Lima, Appl. Acoust., 2019, 156, 92–100 CrossRef.
- M. Khaleel, U. Soykan and S. Çetin, Constr. Build. Mater., 2021, 308, 125014 CrossRef CAS.
- A. Maamoun, A. El-Wakil and T. M. El-Basheer, J. Cell. Plast., 2022, 58, 645–672 CrossRef CAS.
- S. Członka, A. Strąkowska and A. Kairytė, Polym. Test., 2020, 87, 106534 CrossRef.
- R. Gu and M. M. Sain, J. Polym. Environ., 2013, 21, 30–38 CrossRef CAS.
- M. Zieleniewska, M. K. Leszczyński, L. Szczepkowski, A. Bryśkiewicz, M. Krzyżowska, K. Bień and J. Ryszkowska, Polym. Degrad. Stab., 2016, 132, 78–86 CrossRef CAS.
- A. Karimah, M. R. Ridho, S. S. Munawar, Ismadi, Y. Amin, R. Damayanti, M. A. R. Lubis, A. P. Wulandari, Nurindah and A. H. Iswanto, Polymers, 2021, 13, 4280 CrossRef CAS PubMed.
- Y. Feng, T. L. Eberhardt, F. Meng, C. Xu and H. Pan, Bioresour. Technol., 2024, 400, 130666 CrossRef CAS PubMed.
- H. Olcay and E. D. Kocak, J. Ind. Text., 2020, 51, 8738S–8763S CrossRef.
- P. U. Chris-Okafor, A. R. M. Uchechukwu, J. N. Nwokoye and E. U. Ukpai, Am. j. polym. sci. technol., 2017, 3, 64–69 CrossRef.
- S. Chen and Y. Jiang, Polym. Compos., 2018, 39, 1370–1381 CrossRef CAS.
- Y. Hu, S. Ju, J. Luo and H. Pan, J. Solid State Chem., 2024, 337, 124751 CrossRef CAS.
- H. A. Raslan, E. Fathy and R. M. Mohamed, Int. J. Polym. Anal. Charact., 2018, 23, 181–192 CrossRef CAS.
- V. J. Oghenekohwo, A. A. Maamoun, S. Zulfiqar, M. J. Forrester, V. Slovák, T.-P. Wang and E. W. Cochran, ACS Appl. Polym. Mater., 2023, 6, 638–648 CrossRef.
- N. Aurangzeb, S. Zulfiqar, M. K. Khosa, V. Slovák, A. A. Maamoun, M. Forrester, M. I. Sarwar and E. W. Cochran, Polym. Eng. Sci., 2024, 64, 3109–3119 CrossRef CAS.
- A. A. Maamoun, A. A. Mahmoud, D. Naeim, M. Arafa and A. Esawi, Mater. Adv., 2024 10.1039/D4MA00304G.
- C.-J. Chen, M.-H. Tsai, I.-H. Tseng, A.-W. Hsu, T.-C. Liu and S.-L. Huang, RSC Adv., 2013, 3, 9729–9738 RSC.
- P. Cinelli, I. Anguillesi and A. Lazzeri, Eur. Polym. J., 2013, 49, 1174–1184 CrossRef CAS.
- A. A. Maamoun, M. A. Y. Barakat, A. E.-A. A. El-Wakil, S. Zulfiqar and V. J. Oghenekohwo, J. Polym. Res., 2023, 30, 286 CrossRef CAS.
- M. A. Lima, L. D. Gomez, C. G. Steele-King, R. Simister, O. D. Bernardinelli, M. A. Carvalho, C. A. Rezende, C. A. Labate, E. R. Deazevedo and S. J. McQueen-Mason, Biotechnol. Biofuels, 2014, 7, 1–19 CrossRef PubMed.
- A. A. Maamoun, D. M. Naeim, A. A. Mahmoud, A. M. Esawi and M. Arafa, Nano Energy, 2024, 124, 109426 CrossRef CAS.
- S. Gómez-Fernández, L. Ugarte, C. Peña-Rodriguez, M. Á. Corcuera and A. Eceiza, Polym. Degrad. Stab., 2016, 132, 41–51 CrossRef.
- T.-T. Li, W. Dai, S.-Y. Huang, H. Wang, Q. Lin, C.-W. Lou and J.-H. Lin, Mater. Des., 2019, 183, 108150 CrossRef CAS.
- M. Alzoubi, S. Al Hallaj and A. M. Abu, J. Solid Mech., 2014, 6, 82–97 Search PubMed.
- T. Liu, L. Mao, F. Liu, W. Jiang, Z. He and P. Fang, Wuhan Univ. J. Nat. Sci., 2011, 16, 29–32 CrossRef CAS.
- D. S. Mahmoud, S. H. El-Sabbagh, T. M. El-Basheer, A. Moustafa and M. A. Barakat, J. Thermoplast. Compos. Mater., 2023, 36, 4684–4706 CrossRef CAS.
- L. E. Kinsler, A. R. Frey, A. B. Coppens and J. V. Sanders, Fundamentals of Acoustics, John wiley & sons, 2000 Search PubMed.
| This journal is © The Royal Society of Chemistry 2024 |

