 Open Access Article
Investigating metal (M = Mn, Fe, and Ni)-doped Co(OH)2 nanofibers for electrocatalytic oxygen evolution and electrochemical biosensing performance†
Iqra Fareedab,
Muhammad Danish Khanab,
Sadia Murtazac,
Masood ul Hassan Farooqa,
Zia Ur Rehmand,
Muhammad Umer Farooqe,
Faheem K. Butt *e and
Muhammad Tahir
 *ef
*ef
aLaboratory of Eco-Materials and Sustainable Technology (LEMST), Natural Sciences and Humanities Department, New Campus, UET, Lahore, 54890, Pakistan
bDepartment of Physics, University of Engineering and Technology, Lahore, 54890, Pakistan
cDepartment of Physics, University of Lahore, 53700, Pakistan
dSchool of Environmental Science and Engineering, Yangzhou University, Yangzhou 225127, China
eDepartment of Physics, Division of Science and Technology, University of Education, Lahore, 54770, Pakistan. E-mail: faheemk.butt@ue.edu.pk
fSchool of Chemical Engineering, University of Birmingham, Birmingham, B15 2TT, UK. E-mail: m.tahir.3@bham.ac.uk
First published on 22nd August 2024
Abstract
To achieve efficient and cost-effective electrochemical water splitting, highly active and affordable nanostructured catalysts are the key requirement. The current study presents the investigations of the efficacy of metal (Mn, Fe and Ni)-doped Co(OH)2 nanofibers towards oxygen evolution via water splitting. Notably, Ni-doped Co(OH)2 demonstrates superior OER performance in KOH electrolyte, surpassing standard IrO2 with a modest potential of 1.62 V at 10 mA cm−2. The remarkable activity is attributed to the nanofiber structure, facilitating faster conduction and offering readily available active sites. Ni-doped Co(OH)2 nanofibers displayed enduring stability even after 1000 cycles. This work underscores the importance of transition-metal based catalysts as effective electrocatalysts, providing the groundwork for the development of cutting-edge catalysts. Additionally, the electrochemical sensing capability towards ascorbic acid is evaluated, with Ni-doped Co(OH)2 showing the most promising response, characterized by the lowest LOD and LOQ values. These findings highlight the potential of Ni-doped Co(OH)2 nanofibers for upcoming diagnostic detection devices.
Introduction
The intensifying energy crisis and severe environmental deterioration have prompted worldwide attention towards green energy sources for sustainable human and industrial growth.1–3 Finding sustainable and renewable energy sources in order to meet rising energy demands while abiding by stringent environmental regulations has been a challenge in recent years.4,5 Although there are numerous natural, sustainable and green energy sources, including solar, hydro, wind and geothermal energy, they are not suitable for continuous use owing to their uneven distribution.6 Water splitting is a potential solution to overcome this problem. Water splitting consists of two half reactions: the hydrogen evolution reaction (HER) at the cathode and oxygen evolution reaction (OER) at the anode.7 However, the overall water-splitting reaction is inhibited as it requires a large amount of energy to overcome the intrinsic energy barrier and is considered dynamically unfavorable.8 The OER involving four electron transfer with several proton–electron couplings requires much more energy than the typical two-electron transfer HER process.9,10 Therefore, the catalytic efficacy of water electrolysis is limited and thus additional research is being carried out to develop state-of-the-art OER catalysts. RuO2 and IrO2 are widespread standard OER catalysts, but the finite natural supply and high cost of noble metals make them unsuitable for commercial applications.11–13 Consequently, the focus has been shifted to the development of inexpensive metal-based electrocatalysts. Numerous catalytic materials in this regard have been researched and shown to have good performance.10 Nevertheless, challenges still persist in their practical implementation due to their reduced active sites, which limits their electrocatalytic activity.14 Thus, more investigations are required.Co-based electrocatalysts, with their abundance, excellent electrochemical activity and environment friendliness, have emerged as active catalysts. Co(OH)2, among the Co-based electrocatalysts, has attracted the attention of researchers owing to its layered structure as it facilitates the migration of electrons and ions.15,16 Co(OH)2 often exhibits two distinct crystal structures: α and β phase. α-Co(OH)2 manifests a layered structure made up of host layers and intercalated H2O molecules, whereas β-Co(OH)2 shows a brucite structure devoid of intercalated molecules.17,18 The small overpotential values of Co(OH)2 makes it an appropriate candidate for electrochemical applications; however, its reduced active sites and low electrical conductivity significantly pose limits to its OER efficiency.19,20 Thus, it has become a vital need to modify Co(OH)2 for enhancing the catalytic activity. S. Liu21 et al. synthesized β-Co(OH)2 nanowires via the phase transformation of Sn-incorporated Co2(OH)2CO3 to tune the intrinsic active sites. The resultant improvement in the catalytic activity with an overpotential of 321 mV at 20 mA cm−2 was reported. Q. Zhou22 et al. prepared Fe-doped Co(OH)2 enriched with reactive sites through the cation-exchange reaction. The charge transfer from Fe to Co significantly improved the electrical conductivity and hence the OER performance. Y. Cho23 et al. fabricated flower-like α-Co(OH)2 to evaluate its OER capability. The as-synthesized electrocatalyst required 270 mV to attain 10 mA cm−2 in 1 M KOH; excellent activity was attributed to the abundant active sites. M. Tahir et al.24 developed anion-doped Co(OH)2-coated g-C3N4 nanowires having ∼110 nm diameter through a facile hydrothermal method to study the OER. The as-prepared catalyst achieved an overpotential of 0.32 mV at 10 mA cm−2 along with remarkable stability. The outstanding activity was credited to readily available reactive sites. D. McAteer et al.25 reported Co(OH)2 nanosheets via the liquid exfoliation method to enhance the catalytic activity towards oxygen evolution. The edges of the nanosheets were verified to contribute as active sites for the reaction. With the addition of carbon nanotubes, the conductivity was further improved and the catalyst attained an overpotential of 235 mV at a current density of 50 mA cm−2.
Ascorbic acid is an essential component of the metabolic process. It serves as an antioxidant, enzyme co-factor, and neuromodulator in the brain. Ascorbic acid has the ability to indicate the human immunodeficiency virus and thus used to treat a variety of diseases.26 Therefore, the development of innovative ascorbic acid measurement techniques is essential. Electrochemical detection has gained popularity in this respect due to its sensitivity, accuracy and stability.27,28 Researchers are still improving the sensing ability using different sensing materials with standard electrodes. M. R. S. Pelissari29 et al. prepared Co(OH)2 thin film on a fluorine-doped tin oxide (FTO) conducting substrate to explore its functionality towards the electro-oxidation of ascorbic acid. In KOH and KCl solution, the sensitivity values of 182.3 mA L mol−1 cm−2 and 119.4 mA L mol−1 cm−2 were reported, respectively. The electrode displayed good stability in KCl, exhibiting that Co(OH)2 is a promising candidate for ascorbic acid sensing.
In this investigation, Co(OH)2 and metal (Mn, Fe and Ni)-doped Co(OH)2 nanofibers were synthesized using the template-free hydrothermal method and characterized by XRD, FTIR and SEM. The as-prepared material is well-suited to catalyze the OER in alkaline medium, evidenced from the small overpotential value and higher current density than standard IrO2, thus exhibiting exceptional performance of cost-effective transition metal-based catalysts towards water electrolysis. Furthermore, the as-synthesized materials were evaluated for their ability to detect various concentrations of ascorbic acid in phosphate-buffered saline (PBS) electrolyte, marking the first instance of such an analysis. The limits of detection (LOD) and limits of quantification (LOQ), which are crucial parameters for the development of future electrochemical devices aimed at detecting ascorbic acid, were also calculated. This dual functionality, efficient OER catalysis and sensitive detection of ascorbic acid positions the as-synthesized materials as promising candidates for the design and advancement of alternative electrochemical detection devices.
Experimentation
Chemicals
Cobalt(II) chloride hexahydrate (CoCl2·6H2O), manganese(II) chloride tetrahydrate (MnCl2·4H2O), iron(II) chloride tetrahydrate (FeCl2·4H2O), nickel(II) chloride hexahydrate (NiCl2·6H2O) and urea (NH2CONH2) were purchased from Sigma Aldrich and utilized without any further processing.Material synthesis
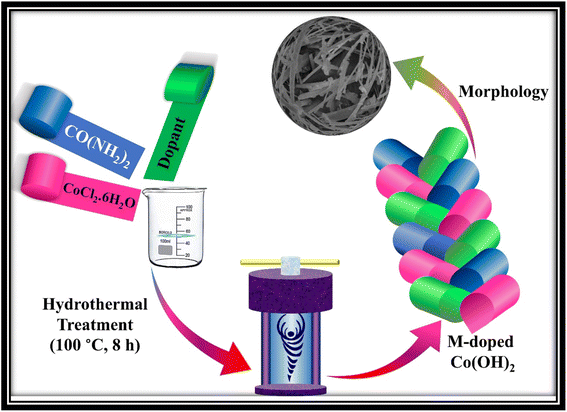
Co(OH)2 was synthesized employing a widely recognized wet chemical methodology known as template-free hydrothermal synthesis, renowned for its efficacy in yielding well-defined nanostructures. The synthesis procedure commenced with the complete dissolution of 3.24 g of CoCl2·6H2O and 1.5 g of urea in 50 mL of distilled water, facilitated by a magnetic hot-plate to ensure homogeneity. Subsequently, the homogenized solution was carefully migrated into a Teflon-lined stainless-steel autoclave to maintain the reaction integrity. The autoclave, containing the reaction mixture, underwent thermal treatment in a thermo-constant oven for an uninterrupted duration of 8 h at a controlled temperature of 100 °C, promoting the hydrothermal growth of Co(OH)2 nanostructures. Following the completion of the synthesis duration, the autoclave was permitted to naturally cool down to ambient temperature, enabling the gradual precipitation of the desired product. The resultant constituents were meticulously collected, subjected to thorough washing cycles utilizing a centrifuge machine to eliminate any residual impurities and subsequently dried at a temperature of 60 °C. The as-prepared nanoparticles were called CHNF.To synthesize Mn-doped Co(OH)2 (MCHNF), Fe-doped Co(OH)2 (FCHNF) and Ni-doped Co(OH)2 (NCHNF), precursor salts of manganese, iron and nickel were introduced into the reaction system. Different amounts of MnCl2·4H2O, FeCl2·4H2O and NiCl2·6H2O were separately added to the reaction mixture to achieve 5% doping. All other reaction parameters and conditions remained unchanged from the previously described synthesis procedure. The synthesis process for these doped variants is illustrated in Fig. 1.
Characterization
Using typical Cu-Kα radiation source with a wavelength of 0.15 nm, X-ray diffraction (XRD) was studied in the range of 2θ = 10° to 90° using a Philips X'Pert Pro MPD to determine the crystal structure of the as-synthesized catalysts. With the help of Fourier-transform infrared spectroscopy (FTIR, PerkinElmer L1600107) in the ATR mode, the availability of functional groups at the surface was investigated. Morphological inquiries were carried out using a scanning electron microscope (SEM, Hitachi S-4800) and a transmission electron microscope (TEM, FEI Tecnai T20).Electrochemical measurements
Electrochemical measurements were carried out on a Corrtest CS-300 potentiostat equipped with CS-studio 5.4 software. The three-electrode setup with a reference electrode of Ag/AgCl electrode, counter electrode made up of platinum wire and working electrode of glassy carbon (GCE) was selected for electrochemical analysis. Prior to use, GCE was polished with 0.3 μm alumina powder, cleaned with distilled water and ethanol separately in an ultrasonication bath and dried in an oven. The conductive material emulsion was prepared by dispersing 4 mg of the as-synthesized catalyst with 1000 μL of distilled water and ethanol (4![[thin space (1/6-em)]](https://www.rsc.org/images/entities/char_2009.gif) :
:![[thin space (1/6-em)]](https://www.rsc.org/images/entities/char_2009.gif) 1). 0.5 mg of polytetrafluoroethylene (PTFE) was also added to provide strength for adhesion. The conductive material ink was applied on GCE using the dip coating technique, followed by drying. Cyclic voltammetry (CV) and linear sweep voltammetry (LSV) curves were obtained for subsequent analysis.
1). 0.5 mg of polytetrafluoroethylene (PTFE) was also added to provide strength for adhesion. The conductive material ink was applied on GCE using the dip coating technique, followed by drying. Cyclic voltammetry (CV) and linear sweep voltammetry (LSV) curves were obtained for subsequent analysis.
Electrocatalytic OER
To explore the catalytic potential of the as-prepared catalysts, 1 M KOH (pH = 14) was employed as an electrolyte due to its high ionic conductivity and chemical stability. LSV curves were acquired to investigate the OER. The potential is specified according to reversible hydrogen electrode (RHE) with the help of the following equation.30| ERHE = EAg/AgCl + 0.197 + 0.059 × pH | (1) |
Tafel slopes were computed from LSV polarization curves using the well-known Tafel relation to study the catalytic activity31
η = a + b![[thin space (1/6-em)]](https://www.rsc.org/images/entities/char_2009.gif) log(j) log(j)
| (2) |
Electrochemical bio-sensing
For electrochemical bio-sensing, the calculations were undertaken in 0.1 M phosphate buffer saline (PBS) with pH = 7 as the electrolyte as it facilitates the charge transport to maintain the electrical current in the circuit. CV curves were collected at a constant 50 Hz frequency by varying the ascorbic acid concentrations from 1 to 10 mM. The electrochemical sensing response was assessed by calculating the limit of detection (LOD) and limit of quantification (LOQ) using the following relations.32
 | (3) |
 | (4) |
Results and discussion
Physiochemical analysis
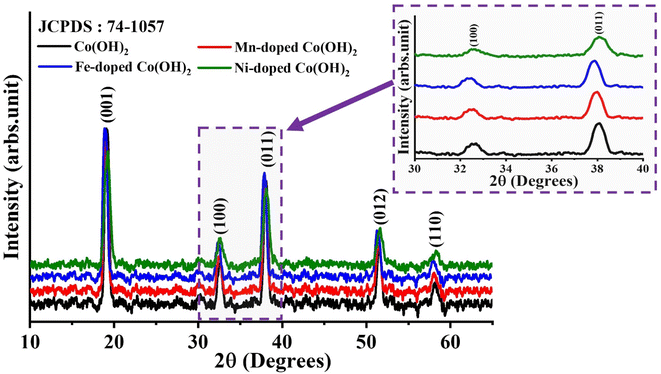
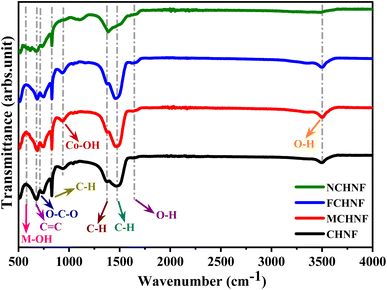
To characterize the crystallographic arrangement and phase constituents, the XRD patterns of as-prepared CHNF, MCHNF, FCHNF and NCHNF were collected and are presented in Fig. 2. The diffraction from the crystal planes (001), (100), (011), (012) and (110) were indexed to 2θ = 19.70°, 32.60°, 38.10°, 51.48° and 58.20°, respectively, in good agreement with JCPDS card no. 01-074-1057, authenticating Co(OH)2 formation.33 There was no extra peak observed, indicating the absence of any impurity. The addition of dopant Mn, Fe and Ni substitutes the Co in the crystal lattice as they exhibit comparable radii.34 Mn and Fe incorporation displays a slight shift towards lower diffraction angles while Ni addition manifests a slight shift towards higher angles in peak positions.35To ascertain the presence of distinct functional groups, FTIR analysis of the as-prepared CHNF, MCHNF, FCHNF and NCHNF was performed. The peaks at 3496 cm−1, 1640 cm−1, 1465 cm−1, 1370 cm−1, 938 cm−1, 830 cm−1, 711 cm−1, 676 cm−1 and 580 cm−1 are visualized in Fig. 3. The presence of water molecules in the layers is authenticated by O–H vibrations at 3496 cm−1.36,37 Further, the stretching vibrations of free water molecules is noted from the signature maxima located at 1640 cm−1.37,38 The IR maxima at 1465 cm−1, 1370 cm−1 and 830 cm−1 are for C–H bending, associated with ethanol washing, as per the IR spectrum. The existence of Co–OH vibration is evidenced from the peak at 938 cm−1.39,40 The transmittance at 711 cm−1 is credited to O–C–O vibrations.39,41 The availability of transition metals in terms of M–OH is recorded at 580 cm−1,41 while the peak at 670 cm−1 is ascribed to C![[double bond, length as m-dash]](https://www.rsc.org/images/entities/char_e001.gif) C vibration, referring to the IR spectrum.
C vibration, referring to the IR spectrum.
Morphological investigations
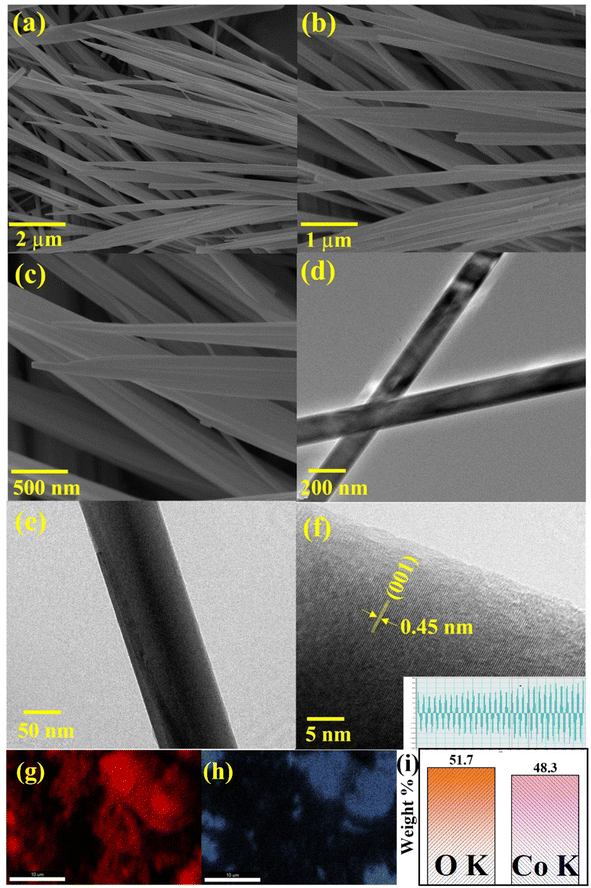
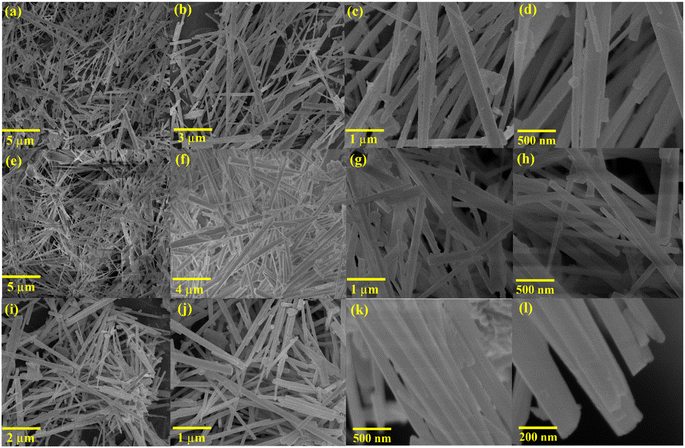
To delineate the surface morphology of the as-prepared CHNF, SEM and high-resolution TEM images are supplied in Fig. 4. Evidently, Co(OH)2 displayed nanofiber-like morphology with ∼175 nm diameter and a smooth surface. This is due to hydrothermal synthesis, which provides a nucleation site for subsequent growth of nanofibers at high temperature and pressure, which further helps to elongate them along the specified crystallographic direction. HRTEM verifies the growth along the (001) direction, confirming the successful CHNF synthesis and in accordance with XRD analysis. The elemental analysis and weight percentage obtained by EDX also confirms the presence of both Co and O in the material, further supporting Co(OH)2 synthesis, provided in Fig. 4(g–i).The morphological aspects of MCHNF, FCHNF and NCHNF were also investigated and are displayed in Fig. 5. Randomly oriented one-dimensional nanofibers with diameter of ∼145 nm, ∼142 nm and ∼144 nm are observed for MCHNF, FCHNF and NCHNF, respectively. These nanostructures offer high surface-to-volume ratio and provide abundant reactive sites for catalysis, while their well-defined crystal facets enable the precise control over catalytic performance.42–44 Such characteristics makes them promising candidates for catalytic applications. The EDX spectra along with the elemental analysis is attached in Fig. S1–S3 (ESI†). The peaks of Fe, Mn and Ni can be identified in the EDX spectra, confirming the doping in CHNF.
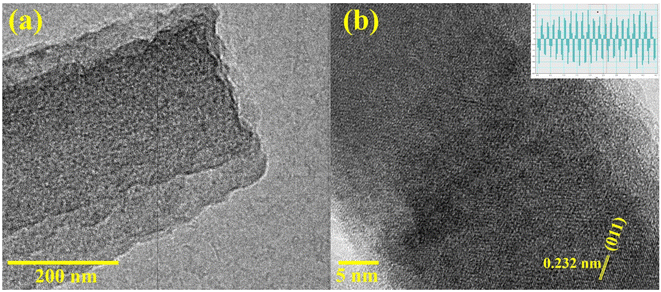
HRTEM analysis was further conducted for NCHNF to visualize the detailed morphology with high spatial resolution. The as-obtained HRTEM images are attached in Fig. 6 and are in agreement with SEM investigations. The spacing of lattice fringes was calculated to be 0.32 nm, which can be ascribed to the crystallographic (011) direction of Co(OH)2.
Electrocatalytic oxygen evolution
To evaluate the catalytic activity of CHNF, MCHNF, FCHNF and NCHNF, LSV polarization curves were obtained in 1 M KOH and are displayed in Fig. 7(a). CHNF demonstrated an onset potential of 1.65 V, while the addition of dopant lowers the onset potential and it was noted to be 1.586 V, 1.589 V and 1.56 V for MCHNF, FCHNF and NCHNF, respectively. The high onset potential and small current density of CHNF is evident of its poor catalytic performance. However, the dopant Mn, Fe and Ni may alter the electronic environment by promoting the adsorption and facilitating the efficient charge transport and ultimately leading to reduced energy barrier for oxygen evolution.44–46 On the other hand, CHNF, MCHNF, FCHNF and NCHNF require a potential of 1.73 V, 1.65 V, 1.66 V and 1.62 V, respectively, to attain 10 mA cm−2, while standard IrO2 needs 1.67 V to do the same. It is noteworthy that NCHNF provided the superior catalytic activity with an overpotential of 390 mV at 10 mA cm−2, even more than the universally accepted OER reference IrO2. The Tafel slope was ascertained to investigate the OER kinetics using eqn (2) and is shown in Fig. 7(b). CHNF, MCHNF, FCHNF, NCHNF and IrO2 possessed a Tafel slope of 115 mV dec−1, 98 mV dec−1, 104 mV dec−1, 79 mV dec−1 and 110 mV dec−1, respectively. NCHNF exhibited the smallest Tafel slope, manifesting good ionic conductivity, which makes the OER more effective than that using the standard noble metal-based IrO2 catalyst.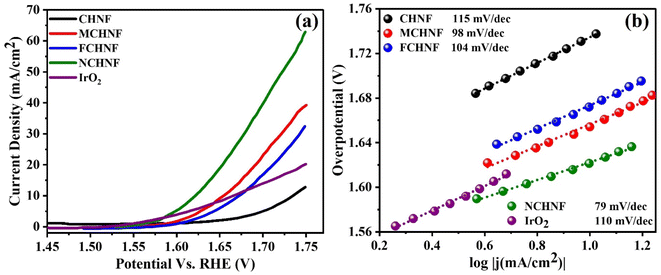 | ||
| Fig. 7 (a) LSV polarization curves using OHNF, MCHNF, FCHNF and NCHNF electrocatalysts and their corresponding (b) Tafel slopes. | ||
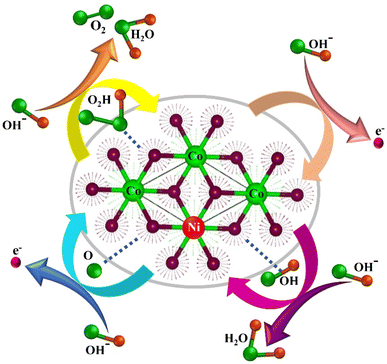
The exceptional OER performance of NHCF arises from enhanced Ni and Co coupling. Ni doping into the Co(OH)2 lattice intrinsically accelerates the charge transfer from the Ni sites to active Co centers, facilitates increased electrical conductivity and thereby modulates the electronic structure.47 This synergistic interaction promotes efficient OH− adhesion and enhances the OER catalytic activity in an alkaline environment. Typically, oxygen evolution is initiated with the cleavage of water molecule (H2O) and the subsequent production of OH−. This OH− species is adsorbed at the surface of NCHNF depending upon the bond strength between the active sites and OH− to generate various oxygen intermediates such as adsorbed O* and OOH*, ultimately leading to O2 evolution.19,48 The mechanism is exhibited in Fig. 8. These findings undoubtedly demonstrate the remarkable outperformance of NCHNF towards state-of-the-art electrocatalysts.
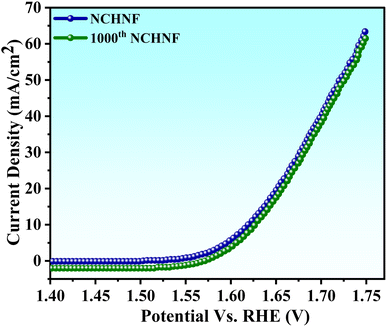
For practical usage, the efficiency and stability are crucial parameters. The as-prepared NCHNF was thus examined for 1000 cycles with a scan rate of 100 mV s−1, and the LSV arc for the 1000th cycle is shown in Fig. 9. A negligible change in the catalytic activity was noticed, indicating superb efficiency in alkaline KOH for long-term use. The investigation highlights the potential of NCHNF to replace the expensive rare-earth metal catalysts in the commercialization of water-splitting electrolyzers.
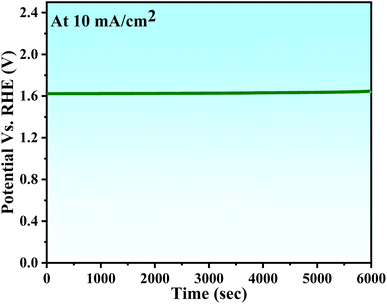
The stability of NCHNF was also evaluated through chronopotentiometry measurements conducted under sustained conditions of a current density of 10 mA cm−2 for 6000 s. The results are provided in Fig. 10. The overpotential revealed a gradual and minimal escalation over the 6000 s test period, thereby affirming the robust and enduring performance of the catalyst in facilitating OER.
A comparison of similar type of studies is provided in Table 1.
| Electrocatalyst | Synthesis | Morphology | Electrolyte | Overpotential (mV)@current density (mA cm−2) | Tafel slope (mV dec−1) | Reference |
|---|---|---|---|---|---|---|
| CeO2/Co(OH)2 | Precipitation method | Nanoparticles & nanoplates | 1 M KOH | 410@10 | 66 | 49 |
| Fe3O4/Co(OH)2 | Hydrothermal method | Nanoparticles decorated nanosheets | 0.1 M KOH | 390@10 | 61.1 | 50 |
| β-Co(OH)2 | Electrochemical exfoliation | Hexagonal flake | 1 M KOH | 390@10 | 57 | 51 |
| Co(OH)2@rGO nanoflakes | Reflux method | Nanoparticles | 2 M KOH | 417@10 | 56.5 | 52 |
| Co(OH)2 | Precipitation method | Nanoplates | 1 M KOH | 420@10 | 85 | 53 |
| β-Co(OH)2 | Precipitation method | Nanosheets | 0.1 M KOH | 463@10 | 101 | 54 |
| β-Ni(OH)2 | Hydrothermal method | Nanoplates | 0.1 M KOH | 444@10 | 111 | 55 |
| α-Co(OH)2 | Precipitation method | Hexagonal plates | 0.1 M KOH | 400@10 | 44 | 48 |
| β-Co(OH)2 | 463@10 | 39 | ||||
| Co(OH)2 | Hydrothermal method | Nanofiber | 1 M KOH | 500@10 | 115 | This work |
| Mn-doped Co(OH)2 | 420@10 | 98 | ||||
| Fe-doped Co(OH)2 | 430@10 | 104 | ||||
| Ni-doped Co(OH)2 | 390@10 | 79 |
Electrochemical ascorbic acid sensing
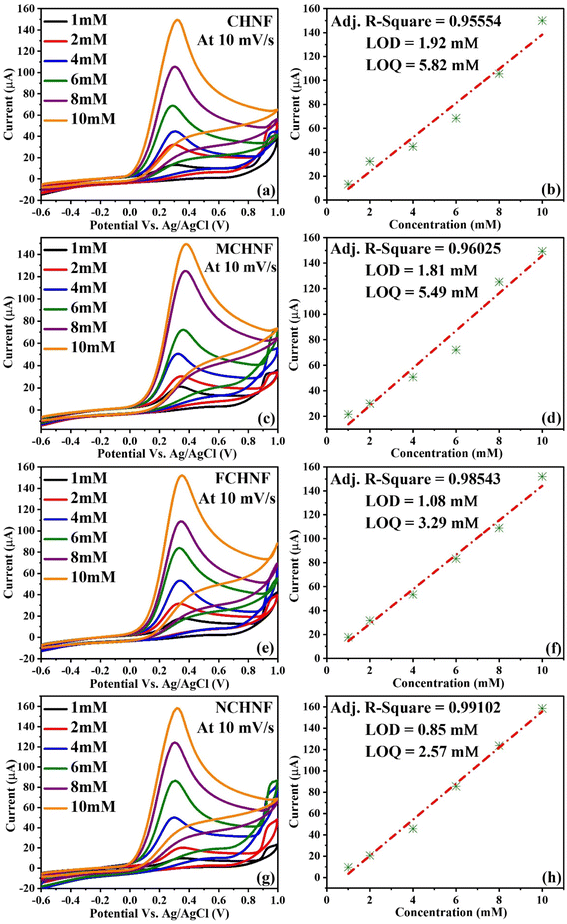
The efficacy of the as-prepared CHNF, MCHNF, FCHNF and NCHNF towards electrochemical sensing was determined using ascorbic acid as a biomolecule. The cyclic voltammetric curves at a scan rate of 10 mV s−1 employing CHNF, MCHNF, FCHNF and NCHNF as the sensing analyte are shown in Fig. 11. With the increase in the ascorbic acid concentration, an increase in anodic current is noticed. This is because ascorbic acid oxidizes to L-dehydro ascorbic acid, releasing 2e− and 2H+, which makes up the redox current.56 The redox current reaches to 150 μA, 150.39 μA, 152 μA and 158.5 μA for CHNF, MCHNF, FCHNF and NCHNF, respectively. NCHNF presented the maximum value of the current drawn during the oxidation process, indicating its more conductive nature and outstanding electrochemical response. Furthermore, the regression value was estimated for precise monitoring during detection. It comes out as 0.95554 for CHNF, 0.96025 for MCHNF, 0.98543 for FCHNF and 0.99102 for NCHNF. The LOD values were calculated using eqn (3) to report the minimum detectable concentrations. NCHNF with 0.85 mM was superior to CHNF (1.92 mM), MCHNF (1.81 mM) and FCHNF (1.08 mM). The LOQ value for reliable measurements was established employing eqn (4) and NCHNF exhibited the best response with 2.57 mM, followed by FCHNF (3.29 mM), MCHNF (5.49 mM) and CHNF (5.82 mM). The regression, LOD and LOQ values for CHNF, MCHNF, FCHNF and NCHNF are summarized in Table 2. On the basis of the reported results, NCHNF is considered to help in monitoring the food quality and medical diagnostics due to its sensitivity and has probable use for next-generation detection equipment.| Material | Adj. R-square | LOD (mM) | LOQ (mM) |
|---|---|---|---|
| CHNF | 0.95554 | 1.92 | 5.82 |
| MCHNF | 0.96025 | 1.81 | 5.49 |
| FCHNF | 0.98543 | 1.08 | 3.29 |
| NCHNF | 0.99102 | 0.85 | 2.57 |
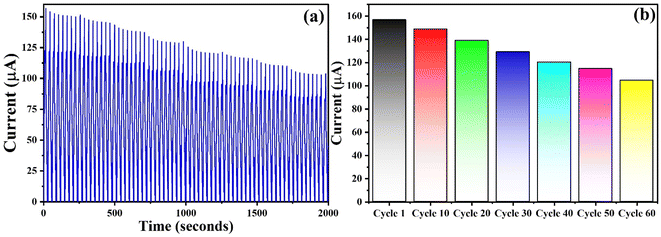
During the typical electrochemical detection of ascorbic acid, it was converted into L-dehydro ascorbic acid, releasing electron that constitutes the anodic current and the associated oxidation peak is observed in the range of 0.3–0.6 V vs. Ag/AgCl. However, the absence of reduction peak indicates the irreversible nature of the reaction. NCHNF was successfully subjected to ascorbic acid detection over a period of 2000 seconds, corresponding to approximately 60 cycles. With multiple CV runs, a decrease in the oxidation current is an indication of the reduction in the amount of ascorbic acid being detected. The gradual decrease in ascorbic acid concentration can be clearly seen from Fig. 12(a and b). This consistent decrease in ascorbic acid without any anomalous results demonstrates that NCHNF is highly suitable and reliable for the sensing of ascorbic acid over extended periods.
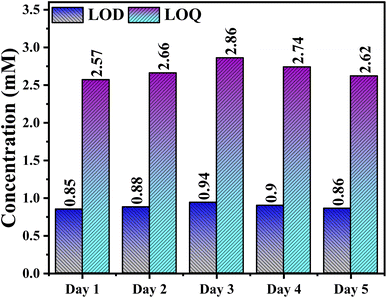
The stability of the NCHNF electrode in sensing ascorbic acid was further assessed by monitoring LOD and LOQ values over a period of 5 days. NCHNF exhibited robust stability, as evidenced by the consistent LOD and LOQ values in Fig. 13. This consistency implies that NCHNF maintains sensitivity and performance characteristics effectively even when exposed to ambient air conditions between measurements. The results indicate minimal variability and thus reliable and reproducible sensing capabilities of NCHNF for ascorbic acid detection.
Conclusion
In this study, we synthesized cobalt hydroxide and its counterparts (Mn, Fe and Ni)-doped Co(OH)2 via a template-free hydrothermal method. The confirmation of successful synthesis with high purity was obtained through XRD and FTIR analysis. Morphological characterization revealed nanofiber structures using SEM, further supported by TEM investigations. The electrocatalytic performance of the as-synthesized materials in water splitting reactions showcased excellent activity, characterized by lower potential values. Ni-doped Co(OH)2 nanofibers exhibited superior performance, achieving a potential of 1.62 V vs. RHE at 10 mA cm−2 in alkaline KOH, exceeding that of standard IrO2 and displaying remarkable stability over 1000 cycles. This emphasizes the potential of transition metal-based electrocatalysts for commercial applications. Furthermore, the as-synthesized materials exhibited exceptional electrochemical detection of ascorbic acid, which is particularly evident in Ni-doped Co(OH)2 nanofibers with a detection limit of 0.85 μA, suggesting its utility in future detection devices. These exemplary performances are attributed to the favorable electrical conductivity and nanofiber morphology of Ni-doped Co(OH)2.Data availability
The data will be made available on reasonable request from the corresponding author.Conflicts of interest
There are no conflict of interests to declare.Acknowledgements
M. Tahir is funded by EU H2020 Marie Skłodowska-Curie Fellowship (1439425).References
- A. L. Hoang, S. Balakrishnan, A. Hodges, G. Tsekouras, A. Al-Musawi, K. Wagner, C.-Y. Lee, G. F. Swiegers and G. G. Wallace, Sustainable Energy Fuels, 2023, 7(1), 31–60, 10.1039/D2SE01197B.
- Y. Huang, Y. Liang, Y. Rao, D. Zhu, J. J. Cao, Z. Shen, W. Ho and S. C. Lee, Environ. Sci. Technol., 2017, 51(5), 2924–2933, DOI:10.1021/acs.est.6b04460.
- I. Fareed, M. ul H. Farooq, M. D. Khan, M. F. Yunas, Y. Sandali, Z. Ali, M. Tanveer and F. K. Butt, Mater. Chem. Phys., 2024, 316, 129062, DOI:10.1016/j.matchemphys.2024.129062.
- F. K. Butt, C. Cao, F. Idrees, M. Tahir, R. Hussain, R. Ahmed and W. S. Khan, Int. J. Hydrogen Energy, 2015, 40(30), 9359–9364, DOI:10.1016/j.ijhydene.2015.05.086.
- M. D. Khan, M. ul H. Farooq, I. Fareed, Z. Ali, H. S. Anum, Y. Sandali, M. B. Tahir and F. K. Butt, Ind. Eng. Chem. Res., 2024 DOI:10.1021/acs.iecr.3c03289.
- A. K. Hussein, Renewable Sustainable Energy Rev., 2015, 42, 460–476, DOI:10.1016/j.rser.2014.10.027.
- M. Tahir, L. Pan, R. Zhang, Y. C. Wang, G. Shen, I. Aslam, M. A. Qadeer, N. Mahmood, W. Xu, L. Wang, X. Zhang and J. J. Zou, ACS Energy Lett., 2017, 2(9), 2177–2182, DOI:10.1021/ACSENERGYLETT.7B00691/SUPPL_FILE/NZ7B00691_SI_001.PDF.
- M. Athar, M. Fiaz, M. A. Farid, M. Tahir, M. A. Asghar, S. Ul Hassan and M. Hasan, ACS Omega, 2021, 6(11), 7334–7341, DOI:10.1021/ACSOMEGA.0C05412/ASSET/IMAGES/MEDIUM/AO0C05412_M011.GIF.
- R. K. Mishra, G. J. Choi, H. J. Choi, J. Singh, S. H. Lee and J. S. Gwag, J. Alloys Compd., 2022, 921, 166018, DOI:10.1016/j.jallcom.2022.166018.
- M. Tahir, L. Pan, F. Idrees, X. Zhang, L. Wang, J. J. Zou and Z. L. Wang, Nano Energy, 2017, 37, 136–157, DOI:10.1016/J.NANOEN.2017.05.022.
- D. Chauhan, M. Itagi and Y. H. Ahn, ChemCatChem, 2023, 15(15), e202300562, DOI:10.1002/CCTC.202300562.
- X. Ding, R. Jiang, J. Wu, M. Xing, Z. Qiao, X. Zeng, S. Wang and D. Cao, Adv. Funct. Mater., 2023, 33(47), 2306786, DOI:10.1002/ADFM.202306786.
- M. Tahir, N. Mahmood, X. Zhang, T. Mahmood, F. K. Butt, I. Aslam, M. Tanveer, F. Idrees, S. Khalid, I. Shakir, Y. Yan, J. Zou, C. Cao and Y. Hou, Nano Res., 2015, 8(11), 3725–3736, DOI:10.1007/S12274-015-0872-1/METRICS.
- D. R. Paudel, U. N. Pan, R. B. Ghising, M. R. Kandel, S. Prabhakaran, D. H. Kim, N. H. Kim and J. H. Lee, Appl. Catal., B, 2023, 331, 122711, DOI:10.1016/J.APCATB.2023.122711.
- S. Ali Ansari, N. Parveen, M. Al Saleh Al-Othoum and M. Omaish Ansari, J. Adv. Res., 2023, 50, 107–116, DOI:10.1016/J.JARE.2022.10.009.
- Z. Hou, J. Yu, X. Zhou, Z. Chen, J. Xu, B. Zhao, W. Gen and H. Zhang, J. Colloid Interface Sci., 2023, 646, 753–762, DOI:10.1016/J.JCIS.2023.05.128.
- X. Ren, E. Bao, X. Liu, Y. Xiang, C. Xu and H. Chen, Colloids Surf., A, 2023, 667, 131391, DOI:10.1016/J.COLSURFA.2023.131391.
- B. Sun, W. Zheng, S. Lou, B. Xie, C. Cui, G.-X. Zhang, F. Kong, Y. Ma, C. Du, P. Zuo, J. Xie and G. Yin, Adv. Funct. Mater., 2023, 33(6), 2211711, DOI:10.1002/ADFM.202211711.
- C. Lyu, J. Cheng, K. Wu, J. Wu, J. Hao, Y. Chen, H. Wang, Y. Yang, N. Wang, W. M. Lau and J. Zheng, J. Alloys Compd., 2023, 934, 167942, DOI:10.1016/J.JALLCOM.2022.167942.
- W. Luo, Q. Gao, Z. Ma, X. Ma, Y. Jiang, W. Shen, R. He, W. Su and M. Li, Sci. China Mater., 2023, 66(6), 2246–2256, DOI:10.1007/S40843-022-2386-3/METRICS.
- S. Liu, R. T. Gao, M. Sun, Y. Wang, T. Nakajima, X. Liu, W. Zhang and L. Wang, Appl. Catal., B, 2021, 292, 120063, DOI:10.1016/J.APCATB.2021.120063.
- Q. Zhou, Y. Chen, G. Zhao, Y. Lin, Z. Yu, X. Xu, X. Wang, H. K. Liu, W. Sun and S. X. Dou, ACS Catal., 2018, 8(6), 5382–5390, DOI:10.1021/ACSCATAL.8B01332/ASSET/IMAGES/LARGE/CS-2018-01332R_0006.JPEG.
- Y. Cho, J. Lee, T. T. H. Nguyen, J. W. Bae, T. Yu and B. Lim, J. Ind. Eng. Chem., 2016, 37, 175–179, DOI:10.1016/J.JIEC.2016.03.025.
- M. Tahir, N. Mahmood, L. Pan, Z. F. Huang, Z. Lv, J. Zhang, F. K. Butt, G. Shen, X. Zhang, S. X. Dou and J. J. Zou, J. Mater. Chem. A, 2016, 4(33), 12940–12946, 10.1039/C6TA05088C.
- D. McAteer, I. J. Godwin, Z. Ling, A. Harvey, L. He, C. S. Boland, V. Vega-Mayoral, B. Szydłowska, A. A. Rovetta, C. Backes, J. B. Boland, X. Chen, M. E. G. Lyons and J. N. Coleman, Adv. Energy Mater., 2018, 8(15), 1702965, DOI:10.1002/AENM.201702965.
- X. H. Liang, A. X. Yu, X. J. Bo, D. Y. Du and Z. M. Su, Coord. Chem. Rev., 2023, 497, 215427, DOI:10.1016/J.CCR.2023.215427.
- G. S. Geleta, Sens. Bio-Sens. Res., 2024, 43, 100610, DOI:10.1016/J.SBSR.2023.100610.
- K. Dhara and R. M. Debiprosad, Anal. Biochem., 2019, 586, 113415, DOI:10.1016/J.AB.2019.113415.
- M. R. da Silva Pelissari, E. Archela, C. R. T. Tarley and L. H. Dall'Antonia, Ionics, 2019, 25(4), 1911–1920, DOI:10.1007/S11581-019-02845-5/FIGURES/9.
- M. Safdar, M. Iftikhar, S. Rashid, M. Awais, A. Iqbal, A. Bilal, S. Aslam and M. Mirza, Int. J. Hydrogen Energy, 2024, 50, 107–117, DOI:10.1016/J.IJHYDENE.2023.07.252.
- K. B. Patel, B. Parmar, K. Ravi, R. Patidar, J. C. Chaudhari, D. N. Srivastava and G. R. Bhadu, Appl. Surf. Sci., 2023, 616, 156499, DOI:10.1016/J.APSUSC.2023.156499.
- I. Fareed, M. ul H. Farooq, M. D. Khan, Z. Ali and F. K. Butt, Mater. Sci. Semicond. Process., 2024, 177, 108327, DOI:10.1016/j.mssp.2024.108327.
- A. Gupta, S. D. Tiwari and D. Kumar, Phys. Status Solidi B, 2016, 253(9), 1795–1798, DOI:10.1002/PSSB.201552771.
- A. Riaz, F. Shaheen, M. Alam, M. Tanveer, Q. ul Aain and G. Nabi, Mater. Sci. Semicond. Process., 2024, 176, 108311, DOI:10.1016/J.MSSP.2024.108311.
- R. Yousefi, F. Jamali-Sheini, M. Cheraghizade, S. Khosravi-Gandomani, A. Sáaedi, N. M. Huang, W. J. Basirun and M. Azarang, Mater. Sci. Semicond. Process., 2015, 32, 152–159, DOI:10.1016/J.MSSP.2015.01.013.
- B. H. Liu, S. H. Yu, S. F. Chen and C. Y. Wu, J. Phys. Chem. B, 2006, 110(9), 4039–4046, DOI:10.1021/JP055970T.
- J. T. Mehrabad, M. Aghazadeh, M. G. Maragheh, M. R. Ganjali and P. Norouzi, Mater. Lett., 2016, 184, 223–226, DOI:10.1016/J.MATLET.2016.08.069.
- T. Zhao, H. Jiang and J. Ma, J. Power Sources, 2011, 196(2), 860–864, DOI:10.1016/J.JPOWSOUR.2010.06.042.
- A. Riaz, F. Shaheen, M. Alam, M. Tanveer, Q. ul Aain and G. Nabi, Mater. Sci. Semicond. Process., 2024, 176, 108311, DOI:10.1016/J.MSSP.2024.108311.
- F. Zhang, C. Yuan, X. Lu, L. Zhang, Q. Che and X. Zhang, J. Power Sources, 2012, 203, 250–256, DOI:10.1016/J.JPOWSOUR.2011.12.001.
- R. Xu and H. C. Zeng, J. Phys. Chem. B, 2003, 107(46), 12643–12649, DOI:10.1021/JP035751C.
- H. He, Y. Lei, S. Liu, K. Thummavichai, Y. Zhu and N. Wang, J. Colloid Interface Sci., 2023, 630, 140–149, DOI:10.1016/J.JCIS.2022.10.004.
- J. A. Fuentes-García, B. Sanz, R. Mallada, M. R. Ibarra and G. F. Goya, Mater. Des., 2023, 226, 111615, DOI:10.1016/J.MATDES.2023.111615.
- W. Huang, B. Hai, G. Su, H. Mao and J. Li, Mater. Lett., 2024, 360, 135976, DOI:10.1016/J.MATLET.2024.135976.
- S. Sun, C. Zhang, M. Ran, Y. Zheng, C. Li, Y. Jiang and X. Yan, Int. J. Hydrogen Energy, 2024, 63, 133–141, DOI:10.1016/J.IJHYDENE.2024.03.179.
- L. Hong, Z. Liu, X. Zhang, Y. Xue, H. Huang, Q. Jiang and J. Tang, J. Alloys Compd., 2024, 991, 174238, DOI:10.1016/J.JALLCOM.2024.174238.
- B. Cao, C. Luo, J. Lao, H. Chen, R. Qi, H. Lin and H. Peng, ACS Omega, 2019, 4(15), 16612–16618, DOI:10.1021/ACSOMEGA.9B02504.
- X. Leng, K. H. Wu, Q. Zeng, I. R. Gentle and D. W. Wang, Asia-Pac. J. Chem. Eng., 2016, 11(3), 415–423, DOI:10.1002/APJ.2005.
- M. C. Sung, G. H. Lee and D. W. Kim, J. Alloys Compd., 2019, 800, 450–455, DOI:10.1016/J.JALLCOM.2019.06.047.
- F. Sun, L. Li, G. Wang and Y. Lin, J. Mater. Chem. A, 2017, 5(15), 6849–6859, 10.1039/C6TA10902K.
- N. P. Dileep, T. V. Vineesh, P. V. Sarma, M. V. Chalil, C. S. Prasad and M. M. Shaijumon, ACS Appl. Energy Mater., 2020, 3(2), 1461–1467, DOI:10.1021/ACSAEM.9B01901/SUPPL_FILE/AE9B01901_SI_001.PDF.
- B. Rezaei, A. R. T. Jahromi and A. A. Ensafi, Int. J. Hydrogen Energy, 2017, 42(26), 16538–16546, DOI:10.1016/J.IJHYDENE.2017.05.193.
- F. Lyu, Y. Bai, Q. Wang, L. Wang, X. Zhang and Y. Yin, Dalton Trans., 2017, 46(32), 10545–10548, 10.1039/C7DT01110E.
- X. Leng, K. H. Wu, Q. Zeng, I. R. Gentle and D. W. Wang, Asia-Pac. J. Chem. Eng., 2016, 11(3), 415–423, DOI:10.1002/APJ.2005.
- M. Gao, W. Sheng, Z. Zhuang, Q. Fang, S. Gu, J. Jiang and Y. Yan, J. Am. Chem. Soc., 2014, 136(19), 7077–7084, DOI:10.1021/JA502128J/SUPPL_FILE/JA502128J_SI_002.AVI.
- A. M. Pisoschi, A. Pop, A. I. Serban and C. Fafaneata, Electrochim. Acta, 2014, 121, 443–460, DOI:10.1016/J.ELECTACTA.2013.12.127.
Footnote |
| † Electronic supplementary information (ESI) available. See DOI: https://doi.org/10.1039/d4ra04240a |
| This journal is © The Royal Society of Chemistry 2024 |

