 Open Access Article
Creative Commons Attribution 3.0 Unported Licence
Greener and whiter analytical method development and validation for determining the presence of zolpidem tartrate infused in apple juice using RP-HPLC via magnetic solid-phase extraction followed by LC-MS confirmatory analysis†
Revathy Sundara Moorthy a,
G. Swethaa,
Rohini Rondlab,
Anren Hu*c,
Narmada Vallakeerthid and
P. Muralidhar Reddy
 *a
*a
aDepartment of Chemistry, University College of Science, Osmania University, Tarnaka, Hyderabad, Telangana 500007, India. E-mail: pmdreddy@gmai.com
bDepartment of Chemistry (H & S), Vidya Jyothi Institute of Technology, Aziz Nagar Gate, Hyderabad, Telangana 500075, India
cDepartment of Laboratory Medicine and Biotechnology, Tzu Chi University, Haulien 97004, Taiwan
dDepartment of Pharmacy, University College of Technology, Osmania University, Hyderabad 500007, Telangana, India
First published on 4th September 2024
Abstract
The research work entails a newly developed RP-HPLC method, aimed at analyzing the modern date rape drug, zolpidem tartrate (ZT), infused in apple juice matrix. The work relies on dispersive solid-phase extraction (DSPE) with polyethylene imine (PEI)-coated magnetic nanoparticles to preconcentrate zolpidem from the matrix, in the presence of trifluoroacetic acid (TFA) for matrix isolation, for the first time. The optimized conditions emphasize the use of an environmentally preferable mobile phase [methanol: 0.5% acetic acid (60![[thin space (1/6-em)]](https://www.rsc.org/images/entities/char_2009.gif) :
:![[thin space (1/6-em)]](https://www.rsc.org/images/entities/char_2009.gif) 40% v/v; pH 2.50)] at a 1 ml min−1 flow rate, employed with a Platisil Octa-Decyl Silane (ODS) column (250 × 4.6 mm; 5 μm). Further, the validated results were confirmed to be within the ICH guidelines, marking the method demonstrated to be linear (R2 = 0.9988; 0.9957), robust (% RSD below 1), sensitive (LOD = 1.8 μg ml; LOQ = 6 μg ml−1), precise and accurate (% recovery = 92–120%). Following the same conditions, a confirmatory analysis of zolpidem was accomplished using LC-MS, verifying the method's suitability notably, with good peak resolution, less matrix interference and a confirmation of the presence of zolpidem using mass spectrometry. The recycling ability of the PEI@SiO2@Fe3O4 nanoparticles was also assessed. To determine the sustainability of the proposed work, a greener and whiter assessment has been carried out in a comparative mode with previous similar works. For green tools, the recently developed AGREE software was utilized for assessing the method's greeness and it demonstrated a good green score of 0.68, supported by method assessment using ComplexGAPI software. For the assessment of the method's blue principles, the latest software utilizing the blue applicability grade index (BAGI) was applied, resulting in a decent score of 62.5. To consider sustainability, the RGB methodical software in its latest version the RGBfast model, was incorporated in the study for furnishing a balance of the three different major principles (Red–Green–Blue) and for assessing a check on sustainability of the current method compared to similar previously established proposed works.
40% v/v; pH 2.50)] at a 1 ml min−1 flow rate, employed with a Platisil Octa-Decyl Silane (ODS) column (250 × 4.6 mm; 5 μm). Further, the validated results were confirmed to be within the ICH guidelines, marking the method demonstrated to be linear (R2 = 0.9988; 0.9957), robust (% RSD below 1), sensitive (LOD = 1.8 μg ml; LOQ = 6 μg ml−1), precise and accurate (% recovery = 92–120%). Following the same conditions, a confirmatory analysis of zolpidem was accomplished using LC-MS, verifying the method's suitability notably, with good peak resolution, less matrix interference and a confirmation of the presence of zolpidem using mass spectrometry. The recycling ability of the PEI@SiO2@Fe3O4 nanoparticles was also assessed. To determine the sustainability of the proposed work, a greener and whiter assessment has been carried out in a comparative mode with previous similar works. For green tools, the recently developed AGREE software was utilized for assessing the method's greeness and it demonstrated a good green score of 0.68, supported by method assessment using ComplexGAPI software. For the assessment of the method's blue principles, the latest software utilizing the blue applicability grade index (BAGI) was applied, resulting in a decent score of 62.5. To consider sustainability, the RGB methodical software in its latest version the RGBfast model, was incorporated in the study for furnishing a balance of the three different major principles (Red–Green–Blue) and for assessing a check on sustainability of the current method compared to similar previously established proposed works.
1. Introduction
Recently, a gradual shift has been observed in the medical field related to the move away from the use of common and highly sedative drugs to new sedative hypnotics. The predominant benzodiazepines function in a non-selective way by binding to both omega-1 and -2 receptor sites but pose more side effects and a greater risk of dependence. Hence, to reduce drug abuse, side effects, and dependence on these drugs, a new class of drugs, i.e., non-benzodiazepines, especially Z-drugs, has been developed and brought to the medical market.1–4 Among the non-benzodiazepines, an imidazopyridine derivative, namely zolpidem (ZM), has attracted much attention over others in consideration of its selective interaction with the omega-1 receptor alone.5,6 In spite of their medical benefits, their various properties, such as quick action together with causing hallucinations and anterograde amnesia, have seen increasing misuse, particularly triggering their use in drug-facilitated crimes and more seldom in sexual assault cases.7,8 Zolpidem, as the most prescribed antipsychotic medication, has become a key focus due to its increasing misuse as criminals can easily slip the zolpidem into beverages to allow them to perpetrate various crimes, including robbery, drug-facilitated sexual assault (DFSA), and kidnapping.9–11 A temporal study has also been reported on zolpidem medication towards the risk of suicide.12 In view of the recent concerns over zolpidem-associated crimes, zolpidem has become a key focus of study.The previous literature includes reports on the extraction, method development, and determination of zolpidem tartrate (ZT) and other similar drugs in different biological fluids13–18 and hair.19–23 Further reports have focused on the detection of the most common narcotics and sedatives24 in food matrices, like chocolate, cream biscuits, cold drinks,25–28 and water samples.29 Some recent comparable works include one on patulin contaminant identification in apple juice via LLE extraction using an LC-MS/MS analytical method,30 while another reported a method for ZT detection in human plasma via a dispersive liquid microextraction method with HPLC-PDA (photodiode array).31 Though there are similar classes of works, there are no reports of zolpidem detection in edible matrices. Hence, to the best of our knowledge, the current work is new and was performed for the first time in the field of analytical chemistry.
To develop greener yet efficient economical extraction procedures, solid-phase extraction (SPE) has drawn favorable attention among researchers, notably in the analytical field. Among the different SPE methods, dispersive solid-phase extraction (DSPE), especially using magnetic nanoparticles (MNPs) as in magnetite solid-phase extraction (MSPE), has been proven to be beneficial due to its simple separation process. The isolation principle works via various physicochemical interactions, such as electrostatic force, hydrogen bonding, π–π interactions, and covalent or ionic bonding. In consideration with this principle, the surface modification of MSPE can be done depending on the type of analytes considered for isolation.32 The rationale for choosing MSPE is that it can reduce the typical large solvent usage, matrix interferences, time consumption, and can replace centrifugation by magnetic isolation;33,34 thereby, reducing the time, energy, and labor needed, while also being more specific as well as recyclable.35,36 For efficiently precipitating proteins, sugars, and carbs, TFA is a popular choice in extraction as it is strongly acidic in nature, due to the presence of the highly electronegative fluorine in its structure.37–39 Various literature works have reported the use of MNPs. For instance, Reddy P. M. et al. reported the use of PEI@SiO2@Fe3O4 nanoparticles (NPs) in capturing Gram-positive and Gram-negative bacteria with good efficiency and a detection limit of 104 CFU ml−1.40
The current study concerns a new magnetic dispersive solid-phase extraction procedure, preceded by method optimization and validation of the presence of zolpidem tartrate (ZT) infused in apple juice, with the aid of reverse phase high-performance liquid chromatography (RP-HPLC). To prove the sustainability of the newly developed method, a green and white assessment was carried out.
Although in DFC and DFSA crimes, biological samples play a crucial role in identification, there remains a constraint of its use to within a specified period of time. It is not feasible all the time to work with biological samples, as gaps or delays in reporting, collection, and analysis may become an obstacle to accurate results and identification.41,42 There is also a growing need to analyze for drugs in food drinks used in crimes. Though there are many cases reported of the use of date rape drugs or other narcotic-related drugs in food and drink matrices, the analysis of such matrices has received limited attention in the research field. Cold drinks and fruit juices are some of the possible matrices that carry a risk of the intentional infusion of drugs.43–46 In the present study, as a common and easily available flavor and drink, apple juice was chosen for study. Despite zolpidem-infused apple juice cases not being specifically reported, forensic cases are always unanticipated, providing new challenges every time. Hence the method can also be applicable for similar matrices too.
In order to achieve an environmentally friendly method, recent green software, such as the Complementary Green Analytical Procedure Index (Complex-GAPI)47 and Analytical GREEnness metric approach (AGREE),48 have been developed to create awareness about solvent consumption and the nature of the resources used as well as to caution about the use of toxic reagents. Further, white assessments are now also gaining ground in analytical chemistry. This method additionally incorporates a “red” evaluation for proving the reliability of a proposed method, and “blue” evaluation depicting the practicality of a method besides a “green” evaluation. The assessment can be done by using the Red–Green–Blue (RGB) fast model,49 a latest version of the RGB model with advancements. In addition, very recent blue assessment software utilizing the blue applicability grade index (BAGI)50 has been developed. There are few recent reports on comparative studies including green and white assessments of different methodologies for the same and similar drugs.51,52 Further, these comparative studies could aid in the easy differentiation of suggested work to previously reported ones, by providing each method's greenness, analytical performance, and their practicality for comparison. A comparative study was also performed for the present work, and the findings suggest that the current work abides by many parameters matching the green, red, and blue principles.
In view of its sensitivity, simplicity, easy availability, economic nature, and moderate energy consumption, HPLC53,54 was chosen for the method development and validation in the current work. To make the study more valid, a confirmatory analysis was performed using LC-MS.55 This offers certain advantages, such as better resolution, ability for structural elucidation, and effective elemental analysis, allowing an accurate qualitative assessment of the presence of zolpidem through extraction under newly developed conditions. Further, by accounting the instrument's short availability, high energy and cost consumption the LC-MS was applied for confirmatory analysis and not for method development, while method development and validation was performed through RP-HPLC.56
2. Experimental section
2.1. Chemicals used
The chemicals used were generally reagent grade as obtained from commercial sources. Zolfresh®10 tablets with 10 mg of zolpidem tartrate were acquired from Abbott (Himachal Pradesh, India). The iron salts ferric chloride hexahydrate with a purity of 98% and ferrous chloride with a purity of 98.5% were purchased from Molychem (Mumbai, India) and Avra (Mumbai, India), respectively. Ammonia solution 0.91 d with 25% purity was acquired from Finar (Ahmedabad, India). APTES (3-aminopropyl-triethoxysilane) reagent with a purity of 98% was purchased from Spectrochem. All the solvents used, such as ethanol with 98% purity purchased from TCI (Hyderabad, India) and toluene, were of analytical grade. The reagents polyethylene imine (PEI) and tetraethyl orthosilicate (TEOS) with a purity of 98% were purchased from TCI (Hyderabad, India). Hydrochloric acid (HCl) with 32% purity was purchased from Avra Chemicals. HPLC-grade methanol with a purity of ≥99.9% was obtained from Honeywell (New Delhi, India) and water was from Finar (Ahmedabad, India) with ≥99.9% purity. Trifluoroacetic acid (TFA) with a purity of 99% was purchased from Sisco Research Laboratory (New Mumbai, India). Acetic acid (Glacial) (≥99.7% purity) was procured from Qualigens (Mumbai, India). Apple juice (Paper boat) (Haryana, India) for the matrix was purchased from the supermarket.2.2. Instrumentation
High-performance liquid chromatography (HPLC) was performed using a Waters Alliance 2690 HPLC system (USA) equipped with a Waters 996 photodiode array (PDA) detector. Ultraviolet-visible spectroscopy (UV-vis) was used for the preliminary analysis using a Shimadzu-UV 2600 (Japan) system. Fourier transform infrared spectrophotometry (FTIR) was performed on a Shimadzu – IRPrestige-21 system (Japan). X-Ray diffraction (XRD) was performed on a Rigaku Smart Lab system equipped with SmartLab Studio II software (Japan). Scanning electron microscopy and energy-dispersive X-ray analysis (SEM-EDX) was carried out on a Zeiss EVO LS15 instrument equipped with a field emission source (Germany). Transmission electron microscopy (TEM) was performed with a Tecnai 12 system (FEI, Netherlands). Zeta analysis was performed with a Beckman Coulter's Delsa Max Pro system (USA).2.3. Synthesis of Fe3O4 nanoparticles and functionalization with PEI-coated Fe3O4 nanoparticles
The Fe3O4 nanoparticles were synthesized through a co-precipitation method as reported in our previous literature. The synthesis procedure has already been used by our research group with few modifications. In brief, ferric and ferrous salts were dissolved in HCl in a round-bottom flask and placed under a nitrogen gas set-up, to maintain an inert atmosphere, resulting in an orangish brown precipitate. The reaction was performed at room temperature under stirring using a magnetic stirrer for 6 h. Subsequently, the Fe3O4 NPs synthesis was initiated via the addition of 25% aqueous NH3 solution, as confirmed by the black coloration of the resultant solution.57The silica coating was obtained by re-suspending Fe3O4 NPs in 200 ml ethanol and adding 5 ml TEOS reagent and then refluxed. Further, SiO2@Fe3O4 NPs were re-suspended in 100 ml double-distilled water and stirred gently for about 8 h upon the addition of PEI reagent as reported, to obtain PEI@SiO2@Fe3O4 NPs.31,58 In order to obtain APTES@Fe3O4 NPs, reflux with methanol and toluene at a ratio of 30![[thin space (1/6-em)]](https://www.rsc.org/images/entities/char_2009.gif) :
:![[thin space (1/6-em)]](https://www.rsc.org/images/entities/char_2009.gif) 70 was performed by re-suspending the Fe3O4 NPs. The reflux was performed at 110 °C along with 5 ml of APTES reagent. After 20 h of reflux, the resulting suspension was washed and dried in a hot air oven.
70 was performed by re-suspending the Fe3O4 NPs. The reflux was performed at 110 °C along with 5 ml of APTES reagent. After 20 h of reflux, the resulting suspension was washed and dried in a hot air oven.
2.4. Preliminary examination
1 ml of 100 μg ml−1 standard solution was pipetted to 1 ml of apple juice in seven different 10 ml centrifuge tubes. Different media, i.e., acetic acid, 0.5 N HCl, 1 N HCl, 0.5% TFA, 1.5% TFA, were added to the respective centrifuge tubes, followed by extraction using the PEI@SiO2@Fe3O4 NPs and analysis by HPLC.
2.5. Optimization of the PEI@SiO2@Fe3O4 nanoparticle concentration
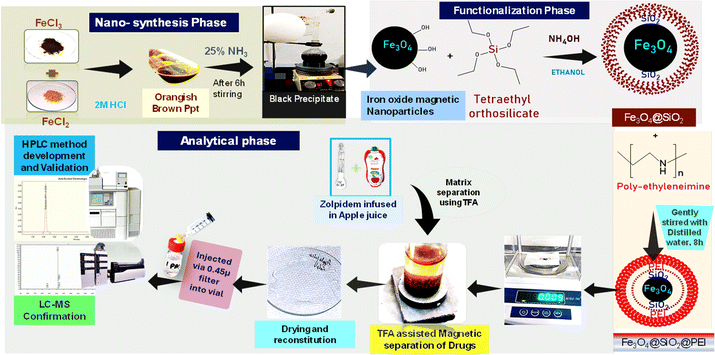 | ||
| Scheme 1 Schematic representation of the newly developed zolpidem extraction process, method development and validation by RP-HPLC. | ||
The reusability of the PEI@SiO2@Fe3O4 NPs was also analyzed by UV-vis spectroscopy for the zolpidem extraction.
2.6. Method development
The analysis was performed with a Waters HPLC system equipped with an in-line degasser, a quaternary pump system, an autosampler, and a PDA detector. The analyte separation was accomplished using a reverse phase (RP) platisil column. According to the physiochemical properties of ZT, the maximal solubility was considered to develop a mobile phase composition. The other parameters, such as flow rate, temperature, and pH, were assessed based on the optimization tests for the method development. Finally, the optimized conditions, given below in Table 1, were applied in the further experiments for the further analysis and validation.| Column | Platisil column |
| C18 octadecyl-silica (ODS) | |
| 250 × 4.6 mm; 5 μm | |
| Flow rate | 1 ml min−1 |
| Mobile phase | Solvent A – methanol |
| Solvent B – 0.5% acetic acid (in water) | |
| Gradient | Isocratic gradient – 60![[thin space (1/6-em)]](https://www.rsc.org/images/entities/char_2009.gif) : :![[thin space (1/6-em)]](https://www.rsc.org/images/entities/char_2009.gif) 40 40 |
| Column temperature | 25 °C |
| Injection volume | 20 μl |
| Detector | PDA (photodiode array) – UV detector |
| Wavelength (λmax) | 294.6 nm |
| Run time | 10 min |
2.7. Method validation
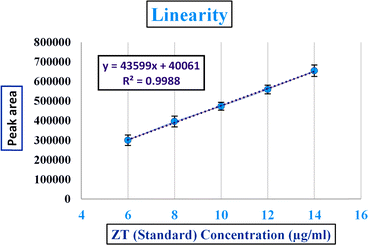
After the method development, the validation for the method was performed as specified by the ICH guidelines (International Conference on Harmonization of Technical Requirements for the Registration of Pharmaceuticals for Human Use)59,60 and Food and Drug Administration (FDA)61 guidelines. The following parameters with respect to validation were tested by HPLC: selectivity and specificity tests were performed using a blank, standard, and sample. Linearity assessment was performed from a concentration of 6 to 14 μg ml−1 in three replicas and plotted to calculate the correlation coefficient (R2).Both the limit of detection (LOD) and limit of quantification (LOQ) were calculated through the signal to noise ratio compared to the blank using the following formula:
where h is the height of the chromatogram peak and n is the noise.
2.8. LC-MS confirmation
Analysis of a 10 ppm standard zolpidem tablet formulation, and the extracted zolpidem from the apple juice matrix, was performed using an Agilent 1260 Infinity II prime LC system (USA) with an MSD iQ detector for LC-MS analysis. This was done under the chromatographic conditions used for method validation with HPLC. An electrospray ionization interface (ESI) was used in the instrument, while the MS conditions are detailed in Table 2.| Capillary current | 4500–4600 Amp |
| Capillary voltage | 3440–3460 V |
| Nebulizer | 60 Psi |
| Gas temperature | 350 °C |
| Gas flow | 13 ml min−1 |
| Scanning time | 2 ms |
3. Results and discussion
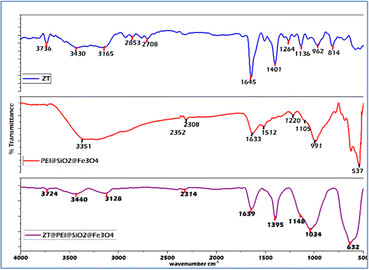
The work proposes the use of PEI@SiO2@Fe3O4 NPs for the efficient extraction of zolpidem from apple juice matrix with low matrix interference. Characterization of the PEI@SiO2@Fe3O4 NPs was performed to ensure the functionalization of silica, PEI, as well as to assess the physiochemical properties, using FTIR as in Table S2† and the zeta potential as in Fig. S1.† Morphological characterization was done using SEM-EDX as shown in Tables S3 and S4,† and TEM as in Table S4,† as reported in the previous literature.40 From the TEM, the diameter of the Fe3O4 NPs was ∼15 nm, while that of the PEI@SiO2@Fe3O4 NPs was ∼18 nm. For the zeta potential, there was a change observed from the negative surface charge of SiO2@Fe3O4 NPs to a positive surface charge, indicating the coating of PEI, as reported in the ESI in Fig. S1.†FTIR analysis was performed as shown in Fig. 1 for the pure ZT, pure PEI@SiO2@Fe3O4 NPs, and ZT-bound PEI@SiO2@Fe3O4 NPs to confirm their binding. For ZT, peaks for C–N, CH3, C![[double bond, length as m-dash]](https://www.rsc.org/images/entities/char_e001.gif) C, C
C, C![[double bond, length as m-dash]](https://www.rsc.org/images/entities/char_e001.gif) O, C
O, C![[double bond, length as m-dash]](https://www.rsc.org/images/entities/char_e001.gif) N, and C–H groups were observed at ∼1140, ∼1260, ∼1403; 1510, ∼1648, 1720, and ∼2709 cm−1, respectively. For C–N stretching related to the imidazopyridine ring, a characteristic band at ∼3135 and 3431 cm−1 was noticed.62 The PEI@SiO2@Fe3O4 NPs showed a characteristic band at ∼537 cm−1, due to the stretching vibration of Fe–O bond. For Fe3O4@SiO2 bonding, the vibration bands were noticed at ∼1105, 1220, and ∼991 cm−1 depicting the silanol group (–Si–OH), siloxane bond in the backbone (–Si–O–Si), and free silanol group, respectively.63,64 Additionally, apart from these, the PEI coating was confirmed by the characteristic peak at ∼1633 cm−1 for N–H bending, a broad band at 2847 cm−1 for CH2 asymmetric and symmetric stretching of the PEI chain, and 3351 cm−1 for amine group stretching,65,66 as shown in Fig. 1. In ZT@PEI@SiO2@Fe3O4 NPs, characteristic bands at ∼632, 1034, and 3440 cm−1 confirmed the presence of PEI@SiO2@Fe3O4 NPs presence, which were absent in the ZT FTIR spectrum. Further, a peak at 1638 cm−1 due to the presence of N–H bending was noticed for PEI@SiO2@Fe3O4 NPs. For ZT@PEI@SiO2@Fe3O4 NPs, the peaks at 1148 and 1395 cm−1 peak were related to C
N, and C–H groups were observed at ∼1140, ∼1260, ∼1403; 1510, ∼1648, 1720, and ∼2709 cm−1, respectively. For C–N stretching related to the imidazopyridine ring, a characteristic band at ∼3135 and 3431 cm−1 was noticed.62 The PEI@SiO2@Fe3O4 NPs showed a characteristic band at ∼537 cm−1, due to the stretching vibration of Fe–O bond. For Fe3O4@SiO2 bonding, the vibration bands were noticed at ∼1105, 1220, and ∼991 cm−1 depicting the silanol group (–Si–OH), siloxane bond in the backbone (–Si–O–Si), and free silanol group, respectively.63,64 Additionally, apart from these, the PEI coating was confirmed by the characteristic peak at ∼1633 cm−1 for N–H bending, a broad band at 2847 cm−1 for CH2 asymmetric and symmetric stretching of the PEI chain, and 3351 cm−1 for amine group stretching,65,66 as shown in Fig. 1. In ZT@PEI@SiO2@Fe3O4 NPs, characteristic bands at ∼632, 1034, and 3440 cm−1 confirmed the presence of PEI@SiO2@Fe3O4 NPs presence, which were absent in the ZT FTIR spectrum. Further, a peak at 1638 cm−1 due to the presence of N–H bending was noticed for PEI@SiO2@Fe3O4 NPs. For ZT@PEI@SiO2@Fe3O4 NPs, the peaks at 1148 and 1395 cm−1 peak were related to C![[double bond, length as m-dash]](https://www.rsc.org/images/entities/char_e001.gif) C bonds in ZT, which were absent in the NPs, while distinctive broad peaks at 3128, 3440, and 3724 cm−1 were observed that were specific to imidazopyridine ring and undoubtedly confirmed the presence of ZT.
C bonds in ZT, which were absent in the NPs, while distinctive broad peaks at 3128, 3440, and 3724 cm−1 were observed that were specific to imidazopyridine ring and undoubtedly confirmed the presence of ZT.
The binding of ZM to PEI@SiO2@Fe3O4 NPs was also evidenced by UV spectroscopy and zeta potential analysis. In the zeta potential analysis, both ZT and PEI@SiO2@Fe3O4 NPs separately showed positive charges but after the binding of ZT to the PEI@SiO2@Fe3O4 NPs, there was a change in the zeta potential charge. Additionally, RP-HPLC analysis and LC-MS proved the binding and desorption of ZT from the nanoparticles with a confirmative mass peak.
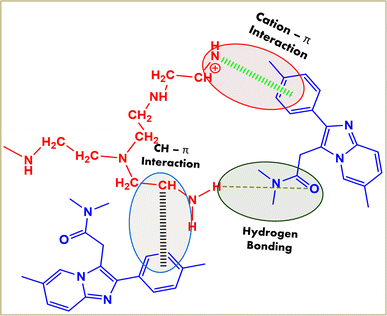
The possible binding mechanism involves hydrogen bonding, cation–π interactions between the NH2 of PEI and benzene group of ZM,67 and CH–π interactions between the CH2 group of PEI and benzene group of ZM,68 as illustrated in Fig. 2.
3.1. UV analysis
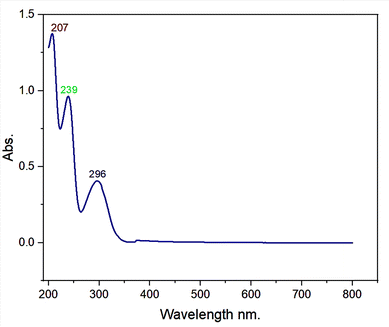
Here, 0.25 mg ml−1 of zolpidem was analyzed and the UV spectrum showed three maximum peaks at 207, 239 and 296 nm, as depicted in Fig. 3.3.2. Optimization of MNPs
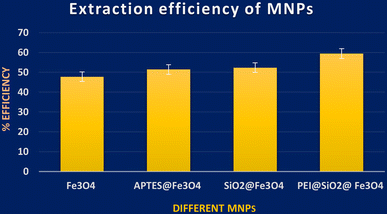
UV-vis spectroscopic analysis was performed for four different MNPs, in order to find the amount of ZT adsorbed by each MNP by calculating the remnant ZT concentration from the supernatant. From the analysis, among these NPs, PEI@SiO2@Fe3O4 NPs presented better efficiency for ZT extraction, as shown in Fig. 4. The concentration of PEI@SiO2@Fe3O4 NPs was also optimized at 9 mg ml−1 from assessing it in a range of 3–11 mg ml−1.3.3. Optimization of the precipitating medium
The extraction was carried out from apple juice with different pH media using HPLC under optimized conditions. It was proved 1.5% TFA was more efficient, and has low matrix interferences. While the other media, i.e., low acidic or basic concentrations, showed very low or low extraction efficiencies, with more matrix interferences, as depicted in Fig. 5. This could be because ZT is a basic drug and can be well extracted under acidic conditions. Moreover, TFA has a good ability to break complex sugars, eventually lowering the matrix effect. Henceforth, 1.5% TFA was utilized for the extraction procedure in the following experiments.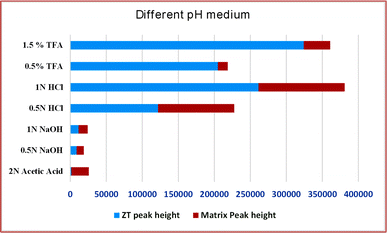 | ||
| Fig. 5 Graphical representation of the zolpidem extraction percentage and matrix effect at seven different pH media. | ||
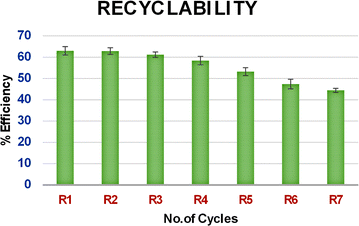
As shown in Fig. 6, on analysis of the recycling ability of PEI@SiO2@Fe3O4 NPs with the UV spectrum, the extraction efficiency showed a slight difference from the 4th cycle, and a marked difference from the 5th cycle with a 15% reduction.
3.4. Method development
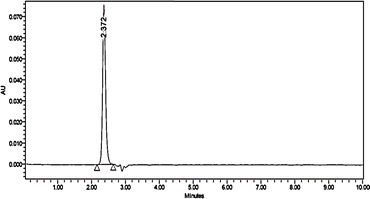
In several trials, a suitable condition for the analysis was tested to perform the ZT analysis, with details provided in Table 1. The run time was kept to 10 min for ±2.3 RT, in order to determine if there was any overlapping of the peaks during degradation, and the effect of matrix peaks and other impurities, if any. The data procured from the analysis were processed using Empower software. At a concentration of 10 μg ml−1, zolpidem in tablet form was analyzed, with the chromatogram showing the analysis was specific and selective; the system suitability parameters are given in Table 3, and the chromatograms are shown in Fig. 7.| System suitability parameters | ZT results |
|---|---|
| RT | 2.372 |
| Peak area | 473![[thin space (1/6-em)]](https://www.rsc.org/images/entities/char_2009.gif) 665 665 |
| USP plate count | 3715 |
| Tailing factor | 1.14 |
| Capacity factor (K) | 1.554 |
3.5. Method validation
![[thin space (1/6-em)]](https://www.rsc.org/images/entities/char_2009.gif) :
:![[thin space (1/6-em)]](https://www.rsc.org/images/entities/char_2009.gif) 1 and 10
1 and 10![[thin space (1/6-em)]](https://www.rsc.org/images/entities/char_2009.gif) :
:![[thin space (1/6-em)]](https://www.rsc.org/images/entities/char_2009.gif) 1 were calculated, respectively, from the blank, giving values of 1.8 μg ml−1 for the LOD and 6 μg ml−1 for LOQ, whose chromatograms are shown in Table S7.†
1 were calculated, respectively, from the blank, giving values of 1.8 μg ml−1 for the LOD and 6 μg ml−1 for LOQ, whose chromatograms are shown in Table S7.†
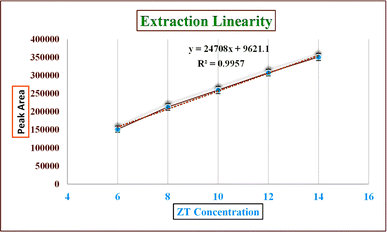 | ||
| Fig. 9 Extraction linearity of zolpidem from apple juice matrix in the 6 to 14 μg ml−1 concentration range. | ||
3.5.1.1. Adsorption capacity. The adsorption efficiency of PEI@ Fe3O4 NPs was assessed from the formula below ;69
where Q is the adsorption capacity, C0 is the actual concentration of zolpidem, Ce is the concentration after DSPE extraction, V is the volume of sample, and m is the weight of nanoparticles in mg. The adsorption capacity was calculated from the actual concentration to that of the MNP-extracted ZT concentration in percentage form, in the 6–14 μg ml−1 concentration range. The adsorption capacity was found to be around 50% to 57%.
| Concentration (μg ml−1) | Inter-day precision | Intra-day precision | ||
|---|---|---|---|---|
| Conc. found (μg ml−1 ± SD) | % RSD | Conc. found (μg ml−1 ± SD) | % RSD | |
| 10 (100%) | 11.31 ± 0.14 | 1.26 | 11.97 ± 0.20 | 1.68 |
| Concentration (μg ml−1) | Conc. Found (μg Ml−1 ± SD) | % recovery | % RSD |
|---|---|---|---|
| 5 (50%) | 4.9 ± 0.04 | 102.43 ± 2.11 | 0.77 |
| 10 (100%) | 10.25 ± 0.08 | 101.62 ± 4.2 | 0.70 |
| 15 (150%) | 15.55 ± 0.02 | 102.22 ± 4.4 | 0.13 |
| Mobile phase composition variation | ||||||
|---|---|---|---|---|---|---|
| Concentration | Results | |||||
| Actual | Varied | Level of variation | Conc. found (μg ml−1 ± SD) | % RSD | ||
| 10 μg ml−1 | 60![[thin space (1/6-em)]](https://www.rsc.org/images/entities/char_2009.gif) : :![[thin space (1/6-em)]](https://www.rsc.org/images/entities/char_2009.gif) 40 40 |
66![[thin space (1/6-em)]](https://www.rsc.org/images/entities/char_2009.gif) : :![[thin space (1/6-em)]](https://www.rsc.org/images/entities/char_2009.gif) 34 34 |
+ 10% | 11.24 ± 0.02 | 0.15 | 2.2 |
60![[thin space (1/6-em)]](https://www.rsc.org/images/entities/char_2009.gif) : :![[thin space (1/6-em)]](https://www.rsc.org/images/entities/char_2009.gif) 40 40 |
0 | 11.34 ± 0.06 | 0.50 | 2.4 | ||
54![[thin space (1/6-em)]](https://www.rsc.org/images/entities/char_2009.gif) : :![[thin space (1/6-em)]](https://www.rsc.org/images/entities/char_2009.gif) 46 46 |
−10% | 11.12 ± 0.04 | 0.37 | 2.5 | ||
![[thin space (1/6-em)]](https://www.rsc.org/images/entities/char_2009.gif) |
||||||
| Flow rate variation | ||||||
| 10 μg ml−1 | 1 ml min−1 | 1.2 ml min−1 | + 0.2 units | 10.09 ± 0.02 | 0.18 | 2.15 |
| 1 ml min−1 | 0 | 11.34 ± 0.06 | 0.50 | 2.4 | ||
| 0.8 ml min−1 | −0.2 units | 12.30 ± 0.08 | 0.63 | 2.6 | ||
![[thin space (1/6-em)]](https://www.rsc.org/images/entities/char_2009.gif) |
||||||
| Wavelength variation | ||||||
| 10 μg ml−1 | 294.6 nm | 299.6 nm | + 5 nm | 11.24 ± 0.02 | 0.15 | 2.2 |
| 294.6 nm | 0 | 11.34 ± 0.06 | 0.50 | 2.4 | ||
| 289.6 nm | −5 nm | 11.12 ± 0.04 | 0.37 | 2.5 | ||
3.6. Green and white assessment
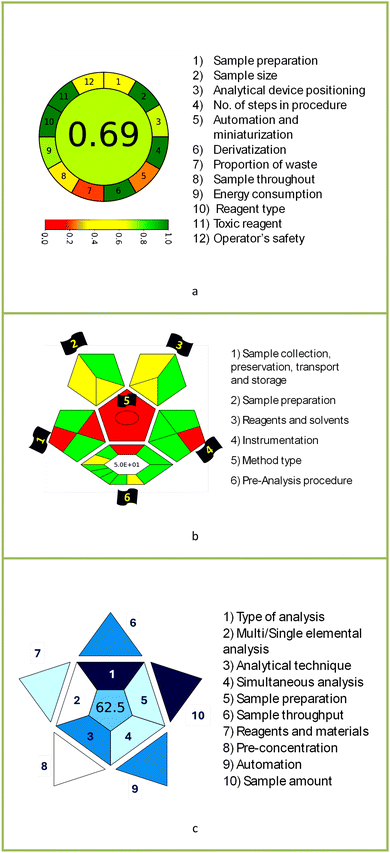
Evaluation of green and white principles was performed for the newly developed method for the identification and quantification of zolpidem tartrate, as portrayed in Table 7 and in comparison to previously reported methods, as shown in Table 8.The AGREE software depicts the greenness of each of 12 Green Analytical Chemistry (GAC) principles in metric format, i.e., between 0 to 1. As shown in Table 7a, the current method had an overall score of 0.69, reflecting the method's greenness as per the software, where an acceptable score is above 0.50. From Table 7a, the highest score of one was noticed with the number 2, 4, 6, 10, and 11 principles, highlighting the method's low energy consumption, minimal sample size, and omission of derivatizing or toxic reagents. A score of 0.6 was allotted to principles 3, 9, and 12, and a score of ∼0.5 for 1 and 8. The lowest scores were for 5 and 7.48,76 In Table 7b, the Complex-GAPI scores are given, which is a well referenced tool that can be used to easily describe a method's green nature by assessing the solvent/reagents used, amount of wastage, and consumption, along with a pre-analysis for comparison to allow appropriately interpreting the method's output. The pictogram for the current method showed more green shades due to the lack of storage, recyclability, slightly lower power consumption, and better NFPA score, while a few red shades could be observed due to the extraction procedure and waste production, which was unexceptional overall.47
BAGI is a primary tool that focuses on blue principles. It measures a method against applicability and practicality criteria, while displaying the result in an asteroid pictogram form along with a metric score. For the current method, a bluer compliance with a score of 62.5 was obtained, as shown in Table 7c, highlighting the method's economic, applicable, and practical potential using the common instrument HPLC, along with its quite good sample throughput, and low sample amount requirement. The need for a preconcentration step and nanoparticles lower the score, but these steps are common in SPE extraction procedures. Nevertheless, on the whole, the method reached the software criterion of a score higher than 60 to show the method has acceptable applicability.50
Comparing the current work to previously reported methods, the current work was proven to be greener. This was partly due to the reason that most of the reported methods use high-energy-requiring instrumentation, such as LC-MS/MS or GC-MS/MS or even both. Further, the use of harmful solvents, such as acetonitrile, chloroform, and hexane in these works is explicitly avoided in our current work. Also, most methods do not carry or involve recycling processes, which also benefits greenness. Further, energy conservation, recyclability, and the use of environmentally preferable solvents are a few of the 12 green principles, which were missing in previous methods that had scores below 0.5 (not green) or classed as a slightly greener method according to AGREE, as shown in Table 8. The same criteria exist for Complex-GAPI, where an extra red shade of color apart from the current method, was seen in many aspects, i.e., in the energy consumption part, recycling, storage, and a few other criteria, for the previously reported methods, as clearly depicted in Table 8.
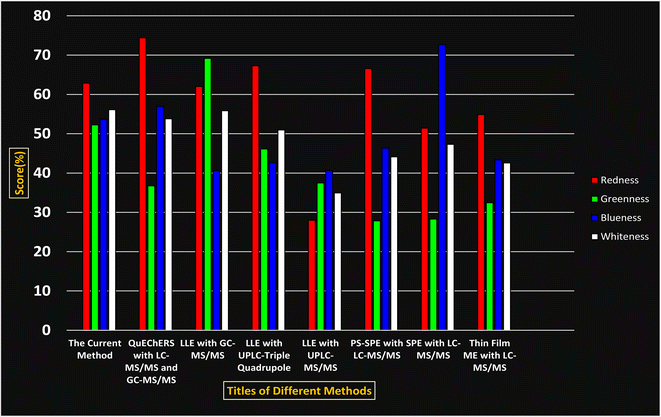
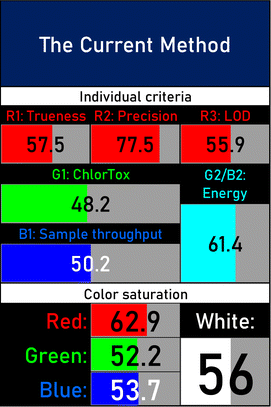
A comparative study was performed between the current method and similar previous literature works. In this version, the balance is shown among the works in the comparative mode, rather than mentioning a particular work as greener or whiter. From the assessment, as shown in Fig. 10, there are few methods proving better green scores than others. The best green score was for ‘LLE with GC-MS/MS method’, as shown in Fig. S7b,† as it used a low solvent volume and instead used gas as the mobile phase, but it had a lower blue score because of its higher energy requirement. A high blue score was noticed in the SPE with LC-MS/MS method, as shown in Fig. S7f,† because of its comparatively higher sample throughput, whereas, it secured the lowest green score because of using more chemicals and solvents, especially for SPE preparation. A good red score was observed for the QuEChERS approach using the LC-MS/MS and GC-MS/MS method, as shown in Fig. S7a,† due to its better sensitivity, and other performance parameters, but it had a reduced green score due to the usage of both high energy consuming instruments and greater solvent consumption. Detailed scores for all the comparative methods for each principle are provided in the ESI, Fig. S7.† Now, approaching the current method, that has slightly increased red score to that of green, and blue score. Nevertheless, overall, a good white score (56%) has been obtained as in Fig. 11, which is a better score in comparison to other similar works.
3.7. LC-MS confirmation
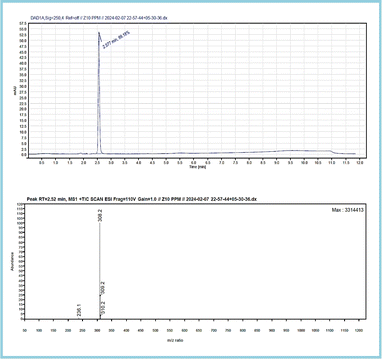
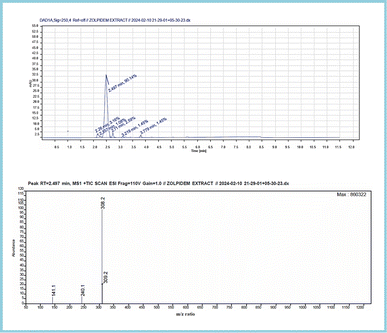
The analysis resulted in a chromatogram that reflected RTs at 2.527 and 2.497 corresponding to the ZT tablet and ZT extraction from apple juice matrix. In the extraction chromatograms, there were very few matrix interferences noticed.The mass spectra of both displayed a molecular ion peak at m/z 308 formed due to (M + 1) fragmentation. A further fragmentation eliminated the lateral groups, such as amide and carbonyl moiety,79 providing peaks at m/z 236 and 240. The complete chromatogram and MS spectra are shown in Fig. S2–S6,† 12 and 13.
4. Conclusion
In this research study, we successfully applied PEI@SiO2@Fe3O4 NPs for the extraction of zolpidem from apple juice matrix, for the first time. Moreover, a new method was optimized and validated for zolpidem, with the aid of RP-HPLC. The results obtained demonstrated the adequate sensitivity, robustness, accuracy, and linearity of the proposed method, as the values were within the ICH guidelines, as also evidenced through the RGBfast model for a red assessment. Ultimately, for better resolution, accurate confirmation, and better understanding of the matrix presence, LC-MS was also performed and proved the presence of zolpidem from the extraction through the mass spectrum, while the effect of the matrix was minimal with good resolution in the LC chromatogram. The greenness and whiteness of the newly proposed method were ascertained by the Complex-GAPI system, resulting in more greener shades, while AGREE software was with a good green score of 0.68 in green assessment. Meanwhile, the BAGI score of 62.5% under consideration of the blue principle showed the methods' practicality and applicability. Ultimately, a white score of 56% was secured, via the RGBfast model, suggesting the method offered a quiet good balance of all three sustainability principles (Red, Green, and Blue). Additionally, these assessments were carried in comparison with other previously reported recent methods for zolpidem detection, which explicitly proved our current method to be better under green principle considerations and offered an overall good balance of RGB principles. Henceforth, further the current work can be applied for other types of fruit juice matrices, as the extraction procedure includes TFA, which can degrade sugars and proteins easily. Besides this, other drugs related to crime and abuse in different edible matrices can also be detected as a future potential application scope for the method.Data availability
The authors confirm that the necessary data are provided in the ESI file† for the related work. Further information or raw data, if required, will be provided upon a reasonable request to the corresponding author.Author contributions
Revathy Sundara Moorthy – conceptualization, investigation, formal analysis, methodology, validation, software, data curation, writing – original draft, resources. G. Swetha – conceptualization, supervision. Anren Hu – funding acquisition. P. Muralidhar Reddy & Rohini Rondla – supervision, project administration, writing – review & editing, resources. Narmada Vallakeerthi – resource.Conflicts of interest
There are no conflicts to declare.Acknowledgements
We show our sincere gratitude to the Head, Department of Chemistry, Osmania University and also Qualychrome Labs, Hyderabad for the instrumental and lab facilities. We are also pleased to thank UGC-SRF Fellowship programme (Ref no. 190520662958) for providing the financial support. Anren Hu would like to thank the Ministry of Science and Technology Council, Taiwan for supporting this research under contract number NSTC: 112-2113-M-320-001. Additionally, we thank Tzu Chi University and Tzu Chi hospital for their financial support of this work.Notes and references
- G. Darcourt, D. Pringuey, D. Sallière and J. Lavoisy, The safety and tolerability of zolpidem-an update, J. Psychopharmacol., 1999, 13, 81–93 CrossRef CAS PubMed.
- J. Whyte and R. Myers, Incidence of clinically significant responses to zolpidem among patients with disorders of consciousness: a preliminary placebo controlled trial, Am. J. Phys. Med. Rehabil., 2009, 88, 410–418 CrossRef PubMed.
- S. Darke, M. Deady and J. Duflou, Toxicology and characteristics of deaths involving zolpidem in New South Wales, Australia 2001-2010, J. Forensic Sci., 2012, 57, 1259–1262 CrossRef PubMed.
- S. M. Hanson, E. V. Morlock, K. A. Satyshur and C. Czajkowski, Structural Requirements for Eszopiclone and Zolpidem Binding to the γ-Aminobutyric Acid Type-A (GABAA) Receptor Are Different, J. Med. Chem., 2008, 51, 7243–7252 CrossRef CAS PubMed.
- A. C. Moffat, M. D. Osselton, B. Widdop and J. Watts, Clarke's Analysis of Drugs and Poisons, Pharmaceutical press, London, 2011, vol. 3 Search PubMed.
- M. G. Terzano, M. Rossi, V. Palomba, A. Smerieri and L. Parrino, New drugs for insomnia: comparative tolerability of zopiclone, zolpidem and zaleplon, Drug Saf., 2003, 26, 261–282 CrossRef CAS PubMed.
- L. Olson, Hypnotic hazards: adverse effects of zolpidem and other z-drugs, Aust. Prescr., 2008, 31, 9–146 Search PubMed.
- J. H. Tsai, et al., Zolpidem-induced amnesia and somnambulism: rare occurrences?, Eur. Neuropsychopharmacol., 2009, 19, 74–76 CrossRef CAS PubMed.
- G. Volonnino, et al., Z-Drugs and their use in Drug-Facilitated Crimes: a review of the literature, Clin. Term., 2023, 174, 451–468 CAS.
- G. Heide, K. Hjelmeland, G. W. Brochmann, R. Karinen and G. Høiseth, The Appearance, Taste, and Concentrations of Zolpidem Dissolved in Still Water and Carbonated Beverages, J. Forensic Sci., 2018, 63, 911–914 CrossRef CAS PubMed.
- B. Madea and F. Musshoff, Knock-out drugs: their prevalence, modes of action, and means of detection, Dtsch. Arztebl. Int., 2009, 106, 341–347 Search PubMed.
- C.-H. Cho, et al., Temporal association between zolpidem medication and the risk of suicide: A 12-year population-based, retrospective cohort study, Sci. Rep., 2020, 10, 4875 CrossRef CAS PubMed.
- D. C. Reddy, A. T. Bapuji, V. S. Rao, V. Himabindu and S. Ravinder, A rapid and highly sensitive UPLC-MS-MS method for the quantification of zolpidem tartrate in human EDTA plasma and its application to pharmacokinetic study, J. Chromatogr. Sci., 2012, 50, 538–546 CAS.
- K. Yamaguchi, H. Miyaguchi, K. Hirakawa, Y. Ohno and Y. Kanawaku, Qualitative analysis of zolpidem and its metabolites M-1 to M-4 in human blood and urine using liquid chromatography-tandem mass spectrometry, Forensic Toxicol., 2021, 39, 134–145 CrossRef CAS.
- J. An, L. Fan, X. Zhi and Z. Dong, Quantification of sedative-hypnotics in human urine and plasma via polystyrene-based solid phase extraction-LC-MS/MS analysis, J. Pharm. Biomed. Anal., 2023, 236, 115753 CrossRef CAS PubMed.
- F. Yang, K. Ma, Y. Cao and C. Ni, Improved liquid-liquid extraction by modified magnetic nanoparticles for the detection of eight drugs in human blood by HPLC-MS, RSC Adv., 2021, 11, 19874–19884 RSC.
- F. Yang, K. Ma, Y. Cao and C. Ni, Improved liquid–liquid extraction by modified magnetic nanoparticles for the detection of eight drugs in human blood by HPLC-MS, RSC Adv., 2021, 11, 19874–19884 RSC.
- R. H. Alremeithi, M. A. Meetani and S. A. Khalil, A validated gas chromatography mass spectrometry method for simultaneous determination of cathinone related drug enantiomers in urine and plasma, RSC Adv., 2016, 6, 80576–80584 RSC.
- R. Erne, L. Bernard, A. E. Steuer, M. R. Baumgartner and T. Kraemer, Hair Analysis: Contamination versus Incorporation from the Circulatory System—Investigations on Single Hair Samples Using Time-of-Flight Secondary Ion Mass Spectrometry and Matrix-Assisted Laser Desorption/Ionization Mass Spectrometry, Anal. Chem., 2019, 91, 4132–4139 CrossRef CAS PubMed.
- S. Y. Kim, N. H. Kwon, J. C. Cheong and J. Y. Kim, LC-MS/MS method for determining picogram-level of zolpidem and its main metabolites in hair using a zirconia-based sorbent, Talanta, 2021, 228, 122041 CrossRef CAS PubMed.
- J.-J. Ji, D. Xu, H. Yan, P. Xiang and M. Shen, Micro-segmental analysis of the entry pathway and distribution of zolpidem in hair from different scalp regions after a single dose, Front. Chem., 2023, 11, 1115247 CrossRef CAS PubMed.
- M. Poetzsch, A. E. Steuer, A. T. Roemmelt, M. R. Baumgartner and T. Kraemer, Single Hair Analysis of Small Molecules Using MALDI-Triple Quadrupole MS Imaging and LC-MS/MS: Investigations on Opportunities and Pitfalls, Anal. Chem., 2014, 86, 11758–11765 CrossRef CAS PubMed.
- K. Sasaki, et al., Incorporation of five common hypnotics into hair after a single dose and application to a forensic case of drug facilitated crimes, Forensic Sci. Int., 2021, 325, 110881 CrossRef CAS PubMed.
- Z. Tan, et al., Development and validation of the UPLC-MS method for simultaneous determination of six new psychoactive substances, RSC Adv., 2022, 12, 26704–26711 RSC.
- M. I. Chambers, B. Garosi and R. A. Musah, DART-MS Facilitated Quantification of Cannabinoids in Complex Edible Matrices-Focus on Chocolates and Gelatin-Based Fruit Candies, ACS Omega, 2023, 8, 14459–14469 CrossRef CAS PubMed.
- G. J. Jason and R. Stenzel, Identification of Lysergic Acid Diethylamide (LSD) in Candy by UHPLC/MS, Cannabis and Hemp, Thermo Fisher Scientific, San Jose, CA, USA, 2016 Search PubMed.
- P. Ghosh, M. M. Reddy, B. S. Rao and R. K. Sarin, Determination of diazepam in cream biscuits by liquid chromatography, J. AOAC Int., 2004, 87, 569–572 CrossRef CAS PubMed.
- B. Jain, et al., Cellulose paper sorptive extraction (CPSE) combined with gas chromatography–mass spectrometry (GC–MS) for facile determination of lorazepam residues in food samples involved in drug facilitated crimes, Separations, 2023, 10, 281 CrossRef CAS.
- X. Ruan, et al., A simplified fabric phase sorptive extraction method for the determination of amphetamine drugs in water samples using liquid chromatography-mass spectrometry, RSC Adv., 2020, 10, 10854–10866 RSC.
- C. Rosa da Silva, et al., Development and validation of an extraction method using liquid chromatography-tandem mass spectrometry to determine patulin in apple juice, Food Chem., 2022, 366, 130654 CrossRef CAS PubMed.
- I. Sánchez-Sellero, et al., Development and Validation of a Sonication-Assisted Dispersive Liquid-Liquid Microextraction Procedure and an HPLC-PDA Method for Quantitative Determination of Zolpidem in Human Plasma and Its Application to Forensic Samples, Molecules, 2024, 29, 9112490 CrossRef PubMed.
- A. Wasik, A. Zygler and A. Kot-Wasik, Abc Techniki SPE, Wydawnictwo Politechniki Gdańskiej, 2011 Search PubMed.
- S. Armenta, S. Garrigues and M. de la Guardia, Green analytical chemistry, TrAC, Trends Anal. Chem., 2008, 27, 497–511 CrossRef CAS.
- I. Vasconcelos and C. Fernandes, Magnetic solid phase extraction for determination of drugs in biological matrices, TrAC, Trends Anal. Chem., 2017, 89, 41–52 CrossRef CAS.
- N. J. Waleng, S. K. Selahle, A. Mpupa, Y. Zhang and P. N. Nomngongo, Development of Magnetic Solid Phase Micro-Extraction (MSPE) Method for the Extraction and Preconcentration of the Selected β-Blockers in the Environmental Wastewaters, Chem. Afr., 2024, 13, 4 Search PubMed.
- M. Wierucka and M. Biziuk, Application of magnetic nanoparticles for magnetic solid-phase extraction in preparing biological, environmental and food samples, TrAC, Trends Anal. Chem., 2014, 59, 50–58 CrossRef CAS.
- Y. Kiso and H. Yajima, in Peptides, ed. B. Gutte, Academic Press, San Diego, 1995, pp. 39–91 Search PubMed.
- G. Varnavides, et al., In Search of a Universal Method: A Comparative Survey of Bottom-Up Proteomics Sample Preparation Methods, J. Proteome Res., 2022, 21, 2397–2411 CrossRef CAS PubMed.
- H. E. Johnston, et al., Solvent Precipitation SP3 (SP4) Enhances Recovery for Proteomics Sample Preparation without Magnetic Beads, Anal. Chem., 2022, 94, 10320–10328 CrossRef CAS PubMed.
- P. M. Reddy, K. C. Chang, Z. J. Liu, C. T. Chen and Y. P. Ho, Functionalized magnetic iron oxide (Fe3O4) nanoparticles for capturing gram-positive and gram-negative bacteria, J. Biomed. Nanotechnol., 2014, 10, 1429–1439 CrossRef CAS PubMed.
- M. Acikkol, S. Mercan and Ş. Karadayi, Simultaneous Determination of Benzodiazepines and Ketamine from Alcoholic and Nonalcoholic Beverages by GC-MS in Drug Facilitated Crimes, Chromatographia, 2009, 70, 1295–1298 CrossRef CAS.
- L. Gautam, S. D. Sharratt and M. D. Cole, Drug facilitated sexual assault: detection and stability of benzodiazepines in spiked drinks using gas chromatography-mass spectrometry, PLoS One, 2014, 9, e89031 CrossRef PubMed.
- S. Soni, U. Jain and N. Chauhan, A systematic review on sensing techniques for drug- facilitated sexual assaults (DFSA) monitoring, Chin. J. Anal. Chem., 2021, 49, 83–92 Search PubMed.
- J. A. Albright, S. A. Stevens and D. J. Beussman, Detecting ketamine in beverage residues: Application in date rape detection, Drug Test. Anal., 2012, 4, 337–341 CrossRef CAS PubMed.
- P. Stelmaszczyk, E. Gacek and R. Wietecha-Posłuszny, Green aspects in the procedure of detection ketamine, flunitrazepam, and diazepam in drinks based on dried sample spot analysis, Green Anal. Chem., 2022, 3, 100029 CrossRef.
- R. K. Sarin, G. P. Sharma, K. M. Varshney and S. N. Rasool, Determination of diazepam in cold drinks by high-performance thin-layer chromatography, J. Chromatogr. A, 1998, 822, 332–335 CrossRef CAS PubMed.
- J. Płotka-Wasylka and W. Wojnowski, Complementary green analytical procedure index (ComplexGAPI) and software, Green Chem., 2021, 23, 8657–8665 RSC.
- F. Pena-Pereira, W. Wojnowski and M. Tobiszewski, AGREE—Analytical GREEnness Metric Approach and Software, Anal. Chem., 2020, 92, 10076–10082 CrossRef CAS PubMed.
- P. M. Nowak and F. Arduini, RGBfast – A user-friendly version of the Red-Green-Blue model for assessing greenness and whiteness of analytical methods, Green Anal. Chem., 2024, 10, 100120 CrossRef.
- N. Manousi, W. Wojnowski, J. Płotka-Wasylka and V. Samanidou, Blue applicability grade index (BAGI) and software: a new tool for the evaluation of method practicality, Green Chem., 2023, 25, 7598–7604 RSC.
- B. Jain, et al., Cellulose Paper Sorptive Extraction (CPSE) Combined with Gas Chromatography–Mass Spectrometry (GC–MS) for Facile Determination of Lorazepam Residues in Food Samples Involved in Drug Facilitated Crimes, Separations, 2023, 10, 281 CrossRef CAS.
- A. K. Kammoun, M. A. Afify, R. M. Youssef, S. A. El-Nahass and S. E. Younis, Ecological assessment and development of analytical methods for concurrent quantification of valsartan and sacubitril: whiteness comparative study based on relative scoring, RSC Adv., 2024, 14, 16318–16326 RSC.
- C. Sudheesh, Z. R. Bhat, B. Aaliya and K. V. Sunooj, in Nutraceuticals and Health Care, ed. J. Kour and G. A. Nayik, Academic Press, 2022, pp. 29–60 Search PubMed.
- M. Lynch and E. Weiner, HPLC: high performance liquid chromatography, Environ. Sci. Technol., 1979, 13, 666–671 CrossRef CAS.
- G. M. Merone, et al., Fast Quantitative LC-MS/MS Determination of Illicit Substances in Solid and Liquid Unknown Seized Samples, Anal. Chem., 2021, 93, 16308–16313 CrossRef CAS PubMed.
- A. Nasiri, et al., Overview, consequences, and strategies for overcoming matrix effects in LC-MS analysis: a critical review, Analyst, 2021, 146, 6049–6063 RSC.
- W. J. Chen, P. J. Tsai and Y. C. Chen, Functional nanoparticle-based proteomic strategies for characterization of pathogenic bacteria, Anal. Chem., 2008, 80, 9612–9621 CrossRef CAS PubMed.
- W. J. Chen, P. J. Tsai and Y. C. Chen, Functional nanoparticle-based proteomic strategies for characterization of pathogenic bacteria, Anal. Chem., 2008, 80, 9612–9621 CrossRef CAS PubMed.
- Regulatory bodies of European Union, Validation of Analytical Procedures: Text and Methodology, Japan and USA, 1994, https://database.ich.org/sites/default/files/Q2%28R1%29Guideline.pdf.
- Regulatory bodies of European union, Stability Testing of New Drug Substances And Products, Japan and USA, 2003, https://database.ich.org/sites/default/files/Q1A%28R2%29Guideline.pdf.
- A. Mullard, 2010 FDA drug approvals, Nat. Rev. Drug Discovery, 2011, 10, 82–85 CrossRef CAS PubMed.
- A. Al-Majed, Profiles of Drug Substances, Excipients, and Related Methodology, Academic Press, 2022 Search PubMed.
- C. T. Chen and Y. C. Chen, Fe3O4/TiO2 core/shell nanoparticles as affinity probes for the analysis of phosphopeptides using TiO2 surface-assisted laser desorption/ionization mass spectrometry, Anal. Chem., 2005, 77, 5912–5919 CrossRef CAS PubMed.
- A. Bertoluzza, C. Fagnano, M. Antonietta Morelli, V. Gottardi and M. Guglielmi, Raman and infrared spectra on silica gel evolving toward glass, J. Non-Cryst. Solids, 1982, 48, 117–128 CrossRef CAS.
- Y. Heo, E. H. Lee and S. W. Lee, Adsorptive removal of micron-sized polystyrene particles using magnetic iron oxide nanoparticles, Chemosphere, 2022, 307, 135672 CrossRef CAS PubMed.
- A. Batool and S. Valiyaveettil, Surface functionalized cellulose fibers - A renewable adsorbent for removal of plastic nanoparticles from water, J. Hazard. Mater., 2021, 413, 125301 CrossRef CAS PubMed.
- A. F. Pozharskii, et al., Modeling Biologically Important NH⋯π Interactions Using peri-Disubstituted Naphthalenes, J. Org. Chem., 2020, 85, 12468–12481 CrossRef CAS PubMed.
- K. Kobayashi, Y. Asakawa, Y. Kikuchi, H. Toi and Y. Aoyama, CH-.pi. interaction as an important driving force of host-guest complexation in apolar organic media. Binding of monools and acetylated compounds to resorcinol cyclic tetramer as studied by proton NMR and circular dichroism spectroscopy, J. Am. Chem. Soc., 1993, 115, 2648–2654 CrossRef CAS.
- D. Steiner, R. Krska, A. Malachová, I. Taschl and M. Sulyok, Evaluation of Matrix Effects and Extraction Efficiencies of LC-MS/MS Methods as the Essential Part for Proper Validation of Multiclass Contaminants in Complex Feed, J. Agric. Food Chem., 2020, 68, 3868–3880 CrossRef CAS PubMed.
- K. Goryński, Ł. Sobczak and D. Kołodziej, Developing and Evaluating the Greenness of a Reliable, All-in-One Thin-Film Microextraction Protocol for Determining Fentanyl, Methadone, and Zolpidem in Plasma, Urine, and Oral Fluid, Molecules, 2024, 29, 335 CrossRef PubMed.
- V. Chauhan, et al., Developing, validating, and comparing an analytical method to simultaneously detect z-drugs in urine samples using the QuEChERS approach with both liquid chromatography and gas chromatography-tandem mass spectrometry, Saudi Pharm. J., 2024, 32, 101950 CrossRef CAS PubMed.
- L. Banaszkiewicz, M. K. Woźniak, M. Kaliszan and A. Kot-Wasik, Determination of benzodiazepines and Z-hypnotic drugs in whole blood samples by GC–MS/MS: Method development, validation and application, Microchem. J., 2023, 193, 109115 CrossRef CAS.
- R. Barone, et al., Development and validation of a fast UPLC-MS/MS screening method for the detection of 68 psychoactive drugs and metabolites in whole blood and application to post-mortem cases, J. Pharm. Biomed. Anal., 2023, 228, 115315 CrossRef CAS PubMed.
- O. Wachełko, et al., An ultra-sensitive UHPLC-QqQ-MS/MS method for determination of 54 benzodiazepines (pharmaceutical drugs, NPS and metabolites) and z-drugs in biological samples, Talanta, 2023, 251, 123816 CrossRef PubMed.
- S. Sofalvi, et al., Development and Validation of an LC–MS-MS Method for the Detection of 40 Benzodiazepines and Three Z-Drugs in Blood and Urine by Solid-Phase Extraction, J. Anal. Toxicol., 2020, 44, 708–717 CrossRef CAS PubMed.
- A. Gałuszka, Z. Migaszewski and J. Namieśnik, The 12 Principles of Green Analytical Chemistry and the SIGNIFICANCE Mnemonic of Green Analytical Practices, TrAC, Trends Anal. Chem., 2013, 50, 78 CrossRef.
- P. M. Nowak and P. Kościelniak, What Color Is Your Method? Adaptation of the Rgb Additive Color Model to Analytical Method Evaluation, Anal. Chem., 2019, 91, 10343 CrossRef CAS PubMed.
- P. M. Nowak, R. Wietecha-Posłuszny and J. Pawliszyn, White Analytical Chemistry: An approach to reconcile the principles of Green Analytical Chemistry and functionality, TrAC, Trends Anal. Chem., 2021, 138, 116223 CrossRef CAS.
- M. Malesevic, et al., Stress degradation studies on zolpidem tartrate using LC-DAD and LC-MS methods, Acta Chromatogr., 2014, 26, 81–96 CrossRef CAS.
Footnote |
| † Electronic supplementary information (ESI) available. See DOI: https://doi.org/10.1039/d4ra04303k |
| This journal is © The Royal Society of Chemistry 2024 |


