 Open Access Article
In vitro and in silico studies of alpha glucosidase inhibition and antifungal activity of coffea canephora husk†
Tran Thi Ngoc Maia,
Phan Nhat Minhbc,
Nguyen Tan Phat bc,
Mai Thanh Chibc,
Dang Chi Hienbc,
Van-Kieu Nguyende,
Thuc Huy Duongf,
Tran Thanh Nhag,
Tran Nguyen Minh An
 *h,
Nguyen Ngoc Huyen Tranh and
Mai Dinh Tri*bc
aInstitute of Applied Sciences, HUTECH University, 475A Dien Bien Phu Street, Ward 25, Binh Thanh District, Ho Chi Minh City, Vietnam
bInstitute of Chemical Technology, Vietnam Academy of Science and Technology, 1A TL29 Street, Thanh Loc ward, District 12, Ho Chi Minh City, Vietnam. E-mail: maidinhtri@gmail.com
cGraduate University of Science and Technology, Vietnam Academy of Science and Technology, 18 Hoang Quoc Viet, Cau Giay, Hanoi, Vietnam
dInstitute of Fundamental and Applied Sciences, Duy Tan University, Ho Chi Minh City 700000, Vietnam
eFaculty of Natural Sciences, Duy Tan University, Da Nang, 550000, Vietnam
fDepartment of Chemistry, Ho Chi Minh City University of Education, 280 An Duong Vuong Street, District 5, 748342, Ho Chi Minh City, Vietnam
gDepartment of Environmental Engineering, Thu Dau Mot University, Binh Duong, Vietnam
hFaculty of Chemical Engineering, Industrial University of Ho Chi Minh City, Ho Chi Minh City, 71420, Vietnam. E-mail: trannguyenminhan@iuh.edu.vn
First published on 27th August 2024
Abstract
The coffea canephora husk, a protected agricultural crop, is abundant in Vietnam. Examining the effects of C. canephora husk compounds on α-glucosidase and antifungal drug activity was the primary objective of this research. A cholestane-type steroid, coffeacanol A (1), was extracted from the ethyl acetate extract. Three cholestane-type derivatives (2–4) and three additional known compounds (5–7) were separated, and we used a variety of chromatographic techniques to identify a total of six substances. We used NMR to determine the chemical structures of these substances. Extensive HR-MS-ESI analysis and NMR experimental data were used to confirm the structure of the novel metabolite (1). The cholestane-type steroid was initially discovered in the Coffea canephora husk, marking the first instance in the coffee plant family to reveal chemical structures (1–7). The inhibition of α-glucosidase was found to be significantly higher in all compounds tested, with the exception of compounds (2) and (5). In vitro, the positive control showed the lowest inhibition, and the range of IC50 values was calculated to be 27.4 to 96.5 μM, which is lower than the IC50 value of 214.50 μM for the acarbose control. With an IC50 value of 27.4 μM, compound (7) showed the greatest capacity to inhibit α-glucosidase among the test compounds. The 3TOP and 2VF5 enzyme crystal structures were used for in silico docking investigations and validations of compounds (1–7). In silico calculations to explain how compound (7) shows high activity in vitro via the enzyme inhibition mechanism by residual amino acids, like Gly 1102 (B chain) and Glu 1095 (B chain), and their relative interaction with compounds (7) and acarbose. Compound (7) exhibited the best antifungal activity against Candida albicans fungus among three fungi, namely Candida albicans, Trichophyton mentagrophytes, and Trichophyton rubrum, with a MIC value of 25 μM. Compound (7) and fluconazole combined to form similar interactions in the contact ligand model, including the functional group, capping group, and linker part, which interacted fully with the 2VF5 enzyme, leading to effective in vitro inhibition.
1. Introduction
Diabetes, or high blood glucose levels, can lead to neurological, retinal or cardiovascular diseases.1–3 Inhibition of α-glucosidase or α-amylase could be one of the keys to controlling post-prandial hyperglycaemia.4–6 Remarkably, the bioactive compounds, phenolic compounds such as chlorogenic acid, trigonelline, anthocyanin, protocatechuic acid, gallic acid, rutin, and caffeine,7 found in coffee pulps affect several pathways involved in the pathogenesis of type 2 diabetes, reducing the risk of this disease.8 Especially, the major compounds of the coffee outer skin, caffeic and chlorogenic acid, were recognized as having the α-glucosidase and α-amylase inhibitory potential.9 Although the coffee showed diverse bioactivities such as antioxidant10–12 and antibacterial,10,11 only a few chemical investigations of antidiabetic and antimicrobial activities of Coffea canephora husk have been reported.13,14 Antibacterial activity studies of Coffea robusta leaf extract (RLE) showed that chlorogenic acid (CA) is a major component inhibited against Staphylococcus aureus, Bacillus subtilis, Escherichia coli, and Salmonella typhimurium.15 The biological activity mechanism of chlorogenic acid and its applications in the food industry are stated in a review report.16 Chlorogenic acid involved in on synthesis of the fatty acid in animals and bacteria via enzyme catalyst,17 pharmacological action and potential targets.18 In the course of the search for new α-glucosidase inhibitors from the Coffea canephora husk, waste material in large amounts from Daklak province, Vietnam, we isolated seven compounds, including one new cholestane-type steroid, 24S-ethylcholestane-1α,3β-diol, namely coffeacanol A (1), along with three steroids, ergosterol peroxide (2),19 cerevisterol (3),20 gramisterol (4),21 one alkaloid, caffeine (5),22 and two phenolics, methyl 5-O-caffeoylquinate (6),23 and chlorogenic acid (7)24 from the ethyl acetate extract of the Coffea canephora husk. Details of the structural elucidation of (1) are presented. Compounds (1–7) were further examined for their α-glucosidase inhibition and antifungal activity. Recently, computer-aided drug designing has been applied to predict and discover drug activities in silico, and the software Autodock provides the docking of the best conformation of ligands.25 It is based on scoring functional, generic algorithm (GA), and experimental Gibbs free energy.26 The validation of the model is performed by the RMSD of ligands to a reference ligand that is available in the enzyme.27,28 The efficacy of in silico docking has been demonstrated in selecting target enzymes more effectively than proteins. Additionally, the publications provide a detailed explanation of the ligand interaction model between the ideal docking position and the target enzyme.29 Some typical enzymes are chosen to explore the properties, such as antibacterial activity: 2VF5: PDB, anti-inflammatory activity,30 anticancer based on human topoisomerase I: 1T8I: PDB,31 antidiabetic activity: 3TOP or 4J5T: PDB32–36 anti ageing activity ROS (3ZBF: PDB), collagenase (966C: PDB), hyaluronidase (1FCV: PDB) enzyme37 and others, to calculate docking. The stability of the complex formed by the best docking pose and enzyme has been evaluated using molecular dynamics simulations ranging from 0 to 100 ns in a real environment. These simulations are performed using Gromac or Desmond-Schrodinger software on Ubuntu or Linux.38–42 The best docking pose of the ligand that showed good activity is usually performed by the ADMET pharmacokinetic model.33,43–45 In this effort, we isolated, structurally characterised, in vitro-glucosidase inhibited, novel antifungal activity, and performed in silico molecular docking investigations on the crystal structures of 3TOP (glucosidase inhibition) and 2VF5 (antibacterial activity) from PDB. We also used an in silico docking model to explain why the compounds have such high activity in vitro, and we confirmed it with RMSD values.292. Experimental
2.1. Experimental techniques
![[thin space (1/6-em)]](https://www.rsc.org/images/entities/char_2009.gif) :
:![[thin space (1/6-em)]](https://www.rsc.org/images/entities/char_2009.gif) 1–0
1–0![[thin space (1/6-em)]](https://www.rsc.org/images/entities/char_2009.gif) :
:![[thin space (1/6-em)]](https://www.rsc.org/images/entities/char_2009.gif) 1, v/v) solvents and followed by EtOAc
1, v/v) solvents and followed by EtOAc![[thin space (1/6-em)]](https://www.rsc.org/images/entities/char_2009.gif) :
:![[thin space (1/6-em)]](https://www.rsc.org/images/entities/char_2009.gif) MeOH (20
MeOH (20![[thin space (1/6-em)]](https://www.rsc.org/images/entities/char_2009.gif) :
:![[thin space (1/6-em)]](https://www.rsc.org/images/entities/char_2009.gif) 1–5
1–5![[thin space (1/6-em)]](https://www.rsc.org/images/entities/char_2009.gif) :
:![[thin space (1/6-em)]](https://www.rsc.org/images/entities/char_2009.gif) 1 v/v) to get eight fractions, denoted as CCE.I–CCE.XIII. CCE.II fraction (12.0 g) was selected for further fractionation by silica gel CC using a solvent system consisting of n-hexane: EtOAc (10
1 v/v) to get eight fractions, denoted as CCE.I–CCE.XIII. CCE.II fraction (12.0 g) was selected for further fractionation by silica gel CC using a solvent system consisting of n-hexane: EtOAc (10![[thin space (1/6-em)]](https://www.rsc.org/images/entities/char_2009.gif) :
:![[thin space (1/6-em)]](https://www.rsc.org/images/entities/char_2009.gif) 1–1
1–1![[thin space (1/6-em)]](https://www.rsc.org/images/entities/char_2009.gif) :
:![[thin space (1/6-em)]](https://www.rsc.org/images/entities/char_2009.gif) 1, v/v) to afford six fractions CCE.II.1–CCE.II.6. The fraction CCE.II.2 (2.1 g) was chromatographed by silica gel CC using the n-hexane-CH2Cl2–MeOH (5
1, v/v) to afford six fractions CCE.II.1–CCE.II.6. The fraction CCE.II.2 (2.1 g) was chromatographed by silica gel CC using the n-hexane-CH2Cl2–MeOH (5![[thin space (1/6-em)]](https://www.rsc.org/images/entities/char_2009.gif) :
:![[thin space (1/6-em)]](https://www.rsc.org/images/entities/char_2009.gif) 1
1![[thin space (1/6-em)]](https://www.rsc.org/images/entities/char_2009.gif) :
:![[thin space (1/6-em)]](https://www.rsc.org/images/entities/char_2009.gif) 0.1, v/v/v) solvent system to afford compounds 2 (15.0 mg) and 4 (11.0 mg). Fraction CCE.II.4 (3.4 g) was further chromatographed using silica gel CC, eluted with n-hexane:EtOAc (2
0.1, v/v/v) solvent system to afford compounds 2 (15.0 mg) and 4 (11.0 mg). Fraction CCE.II.4 (3.4 g) was further chromatographed using silica gel CC, eluted with n-hexane:EtOAc (2![[thin space (1/6-em)]](https://www.rsc.org/images/entities/char_2009.gif) :
:![[thin space (1/6-em)]](https://www.rsc.org/images/entities/char_2009.gif) 1, 1
1, 1![[thin space (1/6-em)]](https://www.rsc.org/images/entities/char_2009.gif) :
:![[thin space (1/6-em)]](https://www.rsc.org/images/entities/char_2009.gif) 1, 1
1, 1![[thin space (1/6-em)]](https://www.rsc.org/images/entities/char_2009.gif) :
:![[thin space (1/6-em)]](https://www.rsc.org/images/entities/char_2009.gif) 2, 1
2, 1![[thin space (1/6-em)]](https://www.rsc.org/images/entities/char_2009.gif) :
:![[thin space (1/6-em)]](https://www.rsc.org/images/entities/char_2009.gif) 5, v/v) mixtures to furnish 4 subfractions (CCE.II.4.1–CCE.II.4). Subfraction CCE.II.4.2 (650 mg) was passed over a silica gel CC using an eluent as n-hexane: EtOAc (1
5, v/v) mixtures to furnish 4 subfractions (CCE.II.4.1–CCE.II.4). Subfraction CCE.II.4.2 (650 mg) was passed over a silica gel CC using an eluent as n-hexane: EtOAc (1![[thin space (1/6-em)]](https://www.rsc.org/images/entities/char_2009.gif) :
:![[thin space (1/6-em)]](https://www.rsc.org/images/entities/char_2009.gif) 1) to afford compounds 1 (5.0 mg) and 3 (9.0 mg). Next, fraction CCE.IV (21 g) was separated by silica gel CC, eluted with a gradient system of CH2Cl2–MeOH (30
1) to afford compounds 1 (5.0 mg) and 3 (9.0 mg). Next, fraction CCE.IV (21 g) was separated by silica gel CC, eluted with a gradient system of CH2Cl2–MeOH (30![[thin space (1/6-em)]](https://www.rsc.org/images/entities/char_2009.gif) :
:![[thin space (1/6-em)]](https://www.rsc.org/images/entities/char_2009.gif) 1–0
1–0![[thin space (1/6-em)]](https://www.rsc.org/images/entities/char_2009.gif) :
:![[thin space (1/6-em)]](https://www.rsc.org/images/entities/char_2009.gif) 1, v/v) to give five fractions CCE.IV.1–CCE.IV.5. Fraction CCE.IV.2 (5.0 g) was chromatographed on a silica gel column eluting with a gradient of CH2Cl2
1, v/v) to give five fractions CCE.IV.1–CCE.IV.5. Fraction CCE.IV.2 (5.0 g) was chromatographed on a silica gel column eluting with a gradient of CH2Cl2![[thin space (1/6-em)]](https://www.rsc.org/images/entities/char_2009.gif) :
:![[thin space (1/6-em)]](https://www.rsc.org/images/entities/char_2009.gif) MeOH (30
MeOH (30![[thin space (1/6-em)]](https://www.rsc.org/images/entities/char_2009.gif) :
:![[thin space (1/6-em)]](https://www.rsc.org/images/entities/char_2009.gif) 1–1
1–1![[thin space (1/6-em)]](https://www.rsc.org/images/entities/char_2009.gif) :
:![[thin space (1/6-em)]](https://www.rsc.org/images/entities/char_2009.gif) 1, v/v) yielding six fractions (CCE.IV.2.1–CCE.IV.2.6). The subfraction CCE.IV.5.2.4 (1.5 g) was separated by chromatography on a silica gel column eluting with CH2Cl2
1, v/v) yielding six fractions (CCE.IV.2.1–CCE.IV.2.6). The subfraction CCE.IV.5.2.4 (1.5 g) was separated by chromatography on a silica gel column eluting with CH2Cl2![[thin space (1/6-em)]](https://www.rsc.org/images/entities/char_2009.gif) :
:![[thin space (1/6-em)]](https://www.rsc.org/images/entities/char_2009.gif) MeOH (20
MeOH (20![[thin space (1/6-em)]](https://www.rsc.org/images/entities/char_2009.gif) :
:![[thin space (1/6-em)]](https://www.rsc.org/images/entities/char_2009.gif) 1, v/v) to obtain compound 5 (250 mg). Compounds 6 (9.0 mg) and 7 (25.0 mg) were obtained from fraction CCE.IV.5.5 (1.2 g) by two consecutive silica gel CC: a normal-phase column with a mobile phase as n-hexane: CH2Cl2
1, v/v) to obtain compound 5 (250 mg). Compounds 6 (9.0 mg) and 7 (25.0 mg) were obtained from fraction CCE.IV.5.5 (1.2 g) by two consecutive silica gel CC: a normal-phase column with a mobile phase as n-hexane: CH2Cl2![[thin space (1/6-em)]](https://www.rsc.org/images/entities/char_2009.gif) :
:![[thin space (1/6-em)]](https://www.rsc.org/images/entities/char_2009.gif) MeOH (3
MeOH (3![[thin space (1/6-em)]](https://www.rsc.org/images/entities/char_2009.gif) :
:![[thin space (1/6-em)]](https://www.rsc.org/images/entities/char_2009.gif) 1
1![[thin space (1/6-em)]](https://www.rsc.org/images/entities/char_2009.gif) :
:![[thin space (1/6-em)]](https://www.rsc.org/images/entities/char_2009.gif) 0.1 to 1
0.1 to 1![[thin space (1/6-em)]](https://www.rsc.org/images/entities/char_2009.gif) :
:![[thin space (1/6-em)]](https://www.rsc.org/images/entities/char_2009.gif) 1
1![[thin space (1/6-em)]](https://www.rsc.org/images/entities/char_2009.gif) :
:![[thin space (1/6-em)]](https://www.rsc.org/images/entities/char_2009.gif) 0.1, v/v/v) and C-18 reverse phase column using a solvent system of MeOH
0.1, v/v/v) and C-18 reverse phase column using a solvent system of MeOH![[thin space (1/6-em)]](https://www.rsc.org/images/entities/char_2009.gif) :
:![[thin space (1/6-em)]](https://www.rsc.org/images/entities/char_2009.gif) H2O (3
H2O (3![[thin space (1/6-em)]](https://www.rsc.org/images/entities/char_2009.gif) :
:![[thin space (1/6-em)]](https://www.rsc.org/images/entities/char_2009.gif) 1, v/v).
1, v/v).Coffeacanol A (1): White amorphous powder; [α]D25 −45,8 (c 0.05, CHCl3). HRESIMS 433.4020 [M + H]+ was determined to have the formula C29H53O2 (calcd for C29H53O2, 433.4046); 1H-NMR (600 MHz, DMSO-d6) and 13C-NMR (150 MHz, DMSO-d6), as seen in Table 1.
| Compound (1) | |||||
|---|---|---|---|---|---|
| δC | δH | δC | δH | ||
| a δ (ppm); J in Hz. | |||||
| 1 | 76.3 | 3.54 (1H, s) | 16 | 28.4 | 1.83 (1H, m) |
| 1.26 (1H, m) | |||||
| 2 | 34.7 | 1.60 (2H, m) | 17 | 56.3 | 1.10 (1H, m) |
| 3 | 67.8 | 4.09 (1H, dd, 10.8, 4.8) | 18 | 12.3 | 0.68 (3H, s) |
| 4 | 40.9 | 2.09 (1H, m) | 19 | 17.0 | 1.18 (3H, s) |
| 1.60 (1H, m) | |||||
| 5 | 30.4 | 1.73 (1H, m) | 20 | 36.3 | 1.35 (1H, m) |
| 6 | 26.4 | 1.17 (2H, m) | 21 | 18.9 | 0.91 (3H, d, 6.6) |
| 7 | 32.6 | 1.54 (1H, m) | 22 | 34.1 | 1.32 (1H, m) |
| 1.41 (1H, m) | 1.00 (1H, m) | ||||
| 8 | 36.3 | 1.35 (1H, m) | 23 | 31.0 | 1.86 (1H, m) |
| 1.53 (1H, m) | |||||
| 9 | 46.1 | 1.22 (1H, m) | 24 | 46.0 | 0.94 (1H, m) |
| 10 | 38.5 | — | 25 | 29.4 | 1.66 (1H, m) |
| 11 | 21.3 | 1.37 (2H, m) | 26 | 19.8 | 0.81 (3H, d, 6.6) |
| 12 | 40.1 | 2.00 (1H, m) | 27 | 19.2 | 0.83 (3H, d, 6.6) |
| 1.16 (1H, m) | |||||
| 13 | 42.9 | — | 28 | 23.3 | 1.28 (1H, m) |
| 1.23 (1H, m) | |||||
| 14 | 56.1 | 1.08 (1H, m) | 29 | 12.1 | 0.84 (3H, t, 7.8) |
| 15 | 24.3 | 1.57 (1H, m) | |||
| 1.07 (1H, m) | |||||
The macro-broth dilution assay: the dilution method is employed to continuously conduct in vitro experiments with the active compounds. The concentrations of active entries were diluted by a two-fold dilution to obtain a series of highest to lowest concentrations as 200![[thin space (1/6-em)]](https://www.rsc.org/images/entities/char_2009.gif) 100, 50, 25, 12.5, 6.25 and 3.125 μM. These sample concentrations of entries (1–7) were then incubated in the media culture and fungi solution. The suitable temperature for bacteria was 37 °C for 48 hours. The lowest concentration of the entry, which inhibited the growth of bacteria or fungi, is called the MIC value in units of μM.
100, 50, 25, 12.5, 6.25 and 3.125 μM. These sample concentrations of entries (1–7) were then incubated in the media culture and fungi solution. The suitable temperature for bacteria was 37 °C for 48 hours. The lowest concentration of the entry, which inhibited the growth of bacteria or fungi, is called the MIC value in units of μM.
2.2. In silico techniques
In silico docking models were used to explain the high in vitro antibacterial activity and alpha glucosidase inhibiton activity of the compounds, which was conducted by Autodock software via Scheme 1. To explain the antibacterial activity and alpha glucosidase inhibtion, the enzymes, 2VF5 and 3TOP: PDB, have been used, respectively. For the best pose docking to 2VF5 and 3TOP, the parameters are set in gird files (dock.gpf) such as the numbers in X, Y, and Z axis of (60, 60, 60), spacing of 0.5 Å, and grid center at coordinator of (26.579, 22.731, 8.113); and the numbers of grid points in X, Y, Z axis of (50, 50, and 50), spacing of 0.5 Å, and grid center at coordinator of (−41.385, 12.152, −16.311), respectively. All ligand structures were optimized by Avogadro software version 1.1.1, and structures were saved as filename.pdb before the docking. Structures of ligands were optimized using the MMFF94 force field. For ligands, we applied AD4 methods and ran 500–1000 docking models.33,48 The coordinates (X,Y,Z) of the active center on the enzyme protein were determined using the Autodock software as per a previous article.49 Autodock software version 1.5.6rc3 (1099–2011), Discovery Studio Visualizer version v21.1.0.20298 (2021), Molegro molecular viewer version 2.5.0-2012-10-10, Avogadro version 1.1.1, PyMOL software version of non-profit purchase were used for calculations and building the model.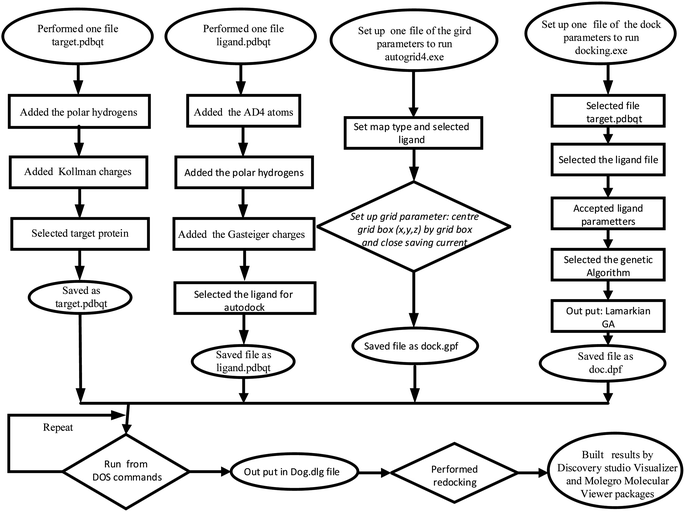 | ||
| Scheme 1 The docking procedure of the best pose docking of the activity of compounds in vitro to an enzyme, such as 3TOP and 2VF5: PDB enzyme. | ||
3. Results and discussion
3.1. Chemical characterization
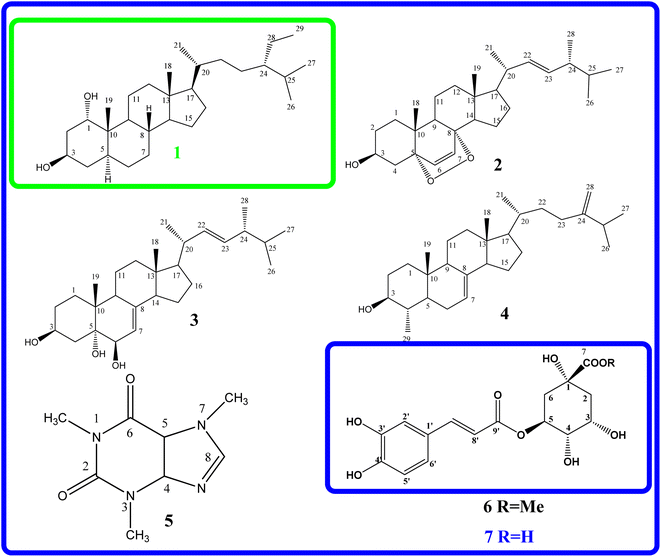
The EtOAc extract from the husks of C. canephora, collected at Dak Lak province, was subjected to a normal-phase silica gel column chromatography to provide seven compounds (1–7), as shown in Fig. 1. Compound (1) was obtained as a white amorphous powder. The formula for HR-ESI-MS data m/z 433.4020 [M + H]+ was determined as C29H52O2. The 1H-NMR spectrum of (1) showed two oxygenated methine protons at δH 3.54 (1H, brs, H-1), 4.09 (1H, dd, J = 10.8, 4.8 Hz, H-3), and six methyl groups at δH 0.68 (3H, s, H-18), 1.18 (3H, s, H-19), 0.91 (3H, d, J = 6.6 Hz, H-21), 0.81 (3H, d, J = 6.6 Hz, H-26), 0.83 (3H, d, J = 6.6 Hz, H-27), and 0.84 (3H, t, J = 7.8 Hz, H-29) as indicated in Table 1. The 13C-NMR and HSQC spectroscopy of compound (1) exhibited twenty-nine carbons, including two oxygenated methine carbons at δC 76.3 (C-1), 67.8 (C-3), two quaternary carbons, eleven methylene carbons, eight methine carbons, and six methyl carbons at δC 12.3 (C-18), 17.0 (C-19), δC 18.9 (C-21), 19.8 (C-26), 19.2 (C-27), and 12.1 (C-29). These results confirm that compound (1) is a cholestane-type skeleton, bearing two hydroxyl moieties located at C-1 and C-3, further supported by the HMBC correlation of H-10 to C-1 (δC 76.3) along with both H-1 (δH 3.54) and H2-2 (δH 1.60) to C-3 (δC 67.8).Additionally, the occurrence of a triplet methyl signal at δH 0.84 (3H, t, J = 7.8 Hz) led to the presence of an ethyl moiety, which could be located at C-24 based on the HMBC correlation of H3-29 (δH 0.84) to both methine carbon C-24 (δC 46.0) and methylene carbon C-28 (δC 23.3), as seen in Fig. S2.† As to the relative configuration, the multiplicities and J coupling constants of two oxygenated methine protons H-1 and H-3 at δH 3.54 (1H, brs, H-1), and 4.09 (1H, dd, J = 10.8, 4.8 Hz, H-3) indicate 1α and 3β orientations of two OH groups at carbons C-1 and C-3, respectively. Furthermore, the 13C NMR data comparison of compound (1) with those of 24S-methylcholesterol, 24S-methylcholestan-1,3-diol, 24S-methylcholestan-11-acetoxy-1,3,5,6-tetraol, and 3,5,25-trihydroxy-24S-methylcholestan-6-one50 led to the illustration of the 24S configuration of compound (1). Moreover, the NOESY correlations of H-1/H3-19, H3-19/H-8, and H-8/H3-18 supported the β faces of these protons, as seen in Fig. 2. Thus, the chemical structure of compound (1), namely coffeacanol A, was established as 24S-ethylcholestane-1α,3β-diol. All isolated compounds (1–7) were investigated for the in vitro studies of enzyme inhibitory against α-glucosidase, as seen in Table 2. Acarbose was used as a positive control with an IC50 value of 214.5 μM. As per the results, compounds (1), (3), (4), (6), and (7) display good inhibitory effects, with IC50 values in the range from 27.4 to 96.5 μM. It is worth noting that all of these isolated compounds were first reported from the Coffea canephora husk.
3.2. In vitro α-glucosidase activity
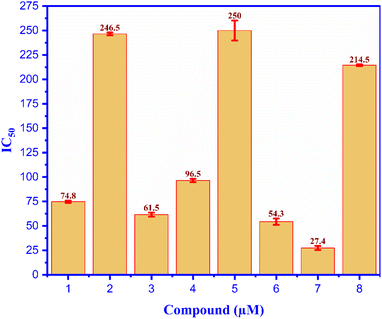
All compounds (1–7) and positive control (Acarbose) were analyzed for alpha glucosidase inhibition in vitro, as seen in Fig. 3; compound (7) indicated the most alpha glucosidase inhibitor activity with the value of IC50 of 27.4 μM among the test entries. This value is 8-fold less than that of compounds (1–7) and the positive control (Acarbose), as evaluated for the α-glucosidase inhibition in vitro illustrated in Fig. 3. Compound (7) had the highest level of α-glucosidase inhibitor activity, with an IC50 value of 27.4 μM, among all the compounds tested. The value of this molecule is 8 times lower than that of acarbose, and compound (7) inhibited α-glucosidase more effectively than acarbose by a ratio of 8. The compounds' inhibitory properties have been classified in the following order: compound (5), compound (2), Acarbose (4), compound (1), compound (3), compound (6), and compound (7). The inhibition effects of entry compounds against α-glucosidase have been demonstrated in silico docking model based on the optimal docking position of compound (7), which exhibited good docking performance in experimental silico. The inhibition observed against α-glucosidase has been revealed by the utilization of an in silico docking model. Previous reports have indicated that coffee plants, specifically C. arabica, exhibit α-glucosidase inhibition.13 Caffeine (5) was believed to be a bioactive inhibitor against alpha glucosidase, i.e., C. arabica.51 In silico and in vitro inhibition of ergosterol peroxide (2) was reported, the data of which are consistent with our investigation.52 Chlorogenic acid (7) was believed to be a potent candidate for treating type-2 diabetes.14,53 As far as we know, this is the first report of the inhibition of α-glucosidase (both in vitro and in silico) by compounds (3-4) and (6).3.3. In silico docking model of alpha glucosidase inhibition activity
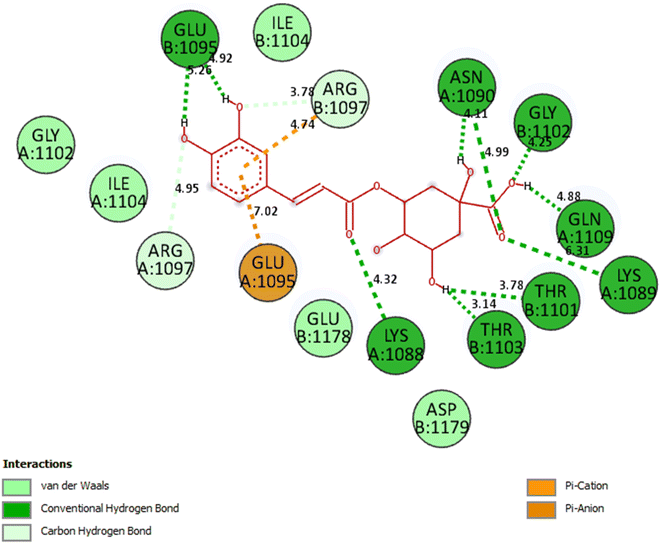 | ||
| Fig. 4 The significant ligand interactions between compound 7 and residual amino acid on the crystal structure of 3TOP: PDB enzyme, hydrogen bondings: dark green color, yellow color: pi cation interactions. | ||
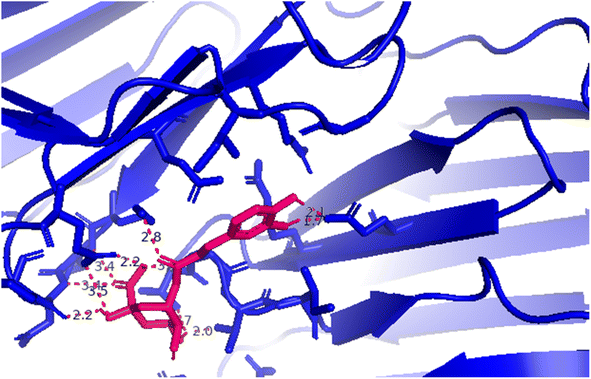 | ||
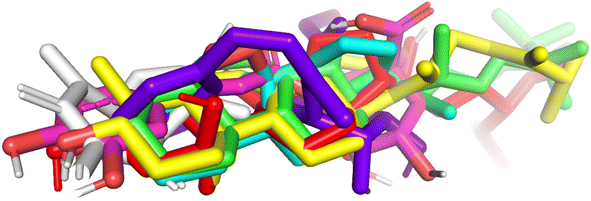
| Fig. 5 A 3D image from PyMOL software presenting the hydrogen bonding forming around compound 7; red color (compound 5), green color: crystal structure of 3TOP enzyme. | ||
Compound (7) or pose 235: As seen in Fig. 4, 5 and Table 4S,† pose 235 attaches to the crystal structure of the 3TOP enzyme with Gibbs free energy and inhibitory constant values of −4.98 kcal mol−1 and 224.1 M, respectively. Together with the remaining amino acids on 3TOP, Lys 1088, Gln 1109, Glu 1095, Thr 1103, and Asn 1090 created eight hydrogen bonds. Because of its short bond length, hydrogen bonding pose 235: H–B: Glu 1095: O (1.71 Å) is the most stable among them. Because three components of pose 235 demonstrated comprehensive interactions with 3TOP, as shown in Table 4S† and Fig. 4, pose 235 interacted with 3TOP. Fig. 5 demonstrates the formation of 11 hydrogen bonds (red color line) between compound 7 (magenta color) and 3TOP enzyme (blue color). The bonding lengths of the compounds are 2.0, 2.1, 2.2 (2), 2.7, 2.8, 3.3, 3.4 (2), and 3.5 from the PyMOL software, and these contacts were strong and hydrophilic. Because the three components of compound 7 fully interacted with 3TOP, it had a good interaction with 3TOP. Pose 235's functional groups create hydrogen bonds with Glu 1095: The following are linked: Gln 1109: A to the hydrogen atom of the hydroxyl phenolic ring; Gly 1102: B to the hydrogen atom of the hydroxyl phenolic ring; Lys 1088: A chain to the oxygen atom of the carbonyl group; Thr 1103 and Thr 1101: B to the hydrogen atom of the hydroxyl alcohol; Lys 1089: A to the oxygen atom of the double C![[double bond, length as m-dash]](https://www.rsc.org/images/entities/char_e001.gif) O of carboxylic acid; and Asn 1090: A to the hydrogen atom of the hydroxyl alcohol. The capping group (CA) is connected to the pi-electron system of the phenyl group by Glu 1095: A and pi cation or pi anion interactions. A pi cation or pi anion contact is formed by the linking unit, or linker portion, between Arg 1097: B and the phenyl group's pi-electron system.
O of carboxylic acid; and Asn 1090: A to the hydrogen atom of the hydroxyl alcohol. The capping group (CA) is connected to the pi-electron system of the phenyl group by Glu 1095: A and pi cation or pi anion interactions. A pi cation or pi anion contact is formed by the linking unit, or linker portion, between Arg 1097: B and the phenyl group's pi-electron system.
Compound (3) or pose 119: as shown in Table 4S and Fig. 31S,† pose 119 interacted strongly with the 3TOP enzyme, with Gibbs free energy and inhibition constants of −8.84 kcal mol−1 and 0.330 μM. Table 4S† shows that four hydrogen bonds were established with 3TOP. Based on Table 4S,† it can be inferred that this pose has a good interaction with 3TOP because three sections of the pose fully interact with 3TOP. Compound 3 docked well to 3TOP, as shown in Fig. 31S,† because three parts of this pose interacted fully with 3 TOP: Asn 1090, Thr 1103 to hydrogen atoms of the alcohol group in FG; Lys 1088 to the cyclohexane ring in CA; and Ile 1104 to the cyclopentane ring in CU on pose 119. Fig. 37S† illustrates how successfully the positive control medication, acarbose, interacted with 3TOP.
Compound (6) or pose 394: as demonstrated in Table 4S and Fig. 32S,† compound 6/pose 394 has been docked to 3TOP with the values of Gibbs free energy and inhibition constant of −5.38 kcal mol−1 and 114.0 μM, respectively. It also formed 11 hydrogen bonds with the enzyme, as seen in Table 4S.† In the ligand interaction model, the functional group of pose 394 formed hydrogen bondings from Asp 1107, Lys 1088, Glu 1095; Gln 1109, and Ile 1104 to hydrogen atoms of hydroxyl alcohol, hydroxyl phenolic ring, and oxygen atom of conjugation carbonyl. The connecting unit has one carbon–hydrogen bond from Arg 1097: B to the oxygen atom of the alcohol group on pose 394. The capping group has no hydrophobic interaction.
Compound (1) or pose 491: as demonstrated in Table 4S and Fig. 33S,† pose 491 has been anchored to the 3TOP enzyme with the values of free Gibbs energy and inhibition constant of −8.43 kcal mol−1 and 0.657 μM, respectively. It has no hydrogen bonding with residual amino acid on the enzyme. In the ligand interaction model, the functional groups have hydrogen bondings from Glu 1095: A and Glu 1095: B to the hydrogen atom of hydroxyl alcohol. The connecting unit shows hydrophobic interaction from Ile 1104 to the cycloalkane ring but the capping group has no interaction. We conclude that pose 491 has not interacted well with the enzyme because 3 parts of pose 491 did not interact fully with the enzyme.
Compound (4) or pose 237: as indicated in Table 4S and Fig. 34S,† pose 237 linked to the 3TOP enzyme with the values of Gibbs free energy and inhibition constant of −9.49 kcal mol−1 and 0.11 μM, respectively. This pose also formed one hydrogen bond with residual amino acids on the enzyme. In the ligand interaction model, as indicated in Fig. 34S,† the functional group of this pose showed one hydrogen bond from Asn 1090 to the hydrogen atom of hydroxyl of the alcohol group. The connecting unit (CU) of the pose has one alkyl interaction from Ile 1104 to the cyclopentane ring. The capping group has no interaction. Pose 237 did not interact well with the enzyme because of no interactions with the capping group (CA).
Compound (2) or pose 155: as indicated in Table 4S and Fig. 35S,† pose 155 docked to the 3TOP enzyme with the values of Gibbs free energy and inhibition constant of −8.71 kcal mol−1 and 0.412 μM, respectively. This pose showed one hydrogen bonding from Gln: 1109: B chain to the hydrogen atom on the pose. As demonstrated in Fig. 35S,† the functional group of pose 155 has one hydrogen bonding and hydrophilic interaction from Gln 1109 to the hydrogen atom of the hydroxyl group of alcohol. The capping group of the pose showed one carbon–hydrogen bond from Glu 1095: A to the oxygen atom of the peroxide ring. The connecting unit (CU) has no interaction. Pose 115 has not interacted fully to 3TOP enzyme.
Compound 5 or pose 355: as indicated in Table 4S and Fig. 36S,† pose 355 anchored to the 3TOP enzyme with the values of Gibbs free energy and inhibition constant of −4.59 kcal mol−1 and 429.8 μM, respectively. As indicated in Fig. 36S,† significant interactions between pose 355 and 3TOP are shown as the functional group of the pose has no hydrogen bonding. The capping group has four carbon–hydrogen bonds, hydrophobic interactions from Ser 1100, Ile 1087, Lys 1099, and Tyr 1010 to the carbon of methyl group; one carbon–hydrogen bonding from Gln 1081 to the carbon of methyl group; one pi–sigma interaction from Tyr 1010 to the carbon atom of methyl group. The capping group of pose 355 is without detection. Pose 355 did not interact fully with the 3TOP enzyme.
Acarbose or pose 61: as seen in Table 4S and Fig. 37S,† pose 61 has been anchored to 3TOP with values of Gibbs free energy and inhibition constant of −8.81 kcal mol−1, respectively. The significant interactions between pose 61 and 3TOP are presented on a 2D diagram, as shown in Fig. 37S.† The functional group of pose 61 has three hydrogen bonds from Gly 1102: B chain, Gln 1109: B, and Glu 1095. The capping group of the pose are Gly 1102: A and Glu 1095: B to carbons of the carbohydrate, Arg 1097: A chain to the oxygen atom of methylene group on carbohydrate. Connecting units (CU) are Thr 1101: A and Arg 1097: B to the methylene carbon atom and the oxygen atom of the methylene group on the carbohydrate group. Pose 61 is considered as a good interaction in the ligand interaction model.
As seen in Fig. 32S to 36S and Table S4,† compounds (6)/pose 394, compound (1)/pose 491, compound (4)/pose 237, compound (2)/pose 155, and compound (5)/pose 355 did not fully interact with 3TOP in the ligand interaction model. From the thermodynamic data (ΔG°, Ki), compound (7)/pose 235 docked better than compound (3)/pose 119. Compound (7)/pose 235 connected with 3TOP more effectively than compound (3)/pose 119 in the ligand interaction model. The 8 and 4 hydrogen bondings, respectively, that link pose 235 and 119 to the 3TOP enzyme support this. Hydrogen bondings are the most significant conformational features in terms of solubility, absorption, distribution, and metabolism in ADMET and MD simulations. The results of α-glucosidase inhibition in vitro are comparable to the in silico docking model. Fig. 4 and 37S† show the results of the similarity study in the ligand interaction model between pose compound (7)/235 and acarbose/pose 61 with TOP enzyme. These residual amino acids include Gly 1102 (B chain) and Glu 1095 (B chain).
3.4. In vitro antibacterial activity
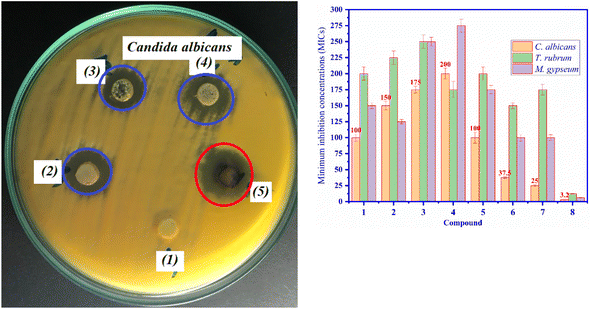
All compounds (1–7) were screened for antifungal activity against C. alibican, T. rubrum, and M. gypseum in vitro, as shown in Fig. 7A and B. Compound (7) shows the most excellent antifungal activity against C. allicin at a MIC value of 25 μM among the tested samples. This MIC value of compound (7) is determined to be higher than that of fluconazole. Compound (6) indicated high activity against C. Albian at a MIC value of 37.5 μM, compared to the MIC of compound (7), which is higher. For C. allicin, the ability of antifungal activity is determined as fluconazole (8) > compound (7) > compound (6) > compound (5) = compound (1) > compound (2) > compound (3) > compound (4), as seen in Fig. 7B (orange columns). For T. rubrum fungi, compound (4) indicated moderate activity with a MIC value of 175 μM among the test entries and the highest activity among compounds. The antifungal activity of compound (7) is similar to that of compound (6), with a MIC value of 100 μM against M. gypseum, and compound (6) and (7) also exhibited high fungal activity among test entries against T. rubrum fungi. For M. gypseum fungi, most of the compounds have shown moderate activity; among them, compounds (7) and (6) inhibited highly at MIC values of 100 μM. The antibacterial and antibiofilm activities of chlorogenic acid (CA)/compound (7) against Yersinia enterocolitica (Y. enterocolitica) were tested, and its mechanism of action was explained in the previous article.54 Chlorogenic acid showed inhibition against the Gram-negative bacterium Escherichia coli IFO 3301.55 Our work shows its excellent antifungal activity against C. albican at the MIC of 25 μM for the first time and also explains the mechanism of excellent inhibition of compound (7) against C. albican fungi from the in silico docking part as given below.293.5. In silico docking model of the antibacterial activity
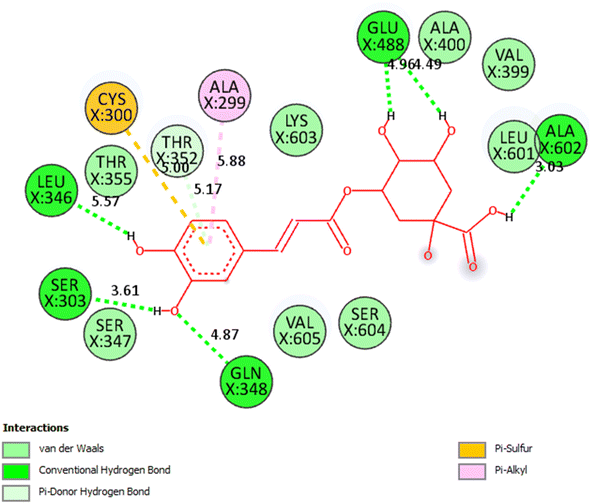 | ||
| Fig. 8 The significant interactions between the pose 49/compound (7) and residual amino acids on 2VF5 enzyme: PDB based on 2D interaction model: full ligand interactions. | ||
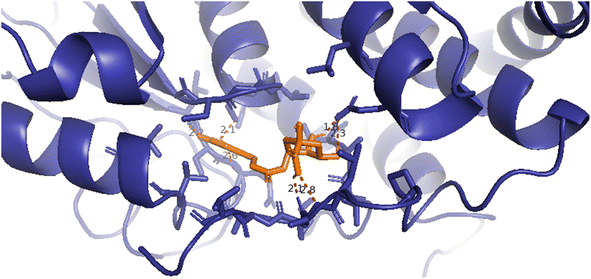 | ||
| Fig. 9 A 3D image presenting the hydrogen bondings forming around compound 7 by PyMOL software, orange color: compound 7/pose 49, dark blue color: crystal structure of 2VF5 enzyme, red color lines: hydrogen bondings, and the numbers: bond lengths of hydrogen. | ||
Compound 7/pose 49: the best conformation of compound (7) among 1000 docking conformations has been docked to 2VF5 with the values of Gibbs free energy and inhibition constant of −5.25 kcal mol−1 and 140 μM, respectively, as seen in Table 5S.† This pose formed eight hydrogen bonds with residual amino acids, as seen in Table 5S.† Among them, the hydrogen bonding, pose 49:H-XX: Glu 488: O (1.79 Å), has the strongest strength due to its shortest bonding length. This pose showed good interaction because three parts of pose 49 interacted well with enzymes. As seen in Fig. 8, all significant interactions between pose 49 and 2VF5 are indicated in a 2D diagram, including functional groups: 6 hydrogen bondings from Leu 346 to the hydrogen atom of the hydroxyl phenolic group, Gln 348 and Ser 303 to the oxygen atom and hydrogen atom of the hydroxyl phenolic group, respectively, Ala 602 to the hydrogen atom of the hydroxy of carboxylic acid, and Glu 488 to two hydrogen atoms of two hydroxyl alcohols. The capping group has one pi–sulfur interaction from Cys 300 to the system of pi electrons of the phenyl ring and one pi–alkyl interaction from Ala 299 to the system of pi electrons of the phenyl ring. The linker part has one pi–donor hydrogen bond from Thr 352 to a system of pi electrons in the phenyl ring. Compound 7 interacted well with 2VF5 in the ligand interaction model. As shown in Fig. 9, the 3D image by PyMOL software demonstrated the hydrogen bonds forming around compound 7/pose 49. The bonding lengths are 1.8, 2.1 (×2), 2.2, 2.6, 2.3, and 2.8 Å. These hydrogen bondings made around compound (7) proved the interactions between compound (7) and 2VF5: enzymes are very strong and hydrophilic interactions, indicating that compound (7) inhibited the 2VF5 enzyme strongly in vitro.
Compound 6/pose 992: it is anchored to 2VF5 with the values of Gibbs free energy and inhibition constant of −6.81 kcal mol−1 and 10.26 μM, as indicated in Table 5S.† Compound (6) formed 12 hydrogen bonds with the 2VF5 enzyme, proving the hydrophilic character of compound (6). As seen in Fig. 38S,† the significant interactions between pose 992 and 2VF5 are indicated, including functional groups that are hydrogen bondings from Ser 349 and Ser 347 to the oxygen atom of the hydroxyl alcohol group, Thr 352 to the hydrogen atoms of the hydroxyl alcohol groups, Lys 603 to the oxygen atom of the double bonding of C![[double bond, length as m-dash]](https://www.rsc.org/images/entities/char_e001.gif) O, and Ser 303 to the oxygen atom of the methoxy ester group. The capping groups (CA) are pi anion interactions from Gly 488 and pi–alkyl interactions from Leu 601 to the system of pi electrons of the phenyl group. The linker part formed the carbon–hydrogen bonds from Gly 408 to the methyl ester group and Thr 302 to the oxygen atom of the ester group. Compound (6) has been considered to have good interactions or inhibitions against enzymes.
O, and Ser 303 to the oxygen atom of the methoxy ester group. The capping groups (CA) are pi anion interactions from Gly 488 and pi–alkyl interactions from Leu 601 to the system of pi electrons of the phenyl group. The linker part formed the carbon–hydrogen bonds from Gly 408 to the methyl ester group and Thr 302 to the oxygen atom of the ester group. Compound (6) has been considered to have good interactions or inhibitions against enzymes.
Fluconazole (drug)/pose 81: it has docked to 2VF5 with the values of Gibbs free energy and inhibition constant of −5.74 kcal mol−1 and 61.85 μM, as indicated in Table 5S† and formed six hydrogen bondings to residual amino acids on the enzyme. As shown in Fig. 39S,† fluconazole interacted well with the enzyme because three parts of the molecule are identified by functional groups: hydrogen bondings from Ser 303 to the oxygen atom of the hydroxyl alcohol group and nitrogen bondings from Cys 300 to another nitrogen atom of the 1,2,4-triazole group. Especially in this pose, there are three halogen bondings from Glu 488, Val 399, and Lys 603 to the fluorine atoms of the phenyl group. The capping groups are discovered via one pi–sulfur bonding from Cys 300 to the system of pi electrons of the 1,2,4-triazole group, one pi–alkyl bonding from Ala 299 to the system of pi electrons of the 1,2,4-triazole group, and one pi–alkyl bonding from Ala 404 to the system of pi electrons of another 1,2,4-triazole group. The connecting units are detected via one pi–donor hydrogen bonding from Leu 346 and Thr 352 to carbon atoms (sp2) and a system of pi electrons of the 1,2,4-triazole group, and the pi–donor hydrogen bindings from Ser 401, Gln 408, and Ser 303 to the system of pi electrons of another 1,2,4-triazole group. Other poses, such as pose 720 (compound 1), compound 2 (pose 329), pose 830 (compound 3), pose 973 (compound 4), and pose 177 (compound 5), have not interacted well with 2VF5 because of a lack of interactions. Compound (7) and fluconazole have similar interactions in three parts, such as the functional groups: hydrogen bondings: Ser 303; capping group: one pi–sulfur interaction: Cys 300 and one pi-alkyl: Ala 219; and connecting unit: pi–donor hydrogen: Thr 352. It has been proved that compound 7 inhibited 2VF5, similar to a fluconazole drug by in silico docking.
4. Conclusion
A novel cholestane-type steroid, Coffeacanol A (1), has been identified in the ethyl acetate extract of Coffea canephora husk. In addition, six identified chemicals were isolated: ergosterol peroxide (2), reregistered (3), gramisterol (4), caffeine (5), methyl 5-O-caffeoylquinate (6), and chlorogenic acid (7). According to our present knowledge, the outer covering of Coffea canephors is the first source of documentation for all the detected chemicals. Compounds (1), (3), (4), (6), and (7) demonstrated significant action against α-glucosidase, with IC50 values of 74.8, 61.5, 96.5, 54.3, and 27.4 μM, respectively. By comparison, the IC50 value of acarbose was 214.5 μM. Compound (7) exhibited remarkable inhibitor efficacy against the alpha glucosidase, both in vitro and in silico. The amino acids Gly 1102 (B chain) and Glu 1095 (B chain) of the 3TOP: PDB were involved in the ligand interactions between compound (7) or acarbose and 3TOP. This research unequivocally supports the notion that coffee husk reduces the likelihood of developing type 2 diabetes as a result of its bioactive components. Compound (7) showed strongest inhibition activity against Candida albicans in vitro, with MIC value of 25 μM. In the in silico ligand interaction model, compound (7)/pose 49 and fluconazole drug/pose 81 demonstrated equivalent ligand interactions such as the functional groups of poses-one hydrogen bonding involving serine 303, the capping group: one pi–sulfur contact with cysteine 300 and one pi–alkyl interaction with alanine 219 and the connecting unit: one pi–donor hydrogen with threonine 352.Data availability
The data supporting this article have been included as part of the ESI.†Author contributions
Tran Thi Ngoc Mai: conceptualization, methodology. Tran Nguyen Minh An, Mai Dinh Tri: writing – original draft preparation, writing – reviewing and editing. Van-Kieu Nguyen, Thuc Huy Duong, Tran Thanh Nha, Nguyen Ngoc Huyen Tran: data curation, visualization, investigation. Phan Nhat Minh, Nguyen Tan Phat, Mai Thanh Chi, Dang Chi Hien: software, validation, supervision.Conflicts of interest
The authors declare that they have no known competing financial interests or personal relationships that could have appeared to influence the work reported in this paper.Acknowledgements
This work was supported by the Department of Science and Technology (DOST) of Dak Lak Province under grant number 369/HĐ-SKHCN. Research Lab for Drug Discovery and Development, University of Science, VNU-HCM, has supported the sample measurements.References
- A. Negi, M. Stephen, A. Vernon and D. M. Frcophth, J. R. Soc. Med., 2003, 96 DOI:10.1258/Fjrsm.96.6.266.
- M. Zhang, M. Chen, H. Q. Zhang, S. Sun, B. Xia and F. H. Wu, Fitoterapia, 2009, 80, 475–477, DOI:10.1016/j.fitote.2009.06.009.
- T. Scully, Nature, 2012, 485, S2–S3, DOI:10.1038/485S2a.
- P. S. N. Dong, H. V. T. Phan, J. Sichaem, H. V. N. Si, T. N. Tran, L. T. T. T. Hoang, T. M. S. Huynh, H. T. T. Le, D. T. Mai, T. L. Ngo, T. D. Le and V. K. Nguyen, Nat. Prod. Res., 2024, 38(16), 2869–2876, DOI:10.1080/14786419.2023.2245958.
- H. V. T. Phan, D. V. Nguyen, T. K. D. Le, T. A. M. Nguyen, P. S. N. Dong, T. N. Tran, N. V. T. Dao, H. C. Nguyen, H. T. Luu, W. Chavasiri, L. T. T. T. Hoang and V. K. Nguyen, Nat. Prod. Res., 2024, 1–10, DOI:10.1080/14786419.2024.2305659.
- D. Kumar, V. Shah, R. Ghosh and B. C. Pal, Nat. Prod. Res., 2013, 27, 624–630, DOI:10.1080/14786419.2012.686907.
- M. H. Hoang, T. A. T. Nguyen, N. K. T. Pham, V. S. Dang and T. N. Vo, Nat. Prod. Res., 2022, 36, 5161–5167, DOI:10.1080/14786419.2021.1921767.
- L. F. Campuzano-Duque, J. C. Herrera, C. Ged and M. W. Blair, Agronomy, 2021, 11, 1–13, DOI:10.3390/agronomy11122550.
- G. Oboh, O. M. Agunloye, S. A. Adefegha, A. J. Akinyemi and A. O. Ademiluyi, J. Basic Clin. Physiol. Pharmacol., 2015, 26, 165–170, DOI:10.3390/agronomy11122550.
- L. Castaldo, G. Graziani, A. Gaspari, L. Izzo, C. Luz, J. Mañes, M. Rubino, G. Meca and A. Ritieni, J. Food Res., 2018, 7, 43, DOI:10.3390/Fmolecules25030631.
- A. Heeger, A. K. Cagnazzo, E. Cantergiani and W. Andlauer, Food Chem., 2017, 221, 969–975, DOI:10.1016/j.foodchem.2016.11.067.
- S. Chase, N. Punbusayakul and M. F. Luang, J. Process. Energy Agric., 2015, 19, 224–227 Search PubMed.
- H. Mitiku, T. Y. Kim, H. Kang, E. Apostolidis, J. Y. Lee and Y. I. Kwon, BMC Complementary Med. Ther., 2022, 22, 249, DOI:10.1186/s12906-022-03726-7.
- V. Nguyen, E. G. Taine, D. Meng, T. Cui and W. Tan, Nutrients, 2024, 16(7), 924, DOI:10.3390/nu16070924.
- A. Yosboonruang, A. Ontawong, J. Thapmamang and A. Duangjai, J. Microbiol. Biotechnol., 2022, 32, 1003–1010, DOI:10.4014/jmb.2204.04003.
- L. Wang, X. Pan, L. Jiang, Y. Chu, S. Gao, X. Jiang, Y. Zhang, Y. Chen, S. Luo and C. Peng, Front. Nutr., 2022, 9 DOI:10.3389/fnut.2022.943911.
- B. H. Li, X. F. Ma, X. D. Wu and W. X. Tian, IUBMB Life, 2006, 58, 39–46, DOI:10.1080/15216540500507408.
- M. Miao and L. Xiang, Advances in Pharmacology, Academic Press Inc., 2020, vol. 87, pp. 71–88, DOI:10.1016/bs.apha.2019.12.002.
- R. Nowak, M. Drozd, E. Mendyk, M. Lemieszek, O. Krakowiak, W. Kisiel, W. Rzeski and K. Szewczyk, Molecules, 2016, 21(7), 946, DOI:10.3390/molecules21070946.
- J. Zhao, Y. Mou, T. Shan, Y. Li, L. Zhou, M. Wang and J. Wang, Molecules, 2010, 15, 7961–7970, DOI:10.3390/molecules15117961.
- P. Suttiarporn, W. Chumpolsri, S. Mahatheeranont, S. Luangkamin, S. Teepsawang and V. Leardkamolkarn, Nutrients, 2015, 7, 1672–1687, DOI:10.3390/nu7031672.
- J. Sitkowski, L. Stefaniak, I. L. Nicol, M. L. Martin, G. J. Martin and G. A. Webb, Spectrochim. Acta, Part A, 1995, 51(5), 839–841, DOI:10.1016/0584-8539(94)00192-E.
- M. J. Skowron, A. Z. Grześkowiak and T. Grześkowiak, Eur. Food Res. Technol., 2015, 240, 19–31, DOI:10.1007/s00217-014-2356-z.
- A. Farah, M. Monteiro, C. M. Donangelo and S. Lafay, J. Nutr., 2008, 138, 2309–2315, DOI:10.3945/jn.108.095554.
- N. E. Hachem, B. H. Kains, A. Khalil, F. H. Kobeissy and G. Nemer, Methods in Molecular Biology, Humana Press Inc., 2017, vol. 1598, pp. 391–403, DOI:10.1007/978-1-4939-6952-4_20.
- P. A. Ravindranath, S. Forli, D. S. Goodsell, A. J. Olson and M. F. Sanner, PLoS Comput. Biol., 2015, 11, 1–28, DOI:10.1371/journal.pcbi.1004586.
- E. W. Bell and Y. Zhang, J. Cheminf., 2019, 11(40), 1–9, DOI:10.1186/s13321-019-0362-7.
- K. Sargsyan, C. Grauffel and C. Lim, J. Chem. Theory Comput., 2017, 13, 1518–1524, DOI:10.1021/acs.jctc.7b00028.
- G. Giannini, W. Cabri, C. Fattorusso and M. Rodriquez, Future Med. Chem., 2012, 4, 1439–1460, DOI:10.4155/fmc.12.80.
- F. U. Eze, U. C. Okoro, D. I. Ugwu and S. N. Okafor, Front. Chem., 2019, 7, 1–12, DOI:10.3389/fchem.2019.00634.
- B. L. Staker, M. D. Feese, M. Cushman, Y. Pommier, D. Zembower, L. Stewart and A. B. Burgin, J. Med. Chem., 2005, 48, 2336–2345, DOI:10.1021/jm049146p.
- G. V. Vo, T. H. T. Nguyen, T. P. Nguyen, T. H. T. Do, N. M. A. Tran, H. T. Nguyen and T. T. Nguyen, Saudi Pharmaceut. J., 2022, 30, 1301–1314, DOI:10.1016/j.jsps.2022.06.018.
- H. T. Nguyen, T. T. Nguyen, T. H. Duong, N. M. A. Tran, C. H. Nguyen, T. H. A. Nguyen and J. Sichaem, Molecules, 2022, 27(8), 2574, DOI:10.3390/molecules27082574.
- H. H. Nguyen, N. M. A. Tran, T. H. T. Nguyen, H. C. Vo, C. H. Nguyen, T. H. A. Nguyen, N. H. Nguyen and T. H. Duong, J. Saudi Chem. Soc., 2022, 26, 101489, DOI:10.1016/j.jscs.2022.101489.
- N. K. T. Pham, N. M. A. Tran, H. T. Nguyen, D. D. Pham, T. Q. T. Nguyen, T. H. A. Nguyen, H. T. Nguyen, T. H. Do and N. H. Nguyen, Arab. J. Chem., 2022, 15, 103535, DOI:10.1016/j.arabjc.2021.103535.
- S. H. Figueroa, A. R. Luévano, J. C. A. Pérez, A. G. Martínez, R. O. Andrade, I. L. Rivera and G. N. Vázquez, Eur. J. Pharmacol., 2021, 15, 174244, DOI:10.1016/j.ejphar.2021.174244.
- E. S. Syamsul, S. Umar, F. S. Wahyuni, R. Martien and D. Hamidi, Open Access Maced. J. Med. Sci., 2022, 10, 1471–1477, DOI:10.3889/oamjms.2022.10558.
- D. E. Shaw Research, Desmond User's Guide Desmond Version 3.0/Document Version 0.5.3, 2011 Search PubMed.
- X. Y. Meng, H. X. Zhang, M. Mezei and M. Cui, Curr. Comput.-Aided Drug Des., 2011, 7(2), 146–157, DOI:10.2174/157340911795677602.
- J. Bhachoo and T. Beuming, Methods Mol. Biol., 2017, 235–254, DOI:10.1007/978-1-4939-6798-8_14.
- T. H. Duong, T. N. M. An, T. K. D. Le, T. M. D. Tran, H. T. Nguyen, T. H. A. Nguyen, N. H. Nguyen and J. Sichaem, Nat. Prod. Res., 2024, 38(15), 2603–2608, DOI:10.1080/14786419.2023.2193746.
- N. H. Nguyen, Y. T. Vu, T. D. Nguyen, T. T. Cao, H. T. Nguyen, T. K. D. Le, J. Sichaem, D. T. Mai, T. N. M. An and T. H. Duong, RSC Adv., 2023, 13, 35408–35421, 10.1039/D3RA06760B.
- G. Xiong, Z. Wu, J. Yi, L. Fu, Z. Yang, C. Hsieh, M. Yin, X. Zeng, C. Wu, A. Lu, X. Chen, T. Hou and D. Cao, Nucleic Acids Res., 2021, 49, W5–W14, DOI:10.1093/nar/gkab255.
- M. Bitew, T. B. Tegene Demissie, A. Belayneh, M. Endale and R. Eswaramoorthy, PLoS One, 2021, 16(12), e0260853, DOI:10.1371/journal.pone.0260853.
- Y. Wang, J. Xing, Y. Xu, N. Zhou, J. Peng, Z. Xiong, X. Liu, X. Luo, C. Luo, K. Chen, M. Zheng and H. Jiang, Q. Rev. Biophys., 2015, 48, 488–515, DOI:10.1017/s0033583515000190.
- L. J. Shai, S. R. Magano, L. S. Lebelo and M. A. Mogale, J. Med. Plants Res., 2011, 5, 2863–2867 CAS.
- N. Duy, T. Ha, T. Phuong, N. Van Cuong and T. N. M. An, ChemistrySelect, 2023, 8, e202300246, DOI:10.1002/slct.202300246.
- T. C. Mai, N. T. Tran, D. T. Mai, T. T. N. Mai, N. H. T. Duyen, T. N. M. An, M. Alam, C. H. Dang and T. D. Nguyen, RSC Adv., 2022, 12, 25962–25976, 10.1039/D2RA04068A.
- S. U. Khan, N. Ahemad, L. H. Chuah, R. Naidu and T. T. Htar, Progress in Drug Discovery & Biomedical Science, 2020, 3(1), 1–21, DOI:10.36877/pddbs.a0000054.
- M. Y. Putra, G. Bavestrello, C. Cerrano, B. Renga, C. D'Amore, S. Fiorucci, E. Fattorusso and O. Taglialatela-Scafati, Steroids, 2012, 77, 433–440, DOI:10.1016/j.steroids.2011.12.026.
- T. Orita, S. Chogahara, M. Okuda, K. Sakao, T. Miyata and D. X. Hou, Foods, 2023, 12(13), 2611, DOI:10.3390/foods12132611.
- K. Eawsakul, P. Panichayupakaranant, T. Ongtanasup, S. Warinhomhoun, K. Noonong and K. Bunluepuech, Heliyon, 2021, 7(9), e08078, DOI:10.1016/j.heliyon.2021.e08078.
- G. Oboh, O. M. Agunloye, S. A. Adefegha, A. J. Akinyemi and A. O. Ademiluyi, J. Basic Clin. Physiol. Pharmacol., 2015, 26, 165–170, DOI:10.1515/jbcpp-2013-0141.
- K. Chen, C. Peng, F. Chi, C. Yu, Q. Yang and Z. Li, Front. Microbiol., 2022, 13 DOI:10.3389/fmicb.2022.885092.
- F. Kabir, S. Katayama, N. Tanji and S. Nakamura, J. Korean Soc. Appl. Biol. Chem., 2014, 57, 359–365, DOI:10.1007/s13765-014-4056-6.
Footnote |
| † Electronic supplementary information (ESI) available: HR-ESIMS, 1H and 13C-NMR, HSQC, HMBC of compound (1) and spectroscopic data of compounds (2), (3), (4), (5), (6), and (7) are available in the ESI file. See DOI: https://doi.org/10.1039/d4ra04405c |
| This journal is © The Royal Society of Chemistry 2024 |

