 Open Access Article
Simplistic approach to formulate an ionophore-based membrane and its study for nitrite ion sensing†
Chandrashekhar M. Ghorpade,
Govind G. Umarji,
Rohit A. Hanamsagar,
Sudhir S. Arbuj ,
Manish D. Shinde
 and
Sunit B. Rane
 *
*
Additive Manufacturing & Advanced Materials – Electronics & Energy (AM2-E2) Division, Centre for Materials for Electronics Technology, Off Pashan Road, Panchawati, Pune-411008, India. E-mail: sunit@cmet.gov.in; sunitrane@yahoo.com
First published on 23rd October 2024
Abstract
A polymeric membrane based on a N,N′-bis(salicylidene)ethylenediaminocobalt(II) complex as a cobalt ionophore (CI) was fabricated and optimized for nitrite ion sensing application. The membrane contained CI, 2-nitrophenyl octyl ether (2-NPOE) as a plasticizer and hexadecyl trimethyl ammonium bromide (HTAB) as a cationic additive in a polyvinyl chloride (PVC) matrix. The Nernstian slope (−0.020 mV per decade), detection limit (1 × 10⁻⁷ M to 3 M), and response (107 milliseconds) and recovery (22 milliseconds) times were recorded for optimum membrane composition. The ionophore functionality in the polymer matrix and their interaction were studied using Fourier-transform infrared spectroscopy (FTIR), powder X-ray diffraction (PXRD), environmental scanning electron microscopy (ESEM), energy-dispersive X-ray spectroscopy (EDS), and optical microscopy analyses.
1. Introduction
In general, agriculture systems are nitrogen (N) deficient and hence critically hamper plant growth. Although nitrogen exists in soil, its availability is seriously influenced by a biological process called the nitrogen cycle. The N–N-cycle process depends on climatic conditions, the type of soil and its physical and chemical properties. Globally, industrialization and expansion of humanity have had a tremendous impact on the environment, leading to erosion and majorly reduced fertile lands. Additionally, owing to the solubility of nitrite in water and its low holding capacity by soil, it easily reaches down to the sublayer of the soil, thus polluting groundwater and ultimately threatening human health. These dynamics of the N-cycle and the addition of fertilizers can help improve the quality of soil and plant cultivation. The correct fertilizer application rate for N is the key to preventing all adverse effects. Nitrogen in soil is sporadically transformed into different forms, of which nitrite (NO2−) is mostly responsible for overall plant growth. At present, several direct and indirect techniques are available to quantify nitrite levels, viz. atomic absorption spectroscopy, colorimetric assays, UV and IR spectroscopy, X-ray fluorescence spectroscopy, and potentiometry.1 Moreover, fluorescence-based methods are one of the effective methods for nitrite detection. Liang et al. successfully developed a fluorescence sensor for the on-site visual detection of an analyte such as nitrite.2 However, these techniques use sophisticated instruments; require separate soil sampling procedures, soil-specific calibration, and skilled labour-intensive analysis; and are time-consuming considering the unsuitability for real-time in situ deployment. Additionally, their fabrication requires quartz, expensive glassware, hazardous chemicals, and a very complex construction process with excessively expensive equipment.3 Therefore, a cost-effective, field-accessible nitrite (NO2−) sensing technology needs to be developed to continuously monitor precise fertilizer applications and the health of soil. Ion selective membrane (ISM)-based technology features simple operation and easy construction, making it one of the prime choices for detection.4,5 An ionophore-based ion selective electrode (ISE) offers a reliable, portable, easy-to-use, and accurate analysis method. It consists of an aqueous inner filling solution that serves as an ion reservoir for the internal reference electrode and enables the maintenance of constant reference potential. Ultimately, an ISE offers potential as a point-of-care device because it is simple to use, portable, and yields immediate results.3 It typically detects more than seventy different analytes and is sub-classified as glass membranes, inorganic salt crystal-based membranes, and polymer-based membranes, depending on the type of application.6 Polymeric ISM has received great attention due to its simple, cheap, and mobile use for many practical applications.7 The selective sensing of anion/cation through polymeric membranes is achieved by appropriate ion carriers (ionophores), additives, and plasticizers.8 Although, by the 1970s, such membranes had become popular, to date, there has been limited research on developing ionophores to enhance the selectivity, particularly cobalt-based ionophores, for nitrite sensing. Early studies were performed by Schulthess et al. on lipophilic derivatives of B12, i.e., cobalt(III) complex-based polymeric membrane, for the detection of nitrite in dried cured meat.9 Later on, Li et al. synthesized cobalt phthalocyanine derivatives as a neutral carrier for nitrite-sensitive membranes for the determination of nitrite in cabbage. Subsequently, researchers have reported membrane-based Co(III) aquocyanocobyrinate,10 Co(III)–tetraphenylporphyrin chloride and nitrite derivatives,11 Co(II)salen,12 derivatives of (tetraphenylporphyrinato)cobalt(III)acetate,13 poly(pyrrole-cobalt(II)deuteroporphyrin),14 cobalt(II) salophen,15 cobalt(III) corrole,16,17 cobalt(II)tert-butylsalophen ionophore,18 salophen Co(III) acetate ionophore,19 cobalt(II)-Schiff base complex,20 and Co(III) complex of Schiff base derivative21 for enhancing the sensitivity and selectivity related to nitrite detection. Recently, Mahmud et al. published a comprehensive overview of the recent progress in sensing nitrate, nitrite, phosphate, and ammonia in aquatic environments and crucial problems significantly affecting the analytical performance of the sensor. However, very few reports are available on cobalt(II) ionophores. Also, there is a scarcity of reports on cobalt(II) ionophores with varying concentrations as nitrite ion sensing membranes.In this work, a facile nitrite selective electrode fabrication process using a polymeric membrane containing a variable amount of CI to achieve an optimum composition for nitrite ion sensing was studied.
2. Experimental section
2.1. Materials, chemicals and solutions
The reagents used for the preparation of the electrode membrane are dry tetrahydrofuran (THF), high molecular weight PVC, 2-NPOE, HTAB, sodium nitrite, sodium carbonate, sodium chloride, sodium hydroxide, potassium bromide, potassium iodide and potassium nitrate, which were obtained from Sigma Aldrich. All aqueous solutions were prepared with the salt of the highest purity available and using Millipore Milli-Q® deionized water (>18.2 MΩ cm). For each anion, 3 mol L−1 stock solutions were prepared using sodium salts. The dilute solutions (3 to 10−7 mol L−1) were prepared by dilution of the stock standard solutions.The N,N′-bis(salicylidene)ethylenediaminocobalt(II) base complex (Fig. 1), as an ionophore, was obtained from Sigma Aldrich and used with no further purification. For the membrane preparation and characterization, all chemicals and solvents were purchased from commercial suppliers (Sigma Aldrich) and used without further purification.
2.2. Electrode preparation
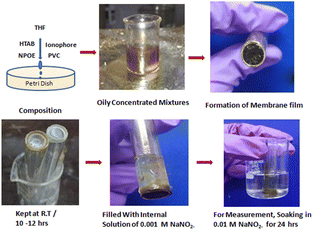
The nitrite ISM electrodes were prepared in a classical method described by Ganjali et al.12 The appropriate mass ratio of the commercial N,N′-bis(salicylidene)ethylenediaminocobalt(II) base complex, i.e., CI, PVC, 2-NPOE, and HTAB were dissolved in dry THF (see Table 1 for the compositions) for 48 hours at room temperature to form a homogeneous blend. Subsequently, open-ended glass tubes (10 mm diameter) were dipped in each cocktail for 20 seconds to form a membrane electrode and kept overnight, i.e., 12 hours, at room temperature to allow evaporation of the organic solvent. The thickness of the resultant membrane was measured (0.235 mm ± 0.005 mm) by using the micrometre screw gauge (the thickness measurement data are given in ESI S1†). Once the membrane electrode was dried, an internal solution (the solution filled inside the glass tubes) (1 × 10⁻³M NaNO2−) was poured from the other side of the glass tube. The sealing tape was applied at the interface of the membrane and glass to avoid internal solution leakage from the side wall. Finally, all membrane electrodes were conditioned by soaking in 1 × 10⁻² M NaNO2− for 24 hours before the measurement. Fig. 2 represents the complete illustrative steps involved in the ISM electrode formation.| S. no. | Membrane code | PVC (g) | 2-NPOE (g) | CI complex (g) | HTAB (g) | Dry THF (ml) |
|---|---|---|---|---|---|---|
| 1 | M15 | 0.33 | 0.48 | 0.08 | 0.1 | 30 |
| 2 | M0 | 0.33 | 0.46 | 0.10 | 0.1 | 30 |
| 3 | M1 | 0.33 | 0.44 | 0.13 | 0.1 | 30 |
| 4 | M4 | 0.33 | 0.42 | 0.15 | 0.1 | 30 |
| 5 | M7 | 0.33 | 0.40 | 0.17 | 0.1 | 30 |
| 6 | M10 | 0.33 | 0.40 | Absent | 0.1 | 30 |
2.3. EMF measurement
Fig. 3 depicts the system integrated with a multichannel Data Acquisition (DAQ) system to measure the EMF of the analyte ranging from 1 × 10⁻⁷ M to 3 M at room temperature using the following assembly.| Ag (s)|AgCl (s)|KCl (aq) 3 M‖ analyte solution or test solution (aq)|ISM| internal solution or (aq)|KCl 3 M|AgCl (s)|Ag (s), |
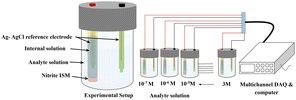 | ||
| Fig. 3 Schematic representation of the developed potentiometric EMF measurement setup integrated with multichannel DAQ for an analyte ranging from 1 × 10⁻⁷ M to 3 M. | ||
Also, the cross-selectivity of the developed membrane was studied with six analytes ((Co)32−, Cl−, OH−, Br−, I− and NO3−) to verify the selective nature of the nitrite membrane.
2.4. Typical sensing principle for ISE
In potentiometric measurements, a two-electrode galvanic cell transforms the input ionic signal into a quantifiable electronic potential. A voltmeter with high input impedance and a low input bias current is typically used to measure the electromotive force (EMF), which is the electrical potential difference between the reference electrode (RE) and the working electrode (WE). This procedure is passive, low-power consuming, and does not consume or contaminate the sample because it does not include a redox reaction or the need for an external driving force. Based on total equilibrium assumptions, the phase-boundary potential model provides an intelligible description of the potential response of ISEs. The primary ion activity determines the charge separation at the solution|membrane interface, where the measured potential ideally originates.This principle involves the equilibrium partitioning of principal ions and surface chemisorption without requiring substantial transmembrane material transfer. The chemical driving force in the sample solution (Gibbs free energy) supplies the energy needed for charge separation. As a result of the ISMs' ion selectivity and permselectivity, the principal ion can freely enter and exit the membrane phase. An electrochemical equilibrium is reached by the free diffusion of charged ions when chemical driving forces balance the opposing electrical coulombic driving forces. The electrical potential difference is the result of the formation of an electrical double layer at the solution|membrane contact at this point. This equilibrium will rapidly return in the event of a change in primary ion activity, and the phase boundary potential (EPB) at the solution–membrane interface will likewise alter in accordance, as indicated by the equation below.
 | (1) |
 | (2) |
2.5. FTIR, PXRD, optical microscopy, ESEM-EDAX characterization
ATR-IR spectra were recorded using a Shimadzu IR Affinity Fourier transform infrared (FT-IR) spectrophotometer equipped with a Deuterated L-Alanine Triglycine Sulphate (DLATGS) detector. The spectra were recorded at a step size resolution of 1.92 cm−1. The membrane with and without CI was mounted on an attachment for ATR measurements within the sample compartment of the FTIR spectrophotometer. Crystallographic studies of membranes were carried out using a Rigaku Miniflex X-ray powder diffractometer having Cu-Kα radiation λ = 0.15418 nm. The scan rate of 0.16° s−1 was applied to record the patterns in the 2θ range of 5–60°. Optical surface topography of membranes, PVC, and HTAB were captured using an Olympus DSX 1000 at 5× magnification. Elemental analysis of the membrane was conducted using the EDAX model (ESEM Quanta 200-3D).3. Results and discussion
3.1. Fourier transform infrared (FT-IR) spectroscopy
The membrane surfaces with and without CI were studied to reveal the chemical constituents present in the membranes, as shown in Fig. 4. The evidence of constituents like 2-NPOE, HTAB, PVC and CI were observed at the corresponding peaks. In Fig. 4a, the membranes M0, M1, M4, and M7 consist of CIs, and M10 is without CI. The comparison between membrane M10 and as-procured CI is shown in Fig. 4b. The peaks at 462.92 cm−1,23 588 cm−1,24 and 656.34 cm−1,25 1625 cm−1,26 1192 cm−1 and 1137 cm−1 (ref. 27) were attributed to the Co–N (stretching vibrations), Co–O (rocking vibrations), C![[double bond, length as m-dash]](https://www.rsc.org/images/entities/char_e001.gif) N (stretching vibrations), C
N (stretching vibrations), C![[double bond, length as m-dash]](https://www.rsc.org/images/entities/char_e001.gif) C (aromatic stretching vibrations) and C–H (aromatic stretching vibrations), respectively. However, these peaks were absent in M10. All the peaks in M10 correspond to only PVC, HTAB and 2-NPOE. All constituting chemicals were present in the other membranes. The sharp peaks of 2-NPOE at 2924.08 cm−1,28 1521.83 cm−1, 1350.17 cm−1,29 and 742.59 cm−1 were attributed to the –CH2, NO2, C–N and C–H stretching vibrations, respectively. Subsequently, peaks for HTAB and PVC were attributed at 2848.86 cm−1,30 1462.04 cm−1,31 960.55 cm−1, and 719.44 cm−1,32 1425 cm−1, 1257.40 cm−1 and 688 cm−1 & 615 cm−1,33 corresponding to the C–H bond stretching vibrations, asymmetric stretching vibrations of N+, –CH3, –CH vibrations of CH3 and Br−, and the C–H rocking and C–H wagging modes, respectively. The individual FTIR spectra for CI, 2-NPOE, HTAB, and PVC are presented in ESI (Fig. S2†).
C (aromatic stretching vibrations) and C–H (aromatic stretching vibrations), respectively. However, these peaks were absent in M10. All the peaks in M10 correspond to only PVC, HTAB and 2-NPOE. All constituting chemicals were present in the other membranes. The sharp peaks of 2-NPOE at 2924.08 cm−1,28 1521.83 cm−1, 1350.17 cm−1,29 and 742.59 cm−1 were attributed to the –CH2, NO2, C–N and C–H stretching vibrations, respectively. Subsequently, peaks for HTAB and PVC were attributed at 2848.86 cm−1,30 1462.04 cm−1,31 960.55 cm−1, and 719.44 cm−1,32 1425 cm−1, 1257.40 cm−1 and 688 cm−1 & 615 cm−1,33 corresponding to the C–H bond stretching vibrations, asymmetric stretching vibrations of N+, –CH3, –CH vibrations of CH3 and Br−, and the C–H rocking and C–H wagging modes, respectively. The individual FTIR spectra for CI, 2-NPOE, HTAB, and PVC are presented in ESI (Fig. S2†).
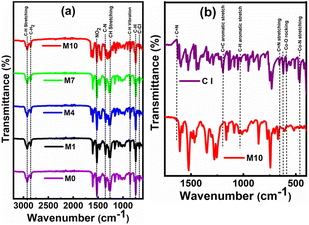 | ||
| Fig. 4 (a) FTIR spectra (3200–600 cm−1) of the membrane with the content of CI (M0, M1, M4, and M7) and without the content of CI (M10). (b) FTIR spectra (1750–450 cm−1) of CI and the membrane M10. | ||
3.2. Powder X-ray diffraction
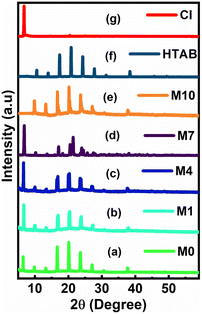
The powder X-ray diffraction patterns for the membrane with (M0, M1, M4, and M7) and without (M10) CI contents are shown in Fig. 5a–g. The diffraction patterns of the membranes showed the peaks of HTAB. The XRD peaks at around 2θ = 6° reveal that the ionic carrier CI is present in only M0, M1, M4 and M7, while M10 does not show the presence of CI. From the graph, it is observed that as the concentration of CI increases, the peak intensity also increases.3.3. ESEM and EDS elemental analysis
ESEM high and low magnification micrograph for the polymer membrane with (M1) and without (M10) CI is shown in Fig. 6. The membrane with CI, PVC, 2-NPOE and HTAB shows (Fig. 6a and b) a uniform distribution of the filler ionophore; however, without CI, it shows uniform surface morphology compared to a membrane containing CI. It has been found in Fig. 6c and d that a smooth surface without any phase separation occurred for the PVC, HTAB, and 2-NPOE polymer membranes. The surface morphology of other compositions remains unchanged, as there are only minor variations in the M0, M4 and M7 samples. To avoid the repetitiveness in the figures, only representative figures are given here. To detect the presence of CI on the surface of the membranes, EDS analysis was conducted for the M0, M1, M4, M7, and M10 samples, as shown in Fig. 7. The increasing order (quantitatively) of Co concentration (in wt%) in the CI membranes has been observed as per the experimental composition shown in Table 1.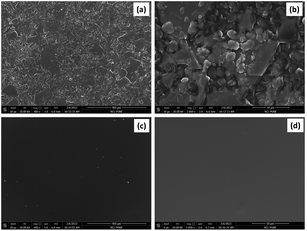 | ||
| Fig. 6 (a) Low and (b) high magnification surface morphologies of membranes with CI and (c) low and (d) high magnification surface morphologies of the membrane without CI. | ||
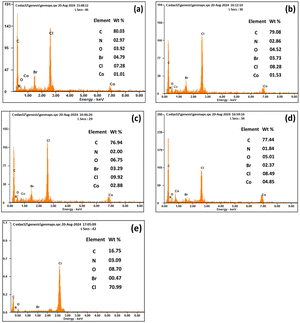 | ||
| Fig. 7 Quantitative EDS analysis with CI (a) M0, (b) M1, (c) M4, (d) M7 and without the CI membrane (e) M10. | ||
The remaining common peaks of N, Br, and Cl due to the presence of 2-NPOE, HTAB, and PVC, respectively, were all present in both membranes. No additional peaks were observed in the membrane.
3.4. Surface topography
The optical microscopy of the membrane surface was performed to understand the microstructural interaction of all ingredients. Fig. 8a and b shows a low-magnification optical surface scan image of M1 and M10 membranes.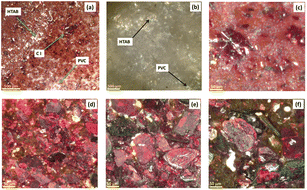 | ||
| Fig. 8 Optical microscopy images for the membrane (a) with CI and (b) without CI at low magnification scan; (c) M0, (d) M1, (e) M4, (f) and M7 at high magnification scan. | ||
Fig. 8a displays different color textures of CI, PVC, 2-NPOE and HTAB of the M1 membrane, while Fig. 8b corresponds to the M10 membrane, showing the monotonous color texture of HTAB, 2-NPOE, and PVC. These colored textures were referenced and identified in the film based on the individual optical images of the membrane ingredients separately (please see ESI (Fig. S3†)). It is also observed that as the concentration of CI increases in the M0, M1, M4, and M7 compositions, the density of the CI crystal increases in the membrane, as depicted in Fig. 8c–f.
3.5. EMF response characteristic and dynamic response time behaviour of the sensor
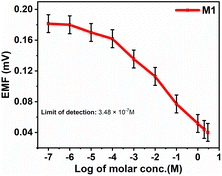
The investigation of PVC-based CI membranes of five compositions (M15, M0, M1, M4, M7) has shown that they act as nitrite ion-selective sensors, while the virgin membrane (M10, without CI) does not show any performance. The EMF response of M15, M0, M1, M4, M7 and M10 in Fig. 9a indicates their Nernstian behaviour over the wide concentration range of NaNO2−. The polymeric membrane electrode with the composition M1 showed the widest detection limit in terms of concentration from 1 × 10⁻⁷ M (lower sensing limit of the membrane sensor corresponds to 0.18 mV) to 3 M (upper sensing limit of the membrane sensor corresponds to 0.04 mV). For other membranes, the corresponding concentration range and their detection limits in terms of EMF are shown in Table 2.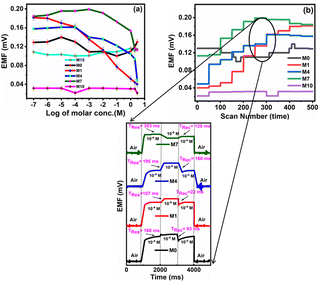 | ||
| Fig. 9 (a) EMF characteristic and (b) dynamic response time of the nitrite ISE based on variable CI wt% (M0, M1, M4, M7) and virgin M10 (inset). | ||
| S. no. | Membrane code | Working conc. Range (M) | Slopes (mV per decade) | Detection limit in mV | Res. time (ms) | Rec. time (ms) | |
|---|---|---|---|---|---|---|---|
| EMFa | EMFb | ||||||
| a Lower detection limit (conc. in M).b Upper detection limit (conc. in M). | |||||||
| 1 | M15 | 1 × 10⁻⁷ to 3 | — | — | — | — | — |
| 2 | M0 | 1 × 10⁻⁷ to 3 | −0.0024 | 0.14 (1 × 10⁻⁵) | 0.10 (1 × 10⁻¹) | 168 | 93 |
| 3 | M1 | 1 × 10⁻⁷ to 3 | −0.0208 | 0.18 (1 × 10⁻⁷) | 0.04 (3) | 107 | 22 |
| 4 | M4 | 1 × 10⁻⁷ to 3 | −0.0117 | 0.16 (1 × 10⁻⁴) | 0.09 (1 × 10⁻²) | 195 | 160 |
| 5 | M7 | 1 × 10⁻⁷ to 3 | −0.0088 | 0.19 (1 × 10⁻³) | 0.15 (1) | 303 | 125 |
The improved performance behaviour of M1 over M15, M0, M4, M7 and M10 presumably originated from the distribution of CI in the polymer matrix arranged in such a way compared to the lower and higher concentrations of CI.
The graph of M1 validates the linear response as compared to M15, M0, M4 and M7. The membrane M10 (without CI) does not show the sensing of nitrite ions due to the absence of an ionic carrier. However, as the concentration of CI increases or decreases with reference to the CI optimum arrangement, the performance towards the nitrite ions becomes non-linear (M15, M0, M4, and M7) over the sensing range. In terms of linearity, only M1 showed a good linear curve. Table 3 indicates the error values for the M0, M1, M4 and M7 membranes for each concentration by taking several measurements and calculating using the equation  (SE = standard error, σ = standard deviation, n = no. of samples).
| Conc. (M) | Error values for the membranes | ||||
|---|---|---|---|---|---|
| M15 | M0 | M1 | M4 | M7 | |
| 3 | 3.49927 × 10⁻⁶ | 4.21165 × 10⁻⁶ | 6.22837 × 10⁻⁶ | 8.08122 × 10⁻⁷ | 4.76047 × 10⁻⁶ |
| 2 | 1.28986 × 10⁻⁵ | 7.60285 × 10⁻⁶ | 9.11375 × 10⁻⁶ | 6.35835 × 10⁻⁶ | 4.80213 × 10⁻⁶ |
| 1 | 4.99848 × 10⁻⁵ | 6.71429 × 10⁻⁶ | 4.53782 × 10⁻⁶ | 3.43107 × 10⁻⁶ | 1.64528 × 10⁻⁶ |
| 1 × 10⁻¹ | 6.85452 × 10⁻⁶ | 2.88897 × 10⁻⁵ | 4.69694 × 10⁻⁶ | 5.50510 × 10⁻⁶ | 8.29758 × 10⁻⁶ |
| 1 × 10⁻² | 1.05405 × 10⁻⁶ | 9.86411 × 10⁻⁵ | 5.14952 × 10⁻⁵ | 3.89337 × 10⁻⁶ | 4.43557 × 10⁻⁶ |
| 1 × 10⁻³ | 9.44712 × 10⁻⁵ | 1.79705 × 10⁻⁶ | 6.10680 × 10⁻⁶ | 9.60017 × 10⁻⁷ | 1.61624 × 10⁻⁶ |
| 1 × 10⁻⁴ | 8.98525 × 10⁻⁷ | 3.05394 × 10⁻⁶ | 6.54878 × 10⁻⁶ | 4.19144 × 10⁻⁶ | 6.79069 × 10⁻⁶ |
| 1 × 10⁻⁵ | 8.43318 × 10⁻⁵ | 6.70766 × 10⁻⁵ | 3.43202 × 10⁻⁶ | 1.40698 × 10⁻⁶ | 3.28522 × 10⁻⁶ |
| 1 × 10⁻⁶ | 8.37118 × 10⁻⁶ | 4.96592 × 10⁻⁵ | 5.96760 × 10⁻⁶ | 4.56258 × 10⁻⁶ | 8.52770 × 10⁻⁶ |
| 1 × 10⁻⁷ | 8.03467 × 10⁻⁵ | 7.35818 × 10⁻⁵ | 1.00489 × 10⁻⁵ | 7.71619 × 10⁻⁶ | 9.91392 × 10⁻⁷ |
For analytical applications, the response time of the membrane sensor is an important factor. The dynamic response time of the electrode membrane was tested by sequentially changing the test solution from 1 × 10⁻⁷ M to 3 M.
The average time required for the electrode to reach a potential response from 1 × 10⁻⁴ M to 1 × 10⁻⁵ M (i.e. an order change in concentration) of the final stable values of sequential immersion in a series of nitrite ion solutions and vice versa represent the response (Tres) and recovery times (Trec) times of the fabricated sensor. M1 shows better response (Tres) and recovery (Trec) times of 107 ms and time of 22 ms, respectively, than M0 (Tres = 168 ms, Trec = 93 ms), M4 (Tres = 195 ms, Trec = 160 ms) and M7 (Tres = 303 ms, Trec = 125 ms) (Fig. 9b). The potential generated by the developed sensor remained stable for more than 56 min, after which the data were recorded.
A comparison of data in Table 2 shows that the M1 membrane shows better response characteristics in comparison to M15, M0, M4 and M7.
3.6. Study of linear correlation of EMF of M1 membrane
The Nernst equation-based graph of emf vs. logarithm of analyte concentration for M1, as shown in Fig. 10, indicates the Nernstian response, which denotes optimal sensitivity. When the graph is linear at 298.15 K, with a slope of 59.16 mV per decade for one ion charged, 29.58 mV per decade for two ions charged, and 19.72 mV per decade for three ions charged, Nernstian response is observable.34The nitrite ISE fabricated with CI showed a good Nernstian response towards nitrite ions with a slope of −0.020 mV per decade in the concentration range from 1 × 10⁻⁷ to 3 M (lower to higher). The limit of detection was found to be 3.48 × 10⁻⁷ M. For the other interference anions, no response was observed.
3.7. Real sample test
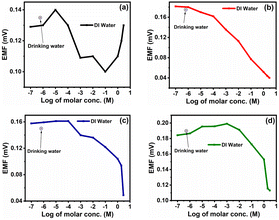
The fabricated ISEs (M0, M1, M4 and M7) were tested in drinking water, which was pre-processed at Pune city by a filtration plant to remove solid particles from the samples. The drinking water supplied to Pune city was used for real-time measurement of ISEs. The typical concentration of nitrite in drinking water is 1 mg L−1 (≈9.56 × 10⁻⁶ M).35For testing, the membranes M0, M1, M4 and M7 were analysed in the same drinking water and the corresponding EMF values generated for the membranes M0, M1, M4 and M7 were 0.135, 0.175, 0.149 and 0.189 (all values in mV), respectively. These values are shown with respect to the NaNO2− concentration in DI water in Fig. 11.
3.8. Selectivity of the membrane
The selectivity is one of the crucial characteristics of ion-selective membranes. Typically, selectivity coefficients KA,B are used to characterize how interfering ions affect the response behavior of ion-selective membrane electrodes. Among the most often used techniques for determining potentiometric selectivity coefficients are those based on the Nicolsky–Eisenman equation (e.g., fixed interference and fixed analytical ion approaches).36 The selectivity of the proposed membranes was investigated by the Fixed Interfering Method (FIM).5,37 The selectivity was calculated using eqn (3) by evaluating the selectivity coefficient from the potential measured on a solution containing a fixed concentration of nitrite ions.
 | (3) |
| Ions | Selectivity coefficient | |||
|---|---|---|---|---|
| M0 | M1 | M4 | M7 | |
| (Co)32− | 3.46 × 10⁻⁵ | 2.57 × 10⁻⁶ | 2.01 × 10⁻⁴ | 2.01 × 10⁻³ |
| Cl− | 3.15 × 10⁻⁵ | 3.00 × 10⁻⁶ | 2.14 × 10⁻⁴ | 2.09 × 10⁻³ |
| OH− | 2.62 × 10⁻⁵ | 2.36 × 10⁻⁶ | 1.96 × 10⁻⁴ | 1.89 × 10⁻³ |
| Br− | 2.69 × 10⁻⁵ | 2.30 × 10⁻⁶ | 2.04 × 10⁻⁴ | 2.23 × 10⁻³ |
| I− | 2.41 × 10⁻⁵ | 2.43 × 10⁻⁶ | 2.33 × 10⁻⁴ | 2.13 × 10⁻³ |
| NO3− | 2.01 × 10⁻⁵ | 3.19 × 10⁻⁶ | 2.85 × 10⁻⁴ | 1.98 × 10⁻³ |
| NO2− | 1.56 × 10⁻⁵ | 1.63 × 10⁻⁶ | 1.79 × 10⁻⁴ | 1.34 × 10⁻³ |
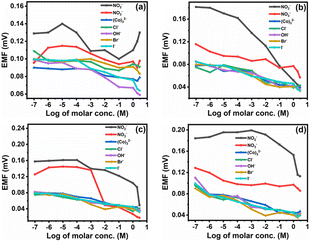 | ||
| Fig. 12 Potentiometric response of the nitrite selective membrane (a) M0, (b) M1, (c) M4, and (d) M7 towards different ions. | ||
The selectivity coefficient of the nitrite ion selective membrane depends on several factors, such as the nature and composition of CI, origin of the ionic effect, hydrogen and electrostatic binding, and coordination action of species to form the complex matrix. As the concentration of CI increases or decreases from a particular concentration, its selectivity coefficient also changes. Additionally, the usage of polar 2-NPOE plasticizer increases the reaction of the CI carrier with divalent ions as opposed to the monovalent ions suggested by the Born model.
Since the dielectric constant of the plasticizer influences the reaction of charged species, as shown in Table 4, the NO2− is the most actively interacting species with the electrode membrane.
3.9. Cycling stability of the electrode
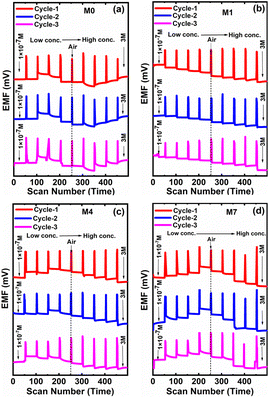
Herein, we studied the cycling stability for four CI-based membrane electrodes in the same analytes with varying (i.e., 1 × 10⁻⁷ to 3 M) concentrations. The sensor measurements, in the presence of a molar concentration of NaNO2−, were repeated three times in order to assess the repeatability in terms of cycling stability of their responses. Fig. 13 shows the cycling studies of four membranes, M0, M1, M4 and M7. Among the four membranes, M1 displayed good repeatability toward three cycling tests and a stable response for 30 days without obvious degradation. As the concentration decreases, the corresponding EMF also decreases. Ultimately, M1 membrane shows the linearity in the baseline values for each cycle of the graph (Fig. 13b).When switching from one molar solution to another solution, the air gap is generated, as shown in Fig. 13. M0, M4, and M7 give consistent responses while using their molar concentrations, but the EMF generated across the different concentrations was not linear.
4. Sensing mechanism
ISE's working concentration range, sensitivity, selectivity, and cycling stability are dependent on the quantity and kind of electrode components. These are the (i) ionophore's quantity (ii) plasticizer and (iii) lipophilic additive.38 The major role of ionophores in ISE's is to attach as well to transport ions across a membrane. The sensitivity and selectivity of ISE's are dependent on the amount of ionophore present.The increasing amount of ionophore in the ISE's results in the sensing capacity of the membrane and thus impacts the electrode behavior. With the further addition of ionophore, the membranes become saturated and show a decrease in the electrode response. Beyond a certain point, increasing the concentration of the ionophore may result in the loss of selectivity of the electrodes.38–40
With respect to the plasticizer component, the quantity of the plasticizer affects the response time of ISE's. The polymer chain's flexibility and the rate at which the metal ions diffuse throughout the polymeric matrix alter when a plasticizer is added. A lower concentration of the plasticizer makes sure the polymer chains are less flexible, which causes the metal ions to diffuse from the aqueous phase into the polymer phase more slowly and insufficiently. Furthermore, not all of the ionophore's active sites are able to interact with the metal ions at low plasticizer concentrations. As a result, there is a lower interaction that is free of energy shift. However, every active site of the ionophore interacts with the metal ions at the optimum plasticizer concentration. Thus, the activities of the metal ions in the test solution are reflected in the maximum equilibrium potential that is recorded. The response time is also reduced at this plasticizer concentration because all of the ions may interact with the ionophore in a short amount of time. The electrode's sensitivity and selectivity are often reduced as the amount of plasticizer in the membrane is further increased, which results in a lower magnitude of equilibrium potential. The working range of such types of membranes is really significantly reduced by the excess plasticizer molecules, which reduce the ionophore activity in the membrane. Thus, these membranes become insensitive to targeted ions.
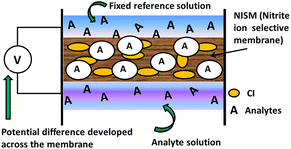
In the present study, we propose a sensing mechanism (Fig. 14) for nitrite ISE's made up of plasticizer 2-NPOE, additive HTAB and CI and are filled with an internal solution with a fixed concentration of sodium nitrite (0.01 M) for each membrane measurement. The membrane contains a nitrite-sensitive organic molecule that selectively binds and transports NO2− ions. All membranes can be operated in the same environment and under the same conditions. For the membranes M15, M0, M1, M4, and M7, the nitrite ions will begin to diffuse across the membrane from the side of higher concentration to the side of lower concentration and achieve equilibrium. Owing to the diffusion phenomenon, the positive nitrite ions are moved across the membranes, building up a positive charge (cations) inside the membrane and increasing the negative charge (anions) outside. An electrical potential difference is created across the membrane due to charges on its surface. At equilibrium, the membrane potential is mainly dependent on the concentration of the target ion outside the membrane; the measured voltage is proportional to the logarithm of the activity (effective concentration) of the ions in solution.
To directly compare the sensing performance and mechanisms of potentiometric types of ion-selective electrodes (M15, M0, M1, M4, and M7), monitoring the potentiometric changes during the analyte measurement can give us information about the membrane's potential in terms of EMF. As the concentration of the analyte ions changes, the membrane potential follows a Nernstian behavior. The potentiometry tests of all ISE's showed almost the same trend (as the concentration decreases, the EMF increases). In the case of membranes M15 and M0, the concentration of the ionophore (CI) and plasticizer (2-NPOE) is lower and higher, respectively, than that of membrane M1 (see Table 1). For the membrane M15, there was a slight response toward the nitrite ions. For the concentration, the EMF generated for a lower (1 × 10⁻⁷ M) to higher (3 M) concentration was 0.108625 mV to 0.110945 mV. There was no significant change for the lower to higher concentration (Fig. 9a), which may be due to the low concentration of ionophores. In the case of membrane M0, the concentration of CI is high and there was considerable change in the graph compared to membrane M15. From the curve of membrane M0, it was observed that the membrane showed a linear characteristic from 1 × 10⁻⁵ to 1 × 10⁻¹ M solution. Again, EMF starts increasing from the molar concentration 1 × 10⁻¹ M.
Now, in the case of membranes M4 and M7, the concentrations of the ionophore and plasticizers are comparatively lower and higher, respectively, than those of membrane M1. In the potentiometric study of membrane M4, the EMF generated across 1 × 10⁻⁷ M to 1 × 10⁻⁴ M increases but after 1 × 10⁻⁴ M, it starts to decrease and changes the Nernstian behaviour of the electrode. In membrane M7, the EMF generated is higher than that in M4. From the concentration 1 × 10⁻³ M, the EMF generated across the testing solutions starts to decrease. In both membranes M4 and M7, after the particular concentration, the EMF decreases, which may be due to the lower amount of plasticizer molecules. In the potentiometric study of M1, the EMF generated across the lower to higher concentration shows a linearly decreasing trend. The sensitivity of the ion-selective membrane electrode is expressed as the slope in millivolts per decade of activity/concentration. In terms of slope, the magnitude of M1 showed a higher value, which ensures that M1 is the most sensitive to nitrite ions compared to other membranes. All membranes contain the same amount of additive HTAB. Among the five membranes, the chemical weight ratio for M1 was found to be best compatible with the potentiometric results.
5. Conclusions
Different membranes based on CI for the determination of nitrite (NO2−) ions were prepared using the dip coating method to evaluate optimum nitrite selective applications. The developed membrane performs better in comparison to other membranes, including the virgin membrane, over a wide concentration range of 1 × 10⁻⁷ M to 3 M. The membrane M1 showed the best performance in a wide concentration range of 1 × 10⁻⁷ M to 3 M and exhibited Nernstian compliance of −0.020 mV per decade of activity. This work concludes that the optimum composition based on the CI membrane is stable and reliable with selective response over different common analytes with excellent response and recovery times of 107 ms and 22 ms, respectively. It is anticipated that these observations will be useful for applications and further work related to this area.Data availability
The data supporting this article have been included as part of the ESI.†Author contributions
Chandrashekhar M. Ghorpade and Govind G. Umarji: conceptualization, Chandrashekhar M. Ghorpade and Rohit A. Hanamsagar: methodology, Chandrashekhar M. Ghorpade and Sudhir S. Arbuj: investigation, Chandrashekhar M. Ghorpade, and Govind Umarji: writing and original draft preparation, Sunit B. Rane and Manish: writing, review and editing.Conflicts of interest
There are no conflicts to declare.Acknowledgements
The author CG acknowledges CSIR-UGC, New Delhi, for the award of JRF and SRF.References
- N. Pourreza, M. Reza and A. Hatami, Microchem. J., 2012, 104, 22–25 CrossRef CAS.
- H. Liang, Y. Wang, L. Zhang, Y. Cao, M. Guo, Y. Yu and B. Lin, Sens. Actuators, B, 2022, 373, 132764 CrossRef CAS.
- Z. F. Akl, Electroanalysis, 2017, 29, 1459–1468 CrossRef CAS.
- K. Xu, Y. Liu, G. A. Crespo and M. Cuartero, Electrochim. Acta, 2022, 427, 140870 CrossRef CAS.
- M. A. Zayed, W. H. Mahmoud, A. A. Abbas, A. E. Ali and G. G. Mohamed, RSC Adv., 2020, 10, 17552–17560 RSC.
- G. A. Crespo, Electrochim. Acta, 2017, 245, 1023–1034 CrossRef CAS.
- M. G. Motlagh, M. A. Taher and A. Ahmadi, Electrochim. Acta, 2010, 55, 6724–6730 CrossRef CAS.
- A. F. Molina-Osorio, G. A. Crespo and M. Cuartero, Electrochim. Acta, 2024, 484, 144039 CrossRef CAS.
- P. Schulthess, D. Ammann, B. Kräutler, C. Caderas, R. Stepánek and W. Simon, Anal. Chem., 1985, 57, 1397–1401 CrossRef CAS.
- U. Schaller, E. Bakker, U. E. Splchiger and E. Pretsch, Anal. Chem., 1994, 66, 391–398 CrossRef CAS.
- E. Malinowska and M. E. Meyerhoff, Anal. Chim. Acta, 1995, 300, 33–43 CrossRef CAS.
- M. R. Ganjali, M. Rezapour, M. R. Pourjavid and M. Salavati-Niasari, Anal. Sci., 2003, 19, 1127–1131 CrossRef CAS PubMed.
- M. Shamsipur, M. Javanbakht, A. R. Hassaninejad, H. Sharghi, M. R. Ganjali and M. F. Mousavi, Electroanalysis, 2003, 15, 1251–1259 CrossRef CAS.
- S. Cosnier, C. Gondran, R. Wessel, F. P. Montforts and M. Wedel, Sensors, 2003, 3, 213–222 CrossRef CAS.
- M. R. Ganjali, S. Shirvani-Arani, P. Norouzi, M. Rezapour and M. Salavati-Niasari, Microchim. Acta, 2004, 146, 35–41 CrossRef CAS.
- S. Yang and M. E. Meyerhoff, Electroanalysis, 2013, 25, 2579–2585 CrossRef CAS PubMed.
- V. K. Gupta, R. N. Goyal, A. K. Jain and R. A. Sharma, Electrochim. Acta, 2009, 54, 3218–3224 CrossRef CAS.
- B. Néel, M. Ghahraman Asfhar, G. A. Crespo, M. Pawlak, D. Dorokhin and E. Bakker, Electroanalysis, 2014, 26, 473–480 CrossRef.
- G. A. Crespo, M. Ghahraman Afshar, N. Barrabés, M. Pawlak and E. Bakker, Electrochim. Acta, 2015, 179, 16–23 CrossRef CAS.
- M. Parsaei, Z. Asadi and S. Khodadoust, Sens. Actuators, B, 2015, 220, 1131–1138 CrossRef CAS.
- H. Yilmaz, A. Kocak, M. Dilimulati, Y. Zorlu and M. Andac, J. Chem. Sci., 2017, 129, 1559–1569 CrossRef CAS.
- Y. Shao, Y. Ying and J. Ping, Chem. Soc. Rev., 2020, 49, 4405–4465 RSC.
- H. R. Jia, J. Li, Y. X. Sun, J. Q. Guo, B. Yu, N. Wen and L. Xu, Crystals, 2017, 7, 247 CrossRef.
- R. Elamathi, R. Ramesh, M. Aravinthraj, M. Manivannan, F. Liakath Ali Khan, K. Mphale, D. Letsholathebe, K. Kaviyarasu, J. Kennedy and M. Maaza, Surf. Interfaces, 2020, 20, 100582 CrossRef CAS.
- O. A. Fouad, S. A. Makhlouf, G. A. M. Ali and A. Y. El-Sayed, Mater. Chem. Phys., 2011, 128, 70–76 CrossRef CAS.
- A. A. Shiryaev, A. N. Goncharenko, T. M. Burkhanova, L. E. Alkhimova, M. G. Babashkina, R. Chandrasekaran and D. A. Safin, J. Iran. Chem. Soc., 2021, 18, 2897–2911 CrossRef CAS.
- Y. Song, M. Zhang, T. Liu, T. Li, D. Guo and X. X. Liu, Nanomaterials, 2019, 9, 1110 CrossRef CAS PubMed.
- D. Wang, J. Hu, Y. Li, M. Fu, D. Liu and Q. Chen, J. Membr. Sci., 2016, 501, 228–235 CrossRef CAS.
- A. Mancilla-Rico, J. de Gyves and E. Rodríguez de San Miguel, Membr. J., 2021, 11, 401 CrossRef CAS PubMed.
- F. Ai, G. Zhao, W. Lv and J. Lin, Mater. Res. Express, 2020, 7, 085008 CrossRef CAS.
- S. A. Elfeky, S. E. Mahmoud and A. F. Youssef, J. Adv. Res., 2017, 8, 435–443 CrossRef CAS PubMed.
- R. K. Banjare, M. K. Banjare and S. Panda, J. Solution Chem., 2020, 49, 34–51 CrossRef CAS.
- S. Ramesh, K. H. Leen, K. Kumutha and A. K. Arof, Spectrochim. Acta, Part A, 2007, 66, 1237–1242 CrossRef CAS PubMed.
- R. P. Buck and E. Lindner, Pure Appl. Chem., 1994, 66, 2527–2536 CAS.
- Nitrate and Nitrite in Drinking-Water: Background Document for Development of WHO Guidelines for Drinking-Water Quality, World Health Organization, Geneva, 2nd edn, 1998, Addendum to vol. 2. Health criteria and other supporting information Search PubMed.
- H. Karami, M. Fazlollah, M. Shamsipur, I. Yavari, A. A. Alizadehl and M. F. Mousavi, Anal. Lett., 2003, 36, 1065–1078 CrossRef CAS.
- K. R. Bandi, A. K. Singh, Kamaluddin, A. K. Jain and V. K. Gupta, Electroanalysis, 2011, 23, 2839–2850 CrossRef CAS.
- V. Kumar, R. Suri and S. Mittal, J. Iran. Chem. Soc., 2023, 20, 509–540 CrossRef CAS.
- E. Bakker, P. Bühlmann and E. Pretsch, Chem. Rev., 1997, 97, 3083–3132 CrossRef CAS PubMed.
- K. C. Gupta and M. J. D'Arc, Anal. Chim. Acta, 2001, 437, 199–216 CrossRef CAS.
Footnote |
| † Electronic supplementary information (ESI) available. See DOI: https://doi.org/10.1039/d4ra04590d |
| This journal is © The Royal Society of Chemistry 2024 |


