 Open Access Article
Porous hydrogel microspheres with excellent temperature-sensitive, magnetic and fluorescent properties for drug delivery†
Shilin Tang,
Chen He,
Haie Zhu *,
Zhenyang Wen,
Xiaoling Zhang,
Qifeng Liu,
Bo Tang
 *,
Tian Xia
 and
Chaolong Yang
College of Materials Science and Engineering, Chongqing University of Technology, Chongqing 400054, China. E-mail: zhuhaie@cqut.edu.cn; tangbo@cqut.edu.cn
First published on 22nd October 2024
Abstract
Porous hydrogel microspheres with temperature-sensitive, magnetic and fluorescent properties have great potential for drug delivery. In this study, porous hydrogel microspheres with excellent temperature-sensitive, magnetic and fluorescent properties were prepared through droplet microfluidics and photoinitiated radical polymerization, which were characterized via scanning electron microscopy (SEM), vibrating sample magnetometry (VSM), fluorescence spectroscopy, ultraviolet spectrophotometry, and other techniques. The volumetric phase-transition temperature of porous hydrogel microspheres was in the range of 40–45 °C, and the volume swelling ratio reached 5.26 as the temperature decreased from 55 °C to 25 °C. Meanwhile, the saturation magnetization and optimal fluorescence emission wavelength of porous hydrogel microspheres were 1.79 emu g−1 and 616 nm, respectively, which can be an effective strategy to visually monitor and control the speed of drug release during magnetic heat therapy. Finally, bovine serum albumin (BSA) was employed as a model drug to investigate the drug loading and release of porous hydrogel microspheres. The maximal drug loading amount was 238 mg g−1, and the drug release speed and amount can be correspondingly promoted by altering the temperature.
1. Introduction
Hydrogels with stimulus-responsive functions have great potential in the fields of diagnostics, drug delivery, tissue engineering, biosensors and bioseparation.1–8 Recently, multi-functional hydrogels with temperature–magnetic and magnetic-light dual responsiveness have received extensive attention.9–14 Temperature, magnetic field and light responsive behaviors are beneficial for the potential application in the areas of controlled drug-release,15,16 intelligent drug delivery and magnetic hyperthermia,11 and biolabeling,12–14 respectively. However, there are problems associated with the application of multi-functional hydrogels in the biomedical field owing to their high critical responsive temperature, low magnetism, poor photostability, serious photobleaching, and toxic photolysis products of fluorescent materials.Porous hydrogel microspheres can act as excellent drug microcarriers in the biomedical field15,16 owing to their advantages of high efficiency, superior drug loading capacity, and sustained release ability to maintain effective drug levels in the body, among others.17–22 Meanwhile, porous hydrogel microspheres with responsive functions can intelligently release loaded drugs via external microenvironmental stimulation, such as temperature,23 magnetic field,24 electric field,25 and light.26 The traditional method to fabricate porous hydrogel microspheres is based on monomer-containing droplets under mechanical stirring and subsequent polymerization.27,28 However, the obtained hydrogel microspheres often exhibit poor monodispersity, which will cause great uncertainty and instability of drug release when applied as drug carries in clinical treatment.29,30 Recently, microfluidic techniques have been used to fabricate hydrogel microspheres with one or dual property of temperature-responsiveness, magnetism or fluorescence because of the advantages of an adjustable size and excellent monodispersity.11,15,31–33 However, it is hard to fabricate tri-functional hydrogel microspheres with a simultaneous tunable porous structure, low critical responsive temperature, high magnetism and excellent fluorescent properties. The multiple combination of these advantages is hardly reported and will promote the clinical application of hydrogel microspheres in drug delivery and monitoring.
In this paper, porous hydrogel microspheres were prepared through seed emulsifier-free emulsion polymerization and subsequent microfluidic technology for drug delivery, with poly(N-isopropyl acrylamide), Fe3O4 nanoparticles and rare earth fluorescent monomers as raw materials, which have tri-functionalities, namely, low critical transition temperature, high magnetism and excellent fluorescent properties. Herein, instead of using poor photostable fluorescent dye and toxic QDs as fluorescent probes in the preparation of hydrogels,12–14 the rare-earth fluorescent probe Eu(AA)3Phen was adopted, which simultaneously has stable and strong red fluorescence as well as biocompatibility.34,35 Besides, the prepared porous hydrogel microspheres not only have excellent temperature–magnetic field responsive properties but also a three-dimensional porous structure. In the seed emulsifier-free emulsion polymerization process, Fe3O4 nanoparticles were successively covered by polystyrene and poly(Eu(AA)3Phen) to obtain the P(St-co-Eu(AA)3Phen) nanospheres, where the polystyrene coating served an important role in protecting the luminescent shell from quenching by the Fe3O4 core. Subsequently, porous hydrogel microspheres were prepared through the microfluidic method with an aqueous solution containing P(St-co-Eu(AA)3Phen) nanospheres, N-isopropyl acrylamide, photo-initiator, and N,N-methylenebisacrylamide as the dispersed phase. The volumetric phase-transition temperature (VPTT) of porous hydrogel microspheres is in the range of 40–45 °C, and their pore sizes can be regulated by the size and addition amount of nanospheres in the dispersed phase, which endow them tunable drug-loading amount and drug-releasing rate. Finally, their drug release speed and amount can be correspondingly promoted by controlling the temperature, which will be developed as an effective strategy to visually monitor and control the drug release speed during the magnetic heat therapy.
2. Results and discussion
2.1 Preparation of porous hydrogel microspheres
The schematic diagram of the preparation of porous hydrogel microspheres is shown in Fig. 1a. When the dispersed phase and continuous phase meet at the cross-intersection of the microfluidic chip, the continuous phase on both sides shears the dispersed phase in the horizontal channel into water-in-oil (W/O) spherical microdroplets. The microdroplets composed of Fe3O4/P(St-co-Eu(AA)3Phen) nanospheres, NIPAM, BIS, photoinitiator (Irgacure 2959) and water were dispersed in the continuous phase made of the surfactant (KF-6017) and silicone oil (KF-96). Under UV irradiation (365 nm), the photoinitiator generate free radicals to induce the polymerization of NIPAM and BIS to obtain porous hydrogel microspheres, which encapsulate a large number of Fe3O4/P(St-co-Eu(AA)3Phen) nanospheres.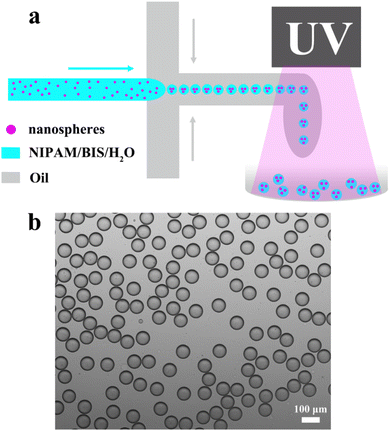 | ||
| Fig. 1 (a) Schematic of the preparation of porous hydrogel microspheres. (b) Microscopic image of hydrogel microdroplets. | ||
The microfluidic method is advantageous for preparing monodisperse and size-controllable microspheres. As shown in Fig. 1b, the microdroplets with a uniform diameter of 99.4 μm were formed when the flow rates of the continuous phase and dispersed phase were 20 μL min−1 and 5 μL min−1, respectively. Besides, the size of the microdroplets can be controlled by the flow rates. As shown in Fig. S1†, when the flow rate of the dispersed phase is fixed at 5 μL min−1, the diameter of the microdroplets gradually decreases from 110 μm to 58 μm as the flow rate of the continuous phase increases from 15 μL min−1 to 40 μL min−1. This is because the faster flow rate of the continuous phase will generate greater shear force on the dispersed phase, resulting in the formation of smaller droplets. On the other hand, when the flow rate of the continuous phase is fixed at 30 μL min−1, the diameter of the microdroplets gradually increases from 65 μm to 129 μm when the flow rate of the dispersed phase increases from 2 μL min−1 to 17 μL min−1. This is due to the fact that the faster flow rate of the dispersed phase increases the volume of the sheared microdroplet when the shear force is kept constant. The results confirm that the size of the microdroplets can be controlled by the flow rate of the dispersed phase and continuous phase, correspondingly, the diameter of the porous hydrogel microspheres can also be regulated.
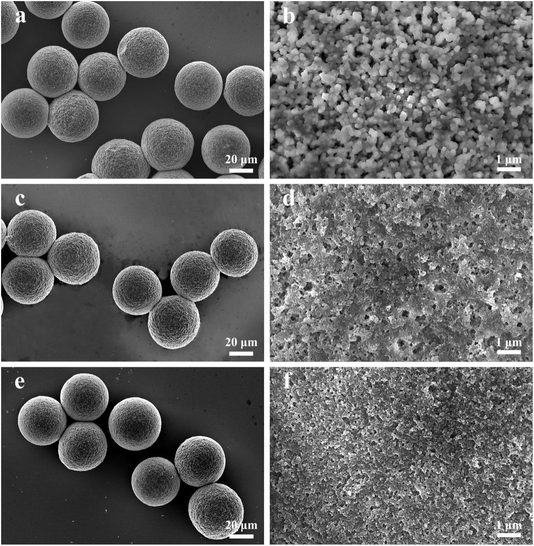
Fig. 2 shows the SEM images of the porous hydrogel microspheres A10C5, A15C5 and A20C5 in the solid state, which were dried overnight at 30 °C in an oven. Fig. 2a, c and e indicate that the porous hydrogel microspheres of A10C5, A15C5 and A20C5 have uniform and nearly the same size under the same flow rates, whose average diameters are 42.54 μm, 42.85 μm and 43.44 μm, respectively. From Fig. 2b, d and f, it can be observed that A10C5, A15C5 and A20C5 all have dense pore-like structures, which is formed by the evaporation of water in the hydrogel microspheres. The average pore diameters measured for A10C5, A15C5, A20C5 were 180 nm, 120 nm and 50 nm, respectively. Fig. S2† provides the SEM images of A15C2 and A15C8 in the solid state. The average diameters of A15C2 and A15C8 are about 41.75 μm and 48.28 μm, respectively, under the same flow rate. The average pore diameters of A15C2 and A15C8 analyzed from Fig. S2(b and d)† are 150 nm and 40 nm, respectively. The decrease in the pore sizes of A15C2, A15C5, and A15C8 from 150 nm to 40 nm is due to the increased amount of nanospheres A15 added in the dispersed phase. More added amount of A15 particles results in more tightly aligned A15 particles inside the porous hydrogel microspheres, correspondingly, the pore size becomes smaller.
The BET surface areas and adsorption average pore diameters of the vacuum freeze-dried A15C2, A15C5, and A15C8 samples were analyzed with a surface area and porosity analyzer based on the nitrogen adsorption and desorption isotherms. The nitrogen adsorption–desorption isotherms are shown in Fig. S3†, with the hysteresis loops reflecting that all of the tested samples have porous structures. The analyzed BET surface areas of A15C2, A15C5, A15C8 are 0.38 m2 g−1, 1.78 m2 g−1, 3.09 m2 g−1, and the adsorption average pore diameters (4V/A by BET) are 1213 nm, 157 nm, 43 nm, respectively. The average pore diameters of the three samples acquired by BET are larger than that analyzed from the SEM images, the probable reason is that the free-dried samples here have less agglomeration compared to the above hot-dried samples for SEM.
2.2 FTIR and XRD characterization
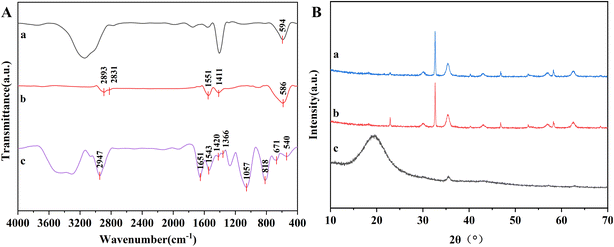
The FTIR spectra of Fe3O4, OA/NaUA-Fe3O4 and porous hydrogel microspheres A15C8 are shown in Fig. 3A. The absorption peaks at 594 cm−1 were attributed to the Fe–O bond in Fe3O4. For OA/NaUA-Fe3O4, the characteristic peaks at 1551 cm−1 and 1411 cm−1 were assigned to the C![[double bond, length as m-dash]](https://www.rsc.org/images/entities/char_e001.gif) C bond in NaUA and –COO− in OA, and the peaks at 2831 cm−1 and 2893 cm−1 were assigned to the stretching vibrations of the C–H bond of –CH2 and –CH3, demonstrating the successful modification of OA and NaUA on the surface of Fe3O4. For A15C8, the absorption peaks at 671 cm−1 and 818 cm−1 were attributed to the out-of-plane bending vibration of the benzene ring in PSt. The peak at 1057 cm−1 was caused by the bending vibration of the C–C bond. The absorption peaks at 1366 cm−1 and 1420 cm−1 originated from the isopropyl groups in PNIPAM. The peaks at 1543 cm−1 and 1651 cm−1 come from the bending vibration of the N–H bond and stretching vibration of C
C bond in NaUA and –COO− in OA, and the peaks at 2831 cm−1 and 2893 cm−1 were assigned to the stretching vibrations of the C–H bond of –CH2 and –CH3, demonstrating the successful modification of OA and NaUA on the surface of Fe3O4. For A15C8, the absorption peaks at 671 cm−1 and 818 cm−1 were attributed to the out-of-plane bending vibration of the benzene ring in PSt. The peak at 1057 cm−1 was caused by the bending vibration of the C–C bond. The absorption peaks at 1366 cm−1 and 1420 cm−1 originated from the isopropyl groups in PNIPAM. The peaks at 1543 cm−1 and 1651 cm−1 come from the bending vibration of the N–H bond and stretching vibration of C![[double bond, length as m-dash]](https://www.rsc.org/images/entities/char_e001.gif) O in PNIPAM and poly(N,N-methylenebisacrylamide). Besides, the characteristic absorption peaks of Fe–O at 540 cm−1 can be also observed in curve c of Fig. 3A. The FTIR results confirm the successful combination of magnetic nanoparticles with the thermosensitive polymers.
O in PNIPAM and poly(N,N-methylenebisacrylamide). Besides, the characteristic absorption peaks of Fe–O at 540 cm−1 can be also observed in curve c of Fig. 3A. The FTIR results confirm the successful combination of magnetic nanoparticles with the thermosensitive polymers.
The XRD patterns of Fe3O4 (a), OA/NaUA-Fe3O4 (b), and A15C8 (c) are presented in Fig. 3B. In curve a of Fig. 3B, there were six characteristic diffraction peaks at 2θ = 30.1°, 35.5°, 43.1°, 56.8° and 62.5°, which correspond to the (220), (311), (400), (511) and (440) crystalline planes of Fe3O4, respectively, indicating that the face-centered cubic Fe3O4 magnetic nanoparticles were successfully synthesized. These peaks also existed in the OA/NaUA-Fe3O4 sample, besides, a small peak at 22.9° was observed, which corresponds to the (210) crystalline plane of the slight oxidation product Fe2O3. The XRD pattern of A15C8 exhibited a broad diffusion pattern at low 2θ, which is due to the amorphous polymer coating on the Fe3O4 particles. Besides, the small peak at 2θ = 35.5° in curve c indicates that a certain amount of Fe3O4 particles is encapsulated in the A15C8 sample. Other diffraction peaks of Fe3O4 are rarely observed because the thick polystyrene and PNIPAM layer on the surface of Fe3O4 hinders the penetration and diffraction of X-rays.
2.3 Magnetic property of porous hydrogel microspheres
Fig. 4 shows the hysteresis loops of porous hydrogel microspheres. Fig. 4a demonstrates that the saturation magnetizations of A15C2, A15C5, and A15C8 are 0.63, 0.66, and 0.74 emu g−1, respectively. It can be concluded that the increase in the A15 amount results in a slight increase in the saturation magnetization. As shown in Fig. 4b, as magnetic and fluorescent nanospheres A10, A15, and A20 with the concentration of 5 wt% were added to the dispersed phase, the saturation magnetizations of A10C5, A15C5, and A20C5 increase more significantly, which are 0.28, 0.66, and 1.79 emu g−1, respectively. This is because the initial increase of the added amount of magnetic nanoparticles for preparing A10, A15, and A20 samples (see Table 2 in Section 4.2) results in more Fe3O4 nanoparticles to be encapsulated in the porous hydrogel microspheres. All the samples are superparamagnetic with no magnetic remnants at small applied magnetic fields, which is crucial for their application in biomedical areas like targeted delivery and magnetic heat therapy.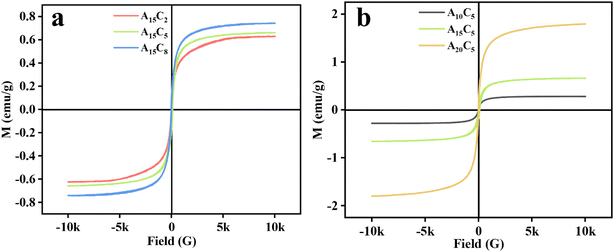 | ||
| Fig. 4 Hysteresis loops of porous hydrogel microspheres: (a) A15C2, A15C5, and A15C8; (b) A10C5, A15C5, and A20C5. | ||
2.4 Fluorescence properties of porous hydrogel microspheres
The fluorescence properties of porous hydrogel microspheres were characterized by inverted fluorescence microscopy and excitation and emission spectroscopy. As shown in Fig. 5, the optimal excitation and emission wavelength of all the samples are correspondingly located at about 276 nm and 616 nm, which originate from the characteristic absorption of the Phen ring and emission of Eu3+.36 Fig. 5a and b show that the vivid red luminescence of A15C5 are visually observed under 488 nm light irradiation. From Fig. 5c and d, it can be found that the fluorescence intensity of A15C2, A15C5 and A15C8 gradually increases because of the increase in the addition amount of magnetic and fluorescent nanospheres in the hydrogel microspheres. Fig. 5e and f show the excitation and emission spectra of A10C5, A15C5 and A20C5, which were prepared by adding 5 wt% magnetic fluorescent nanospheres A10, A15 and A20 in the dispersed phase, respectively. Results indicate that the fluorescence intensity of A10C5, A15C5 and A20C5 decreases with the increase in Fe3O4 nanoparticles added in the nanospheres A10, A15 and A20. Correspondingly, more Fe3O4 nanoparticles are encapsulated in A10, A15, A20 as well as A10C5, A15C5, A20C5, which will absorb more UV energy, giving rise to the fluorescence quenching effect.36 The results demonstrate that the porous hydrogel microspheres have good fluorescence properties, and their fluorescence intensity can be adjusted by the amount of magnetic and fluorescent nanospheres added in the dispersed phase and the amount of Fe3O4 nanoparticles encapsulated in the nanospheres.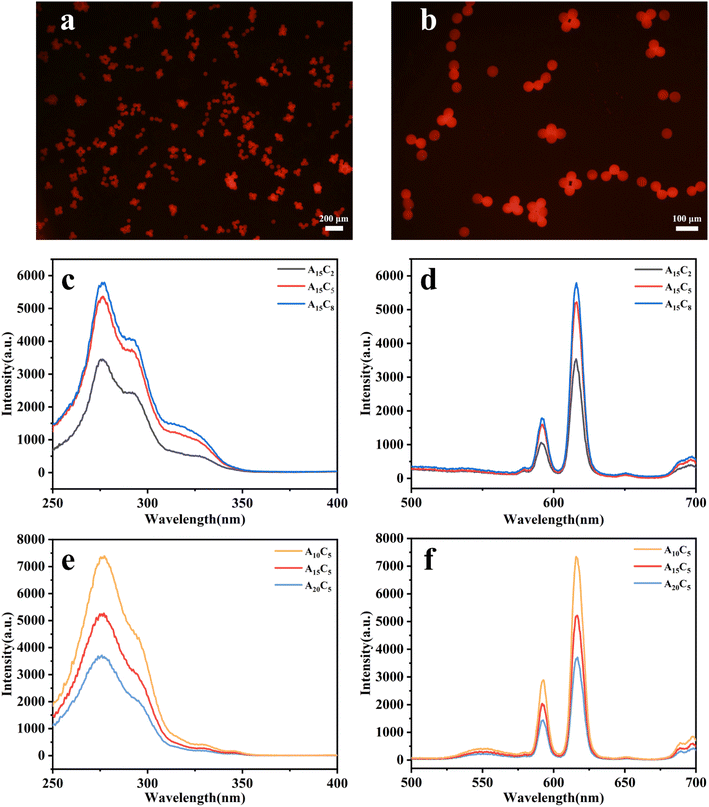 | ||
| Fig. 5 (a and b) Fluorescence micrographs of porous hydrogel microspheres; (c and e) excitation and (d and f) emission spectra of porous hydrogel microspheres. | ||
2.5 Temperature-sensitive properties of porous hydrogel microspheres
In this experiment, the diameters of porous hydrogel microspheres were tested at different temperatures to characterize their temperature-sensitive properties. The temperature at which the volume of the porous hydrogel microspheres changes most significantly is taken as their volumetric phase-transition temperature (VPTT). The relationships between the diameter of the porous hydrogel microspheres and temperature are shown in Fig. 6, which indicates that the diameter of the porous hydrogel microspheres gradually decreases with the increase in the temperature from 25 °C to 55 °C; however, the diameter hardly changes when the temperature exceeds 55 °C. Besides, the VPTT is located in the range of 40–45 °C. The temperature sensitivity of the porous hydrogel microspheres stems from the hydrophilic amide group and hydrophobic isopropyl group in their molecules. When the temperature is below VPTT, the amide group will form a hydrogen bond with water molecule, which promote the porous hydrogel microspheres to absorb water and swell. But when the temperature is above VPTT, the hydrogen bond will break. In this process, the hydrophobic isopropyl group plays a crucial role, which is manifested as the shrinkage hydrophobicity of porous hydrogel microspheres.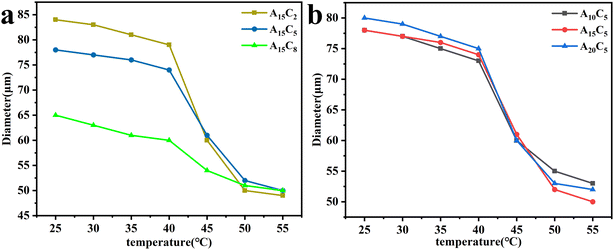 | ||
| Fig. 6 Effect of temperature on the diameter of porous hydrogel microspheres with (a) different concentration of A15 nanospheres and (b) different nanospheres (A10, A15, A20) of 5 wt% concentration. | ||
As shown in Table 1, the volume swelling ratios (V25°C/V55°C) of A15C2, A15C5, and A15C8 gradually decreases from 5.26 to 2.22 when the addition amount of A15 nanospheres increases from 2 wt% to 8 wt% in the dispersed phase. This is because that the increase amount in the A15 nanosphere in the porous hydrogel microspheres reduces the pores of porous hydrogel microspheres, as depicted in Section 2.1. However, when A10, A15, and A20 with the concentration of 5 wt% were added to the dispersed phase, the changes in the volume swelling ratios are not significant. The results show that the porous hydrogel microspheres have good temperature sensitivity, their volume swelling ratios can be adjusted by the amount of nanospheres added in the dispersed phase and the maximum volume swelling ratio (Table 1) reaches up to 5.26. Typically, the optical microscope images of A15C5 at different temperature from 25 °C to 55 °C shown in Fig. S4(a–g)† directly confirms the changes in the size with temperature. The excellent swelling and shrinking behaviors of porous hydrogel microspheres are beneficial for their potential applications as microcarriers (such as drugs, proteins, etc.) in biomedical fields.
| Samples | Swelling ratio | Samples | Swelling ratio |
|---|---|---|---|
| a The volume swelling ratio of porous hydrogel microspheres is calculated using its volume at 25 °C and 55 °C: V25°C/V55°C. | |||
| A15C2 | 5.26 | A10C5 | 3.22 |
| A15C5 | 3.80 | A15C5 | 3.80 |
| A15C8 | 2.22 | A20C5 | 3.70 |
2.6 Drug loading and release of porous hydrogel microspheres
The drug loading and release properties of porous hydrogel microspheres were studied using BSA as a model drug. When the temperature is below VPTT, the porous hydrogel microspheres absorb water and swell, and their porous structure can load a large number of BSA molecules. While when the temperature is above VPTT, the porous hydrogel microspheres contract, resulting in BSA molecules being squeezed out of their pores.The BSA loading capacity of porous hydrogel microspheres at 30 °C is shown in Fig. 7. As can be seen from Fig. 7a, the BSA loading capacity of A15C2, A15C5, and A15C8 gradually decreases from 238, 183, to 99 mg g−1 when the content of the nanospheres A15 in the dispersed phase increases from 2 wt% to 8 wt%. This is mainly due to the fact that the pores in the porous hydrogel microspheres become smaller with the increase amount in the submicron microspheres added in the dispersed phase (as depicted in Section 2.1), thus, the BSA loading capacity reduces. As shown in Fig. 7b, the BSA loading capacity of A10C5, A15C5, and A20C5 also gradually decreased from 201, 183, to 171 mg g−1 when A10, A15, and A20 with the concentration of 5 wt% were added to the dispersed phase. This is because that the decrease in the particle size of A10, A15 and A20 (Fig. S5†) in the dispersed phase reduces the pore size of the porous hydrogel microspheres, as depicted in Section 2.1.
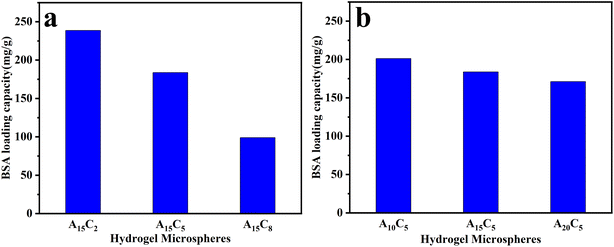 | ||
| Fig. 7 Drug loading capacity of porous hydrogel microspheres ,with (a) different concentration of A15 nanospheres and (b) different nanospheres (A10, A15, A20) of 5 wt% concentration. | ||
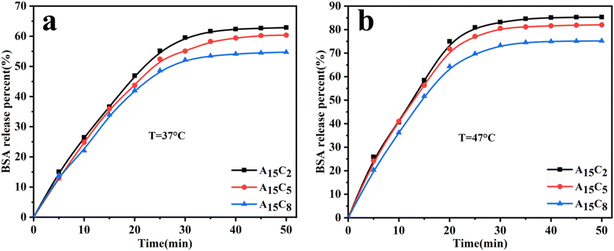
The BSA release behaviors of A15C2, A15C5, and A15C8 were investigated at 37 °C and 47 °C. As shown in Fig. 8, when the temperature increases from 37 °C to 47 °C, the time for the release equilibrium of these porous hydrogel microspheres becomes shorter; meanwhile, the cumulative release rate of BSA improves more than 20%, with the highest release percent reaching 85%. At 37 °C (the temperature is below VPTT), the porous hydrogel microspheres are in the swelling states; hence, the BSA is released mainly by diffusion. On the other hand, at 47 °C (the temperature is above VPTT), the porous hydrogel microspheres are in the contraction state; in this case, the release of BSA is not only achieved through diffusion but also by the extrusion arising from the contraction of molecular chains. Hence, more BSA molecules in the pores are released at 47 °C than that at 37 °C. As can be seen from Fig. 8, the BSA release rates of A15C2, A15C5, and A15C8 reduce sequentially, whether at 37 °C or 47 °C. This is ascribed to the sequentially reduced pore size of A15C2, A15C5, and A15C8 as well as the increased diffusion resistance of the BSA. The results show that the porous hydrogel microspheres can be used as a good carrier for drug or protein delivery.
3. Conclusion
In this paper, magnetic and fluorescent nanospheres Fe3O4/P(St-co-Eu(AA)3Phen) were prepared by soap-free emulsion polymerization, then they were mixed with a solution containing NIPAM monomer, BIS and photoinitiator to prepare the porous hydrogel microspheres with thermosensitive, magnetic and fluorescent properties by microfluidic technology and photoinitiated radical polymerization. The obtained porous hydrogel microspheres possess three-dimensional porous structures as well as the excellent monodispersity, magnetic properties, fluorescence properties, temperature-sensitive properties, and the volume swelling ratio V25°C/V55°C reached up to 5.26. The maximal saturation magnetization and maximal drug loading amount of the porous hydrogel microspheres were 1.79 emu g−1 and 238 mg g−1, respectively. Besides, the loading of BSA on the porous hydrogel microspheres and their release behaviors at different temperatures are studied; the BSA release percent reaches to 85% at 47 °C. The porous structure and excellent properties of the porous hydrogel microspheres indicate that they may have good application prospects as microcarriers for drug delivery.4. Experimental section
A two-step preparation process was adopted here to obtain the porous hydrogel microspheres. Firstly, Fe3O4/P(St-co-Eu(AA)3Phen) nanospheres were prepared by seed emulsifier-free emulsion polymerization, with Fe3O4 nanoparticles encapsulated by a thin layer of polystyrene in order to protect the luminescent Poly(Eu(AA)3Phen) shell from quenching by the magnetic core Fe3O4.36 Secondly, the magnetic and fluorescent Fe3O4/P(St-co-Eu(AA)3Phen) nanospheres were mixed with a certain amount of NIPAM, BIS, Irgacure 2959, and deionized water as the dispersed phase to prepare the porous hydrogel microspheres; the addition of the NIPAM monomer endows the microspheres with excellent thermosensitivity. In the first step, the Fe3O4/P(St-co-Eu(AA)3Phen) nanospheres with tunable diameter and magnetic property were obtained by adding a different amount of OA/NaUA-Fe3O4 nanoparticles. In the second step, porous hydrogel microspheres with tunable pore size and surface area were obtained by adding Fe3O4/P(St-co-Eu(AA)3Phen) nanospheres with different diameters and concentrations. The BSA loading and release experiments of the synthesized porous hydrogel microspheres were conducted to investigate the relationship between the pore size and the drug loading and releasing behavior. Detailed experiments are as follows.4.1 Materials
Styrene (St) and N,N-methylenebisacrylamide (BIS) were purchased from Shanghai Adamas Reagent Co., Ltd N-isopropyl acrylamide (NIPAM), photoinitiator Irgacure 2959, phosphate buffered saline (PBS) solution and bovine serum albumin (BSA) were purchased from Aladdin Reagent Co., Ltd. Potassium persulfate (KPS) was obtained from Shanghai Macklin Biochemical Technology Co., Ltd. Dimethyl silicone oil (KF-96) and emulsifier (KF-6017) were supplied by Shin-Etsu Chemical. Deionized water was homemade in the laboratory. Polytetrafluoroethylene (PTFE) tubing, standard cross-junction glass microfluidic chip with channels of 250 μm in width and 100 μm in depth, horizontal standard fixture (WH-CF-01), and microinjection pumps were purchased from Suzhou Wenhao Microfluidic Technology Co., Ltd. Syringes were obtained from Taizhou Mingan Medical Equipment Co., Ltd.Other materials like oleic acid (OA) and sodium undecylenate (NaUA)-modified Fe3O4 nanoparticles (OA/NaUA-Fe3O4) with a solid content of 7 wt% and the rare earth complex monomer Eu(AA)3Phen were prepared according to the previously published studies,36,37 and the preparation details were provided in the ESI.†
4.2 Preparation of the Fe3O4/P(St-co-Eu(AA)3Phen) nanospheres
Fe3O4/P(St-co-Eu(AA)3Phen) nanospheres were prepared by the seed emulsifier-free emulsion polymerization of St, Eu(AA)3Phen and OA/NaUA-Fe3O4 nanoparticles at 75 °C in nitrogen atmosphere using KPS as the initiator. Detailed experimental recipes are shown in Table 2. The prepared magnetic and fluorescent nanospheres were purified by centrifugation-ultrasonic dispersion-recentrifugation process, which were coded as A10, A15, A20 according to the added weight percentage of OA/NaUA-Fe3O4 based on the amount of H2O. As shown in Fig. S5†, the morphologies of the Fe3O4/P(St-co-Eu(AA)3Phen) nanospheres were observed by transmission electron microscopy (TEM), which verify that Fe3O4/P(St-co-Eu(AA)3Phen) nanospheres have a core–shell structure with Fe3O4 nanoparticles encapsulated in the core. The average diameters of A10, A15, and A20 statistically analyzed by a Nano Measurer, were 122 nm, 83 nm and 58 nm, respectively.| Sample | St (g) | OA/NaUA-Fe3O4 (g) | Eu(AA)3 phen (g) | KPS (g) | H2O (g) |
|---|---|---|---|---|---|
| A10 | 5 | 7.16 | 0.25 | 0.1 | 70 |
| A15 | 5 | 10.7 | 0.25 | 0.1 | 70 |
| A20 | 5 | 14.3 | 0.25 | 0.1 | 70 |
4.3 Preparation of porous hydrogel microspheres with multifunctional properties
In this study, uniform emulsion droplets on the micrometer scale were produced using a cross-junction microfluidic glass chip, which contains one main horizontal channel and two lateral channels. The microfluidic glass chip and PTFE tubings were assembled using a horizontal standard fixture. To prepare monodisperse emulsion droplets, dimethyl silicic oil (KF-96) with 20 wt% KF-6017 was used as the continuous phase, and an aqueous suspension was used as the dispersed phase. The aqueous suspension was prepared by mixing NIPAM (0.40 g), BIS (0.05 g), Irgacure 2959 (0.05 g), deionized water (5 g) and Fe3O4/P(St-co-Eu(AA)3Phen) nanospheres (0.10 g, 0.25 g and 0.4 g, which is 2 wt%, 5 wt% and 8 wt% based on the mass of water, respectively). The dispersed phase with the flow rate of 5 μL min−1 and the continuous phase with the flow rate of 20 μL min−1 were supplied to the horizontal and lateral microchannels through the PTFE tubing attached to the syringes operated by microinjection pumps, respectively. Then, water-in-oil (W/O) microdroplets with uniform size were obtained via the shear force from the symmetric flow field of the continuous phase. A plastic Petri dish containing the continuous phase was used to collect the generated microdroplets, which were solidified by exposure to UV light (365 nm) for 30 min for fabricating the porous hydrogel microspheres.The porous hydrogel microspheres were washed repeatedly with n-hexane to remove silicone oil and excess emulsifier on the surface and finally dispersed in deionized water. According to the above preparation process, a series of porous hydrogel microspheres was prepared employing different kinds of Fe3O4/P(St-co-Eu(AA)3Phen) nanospheres (A10, A15 and A20) or adjusting the mass fraction of the Fe3O4/P(St-co-Eu(AA)3Phen) nanospheres in the dispersed phase. When the addition amount of A10, A15, A20 nanospheres in the dispersed phase was 5 wt%, the prepared porous hydrogel microspheres were named as A10C5, A15C5 and A20C5, respectively. When A15 nanospheres with the concentration of 2 wt%, 5 wt%, and 8 wt% were correspondingly added in the dispersed phase, the obtained porous hydrogel microspheres were named as A15C2, A15C5, and A15C8, respectively.
4.4 Characterization
Transmission electron microscopy (TEM, Talos F200S) and field emission scanning electron microscopy (SEM, Zeiss Apreo 2S HiVac, Germany) were used to observe the microscopic morphology of the Fe3O4/P(St-co-Eu(AA)3Phen) nanospheres and porous hydrogel microspheres, respectively. The morphology of the microdroplets prepared by microfluidic technology was observed by an optical microscope (CX40P, China). The chemical structure of the Fe3O4 nanoparticles and hydrogel microspheres were characterized using Fourier transform infrared spectroscopy (FTIR, IRAffinity-1S, Japan). The XRD (X-ray diffraction) patterns for the magnetic particles and hydrogel microspheres powders were acquired on a PANalytical Empyrean Series2 (England) using Cu Kα radiation at a scanning rate of 6°/min. The BET surface area and adsorption average pore diameter of the hydrogel microspheres were acquired from an ASAP 2460 Surface Area and Porosity Analyzer using N2 as the adsorbing gas under a degassing temperature and time of 100 °C and 8 hours, respectively. A vibrating sample magnetometer (VSM, Lake Shore 7404, USA) was used to test the magnetic properties of the porous hydrogel microspheres. The fluorescence properties of the porous hydrogel microspheres were tested using an F-4700 fluorescence spectrophotometer (Japan) and an inverted fluorescence microscope (Nikon Ti-s, Japan). The polarizing microscope (CX40P, China) equipped with a hot stage was used to explore the size change of the porous hydrogel microspheres in deionized water under different temperatures.The average diameters of the Fe3O4/P(St-co-Eu(AA)3Phen) nanospheres, microdroplets, hydrogel microspheres and the pore size of the hydrogel microspheres were analyzed with a Nano Measurer 1.2 software. In detail, the optical, SEM, or TEM images of the samples were imported into the software and then the diameters of one hundred spheres or pores were measured from the images; subsequently, the average diameters of the samples were calculated from the statistical data.
4.5 Drug loading and release experiments
The drug loading and release properties of the porous hydrogel microspheres were investigated using BSA as a model drug. Firstly, a series of aqueous solutions of BSA with different concentrations was prepared; the absorbance of the BSA solution was tested by a UV-spectrophotometer (UH5300, Japan), then the standard curve was plotted according to the absorbance and corresponding concentrations of BSA (Fig. S6†). Secondly, a certain amount (5 mg) of porous hydrogel microspheres was dispersed into an aqueous solution of BSA (6 mL, 1.5 g L−1) and kept immersed at 30 °C for 24 h, and BSA could enter into the interior of the hydrogel microspheres. Subsequently, the absorbance of the supernatant at 280 nm was measured by a UV-spectrophotometer. Finally, the BSA loading amount of the hydrogel microspheres was calculated based on the standard curve with eqn (1).
 | (1) |
The hydrogel microspheres (5 mg) loaded with BSA were dispersed in phosphate-buffered saline (PBS) (6 mL, pH = 7.4) at 37 °C or 47 °C with gentle shaking for different time durations (0–50 minutes). Then, the absorbances of the supernatants were measured by a UV spectrophotometer every 5 minutes at the wavelength of 280 nm to investigate the release rate of BSA. The concentration and cumulative release rate of BSA were calculated according to the standard curve and eqn (2).
 | (2) |
Data availability
The data that support the findings of this study are available from the corresponding author upon reasonable request.Author contributions
Shilin Tang: methodology, investigation, formal analysis, writing – original draft. Chen He: methodology, investigation, formal analysis. Haie Zhu: writing – review & editing, conceptualization, supervision, methodology, funding acquisition. Wenzhen Yang: investigation. Xiaoling Zhang: data curation. Qifeng Liu: validation. Bo Tang: writing – review & editing, resources. Tian Xia: data curation. Chaolong Yang: formal analysis.Conflicts of interest
The authors declare no conflict of interest.Acknowledgements
This work is supported by the National Natural Science Foundation of China (Grant No. 51703125), the Science and Technology Research Project of Chongqing Municipal Education Commission (Grant No. KJQN202101126), Chongqing Natural Science Foundation of China (Grant No. CSTB2023NSCQ-MSX1016).References
- F. Rizzo and N. S. Kehr, Adv. Healthcare Mater., 2021, 10, 26 CrossRef PubMed.
- T. Dutta, P. Chaturvedi, I. Llamas-Garro, J. S. Velázquez-González, R. Dubey and S. K. Mishra, RSC Adv., 2024, 14, 12984 RSC.
- L. Li, J. M. Scheiger and P. A. Levkin, Adv. Mater., 2019, 31, 17 Search PubMed.
- M. Kubeil, Y. Suzuki, M. A. Casulli, R. Kamal, T. Hashimoto, M. Bachmann, T. Hayashita and H. Stephan, Adv. Healthcare Mater., 2024, 13, 2301404 CrossRef CAS PubMed.
- W. Zhang, X. Li, W. Chen, X. Huang, T. Hua, J. Hu, J. Zhu, S. Ye and X. Li, RSC Adv., 2024, 14, 18317 RSC.
- E. Bakaic, N. M. B. Smeets, H. Dorrington and T. Hoare, RSC Adv., 2015, 5, 33364 RSC.
- N. Ahmad, S. N. A. Bukhari, M. A. Hussain, H. Ejaz, M. U. Munir and M. W. Amjad, RSC Adv., 2024, 14, 13535 RSC.
- Y. Q. Almajidi, J. Gupta, F. S. Sheri, R. S. Zabibah, A. Faisal, A. Ruzibayev, M. Adil, M. J. Saadh, M. J. Jawad, F. Alsaikhan, A. Narmani and B. Farhood, Int. J. Biol. Macromol., 2023, 253, 127278 CrossRef CAS PubMed.
- Y. H. Wang, M. Zhong, L. Wang, Y. L. Liu, B. Wang and Y. Li, J. Drug Delivery Sci. Technol., 2019, 54, 101293 CrossRef CAS.
- Q. Cao, N. Liu, Y. S. Xiao, R. Huang, Y. Li and L. D. Wu, ACS Appl. Polym. Mater., 2021, 3, 1182–1189 CrossRef CAS.
- Z. Chen, S. Song, J. Ma, S. Da Ling, Y. D. Wang, T. T. Kong and J. H. Xu, Chem. Eng. Sci., 2022, 248, 117216 CrossRef CAS.
- D. D. Zhang, X. T. Tian, H. H. Li, Y. P. Zhao and L. Chen, Colloids Surf., A, 2021, 608, 125563 CrossRef CAS.
- Y. F. Hu, J. Liu, J. Y. Li, T. Chen and M. H. Wu, Anal. Methods, 2018, 10, 2384–2389 RSC.
- Z. W. Yang, S. B. Jin, C. Y. Zhang, J. Ren, W. X. Jing and X. Y. Wei, Chem. Eng. Sci., 2023, 281, 119082 CrossRef CAS.
- A. D. Drozdov and J. D. Christiansen, Polymer, 2021, 221, 123637 CrossRef CAS.
- L. Fan, X. X. Zhang, X. Y. Liu, B. Sun, L. Li and Y. J. Zhao, Adv. Healthcare Mater., 2021, 10, 2002249 CrossRef CAS PubMed.
- R. K. Kankala, J. Zhao, C. G. Liu, X. J. Song, D. Y. Yang, K. Zhu, S. B. Wang, Y. S. Zhang and A. Z. Chen, Small, 2019, 15, 1901397 CrossRef PubMed.
- M. Jeyhani, S. Y. Mak, S. Sammut, H. C. Shum, D. K. Hwang and S. S. H. Tsai, ChemPhysChem, 2018, 19, 2113–2118 CrossRef CAS PubMed.
- Y. Q. Dong, G. R. Jin, C. C. Ji, R. Y. He, M. Lin, X. Zhao, A. Li, T. J. Lu and F. Xu, Acta Biomater., 2017, 55, 410–419 CrossRef CAS PubMed.
- L. Zhang, H. P. Bei, Y. Piao, Y. F. Wang, M. Yang and X. Zhao, ChemPhysChem, 2018, 19, 1956–1964 CrossRef CAS PubMed.
- S. Hassan, G. Prakash, A. B. Ozturk, S. Saghazadeh, M. F. Sohail, J. Seo, M. R. Dokmeci, Y. S. Zhang and A. Khademhosseini, Nano Today, 2017, 15, 91–106 CrossRef CAS PubMed.
- J. B. Fan, J. Luo, Z. Luo, Y. Y. Song, Z. Wang, J. X. Meng, B. S. Wang, S. D. Zhang, Z. J. Zheng, X. D. Chen and S. T. Wang, ACS Nano, 2019, 13, 8374–8381 CrossRef CAS PubMed.
- Y. W. Hao, H. L. Liu, G. N. Li, H. J. Cui, L. Jiang and S. T. Wang, ChemPhysChem, 2018, 19, 2107–2112 CrossRef CAS PubMed.
- X. Z. Zhang, C. H. Tian, Z. R. Chen and G. Zhao, Adv. Ther., 2020, 3, 2000001 CrossRef CAS.
- V. H. Nguyen, R. Tabassian, S. Oh, S. Nam, M. Mahato, P. Thangasamy, A. Rajabi-Abhari, W. J. Hwang, A. K. Taseer and I. K. Oh, Adv. Funct. Mater., 2020, 30, 1909504 CrossRef CAS.
- C. M. Shao, J. J. Chi, L. R. Shang, Q. H. Fan and F. F. Ye, Acta Biomater., 2022, 138, 21–33 CrossRef CAS PubMed.
- S. Sayadnia, E. Arkan, R. Jahanban-Esfahlan, S. Sayadnia and M. Jaymand, J. Polym. Res., 2021, 28, 1–13 CrossRef.
- I. Nkurikiyimfura, Y. M. Wang and Z. D. Pan, Renewable Sustainable Energy Rev., 2013, 21, 548–561 CrossRef CAS.
- J. Zhang, Z. H. Yang, H. S. Zhang, Z. Hua, X. Y. Hu, C. T. Liu, B. X. Pi and Y. F. Han, Langmuir, 2019, 35, 16893–16899 CrossRef CAS PubMed.
- M. Martínez-Sanz, M. J. Gidley and E. P. Gilbert, Soft Matter, 2016, 12, 1534–1549 RSC.
- X. Dong, J. J. Chi, C. M. Shao, L. J. Lei, L. Yang, C. Zhao and H. Liu, Chem. Eng. J., 2021, 421, 127873 CrossRef CAS.
- G. Ciarleglio, S. Vella, E. Toto and M. G. Santonicola, Ceram. Int., 2023, 49, 24517–24524 CrossRef CAS.
- A. Z. Taravatfard, C. Ceballos-Gonzalez, A. Siddique, J. Bolivar-Monsalve, M. Madadelahi, G. T. D. Santiago, M. M. Alvarez, A. K. Pramanick, E. M. Guerra, L. Kulinsky, M. J. Madou, S. O. Martinez and M. Ray, Nanoscale, 2023, 15, 16277–16286 RSC.
- Y. F. Xie, W. M. He, F. Li, T. S. H. Perera, L. Gan, Y. C. Han, X. Y. Wang, S. P. Li and H. L. Dai, ACS Appl. Mater. Interfaces, 2016, 8, 10212–10219 CrossRef CAS PubMed.
- L. K. Wu, F. Yang, Y. J. Xue, R. L. Gu, H. Liu, D. D. Xia and Y. S. Liu, Mater. Today Bio., 2023, 19, 100595 CrossRef CAS PubMed.
- H. Zhu, J. Tao, W. H. Wang, Y. J. Zhou, P. H. Li, Z. Li, K. Yan, S. L. Wu, K. W. K. Yeung, Z. S. Xu, H. B. Xu and P. K. Chu, Biomaterials, 2013, 34, 2296–2306 CrossRef CAS PubMed.
- X. X. Hu, P. H. Li, K. W. K. Yeung, P. K. Chu, S. L. Wu and Z. S. Xu, J. Polym. Sci., Part A: Polym. Chem., 2010, 48, 5961–5967 CrossRef CAS.
Footnote |
| † Electronic supplementary information (ESI) available. See DOI: https://doi.org/10.1039/d4ra04593a |
| This journal is © The Royal Society of Chemistry 2024 |

