 Open Access Article
Thermal investigation of NbSe2 nanoparticles synthesized through a temperature-dependent sonochemical method
Shivani R. Bharuchaa,
Mehul S. Dave*a,
Sunil H. Chakib and
Tushar A. Limbani *cd
*cd
aN. V. Patel College of Pure & Applied Science, Charutar Vidya Mandal University, Gujarat 388120, India. E-mail: mehul@nvpas.edu.in
bDepartment of Physics, Sardar Patel University, Gujarat 388120, India
cC. L. Patel Institute of Studies and Research in Renewable Energy, Charutar Vidya Mandal University, New Vallabh Vidyanagar, Gujarat 388121, India. E-mail: tusharlimbani97@gmail.com
dSolar Energy Department, School of Energy Technology, Pandit Deendayal Energy University, Gandhinagar, Gujarat 382007, India
First published on 22nd October 2024
Abstract
Due to their unique size-dependent properties, transition metal di-chalcogenide nanoparticles are trending in research for their potential to revolutionize next-generation electronics, energy storage, and catalytic processes. This study addresses the effect of temperature when synthesizing NbSe2 nanoparticles via the sonochemical method at three different temperatures, room temperature (R.T.), 70 °C, and 100 °C. Energy Dispersive X-ray Analysis (EDAX) confirmed the high purity of NbSe2, with the sample synthesized at 70 °C, displaying the accurate stoichiometric ratio. X-ray diffraction (XRD) analysis revealed that all samples maintained the hexagonal phase of NbSe2, with 70 °C exhibiting superior crystallinity due to their crystallite size, lowest dislocation density, and minimal internal strain. Thermogravimetric analysis (TGA) and differential thermogravimetric (DTG) analyses, demonstrated that the sample synthesized at 70 °C had the highest thermal stability, with the lowest total weight loss and most consistent mass loss behavior. Kinetic parameters were evaluated using the Kissinger–Akahira–Sunose (KAS) and Flynn–Wall–Ozawa (FWO) methods, determining activation energy (Ea), pre-exponential factor (A), change in activation enthalpy (ΔH*), change in activation entropy (ΔS*), and Gibbs free energy change (ΔG*). Also, the sample synthesized at 70 °C exhibited the highest Ea, indicating superior thermal stability and favorable reaction kinetics. The findings underscore the significant impact of synthesis temperature on the structural and thermal properties of NbSe2 nanoparticles, with the sample synthesized at 70 °C demonstrating optimal characteristics. This study provides valuable insights into temperature-dependent synthesis and the thermal behavior of NbSe2 nanoparticles, highlighting their potential in various technological applications.
1. Introduction
Transition metal dichalcogenides (TMDs) have garnered significant attention in recent years due to their unique properties and potential applications in various fields, including electronics, catalysis, and energy storage.1–5 Niobium diselenide (NbSe2) stands out for its distinctive layered structure and intriguing electronic, optical, and thermal characteristics.6,7 NbSe2 nanoparticle (NPs) synthesis presents an opportunity to further explore and exploit these properties, particularly in nanoscale applications where size, morphology, and thermal stability are crucial.8–10However, a thorough understanding of how synthesis conditions, particularly the temperature, affect these properties is still largely unknown.11–17 Advanced thermal analysis approaches are needed for the thorough investigation of the thermal stability and phase transitions of NbSe2 NPs, which are crucial for their successful implementation in sensors, photodetectors, and thermoelectric devices.18,19
This research closes the information gap regarding the impact of synthesis temperature on the structural and thermal characteristics of NbSe2 NPs. By providing a controlled environment for adjusting synthesis parameters, the sonochemical synthesis approach makes it possible to investigate the connection between synthesis conditions and NPs characteristics systematically.20,21 Through structural characterization and thermal analysis methods, including thermogravimetric (TG), and derivative thermogravimetry (DTG), this work seeks to elucidate the links between the synthesis, structure, and properties of NbSe2 NPs.22 These discoveries will contribute to the advancement of nanomaterials and increase the range of practical uses for NbSe2 NPs through the improvement of their performance in numerous technological applications and streamlining the fabrication process. Although extensive research has been conducted on bulk NbSe2,6,7,16,19,23,24 there has been comparatively less focus on NbSe2 NPs using thermal analysis techniques.
The synthesis of NPs using the sonochemical method25–28 offers several advantages, including uniform particle size distribution, high purity, and controlled crystallinity. This method employs ultrasonic waves to facilitate the nucleation and growth of NPs, enabling the precise manipulation of synthesis conditions to tailor the properties of the resulting materials.29 In our previous report, the authors successfully synthesized NbSe2 nanoparticles at room temperature.22 To investigate the reproducibility and study on effect of synthesis temperature, the authors again synthesized NbSe2 at room temperature (R.T.), 70 °C, and 100 °C, observing significant variations in the compositional, structural, and thermal properties of the NPs.
To understand the elemental composition and purity of the synthesized NPs, the energy dispersive X-ray analysis (EDAX) is performed. The X-ray diffraction (XRD) techniques were used to determine, whether the samples maintained the hexagonal phase of NbSe2, and favorable structural properties, with the largest crystallite size, lowest dislocation density, internal strain, and better crystallinity.20 Thermal analysis, including TG and DTG analysis, was conducted to evaluate the thermal stability and decomposition behavior of the synthesized NPs.30,31 The authors employed model-free methods, specifically the Kissinger–Akahira–Sunose (KAS) and Flynn–Wall–Ozawa (FWO) methods further to understand the kinetic parameters of the thermal decomposition process. These methods allowed authors to determine the activation energy (Ea), pre-exponential factor (A), change in activation enthalpy (ΔH*), change in activation entropy (ΔS*), and Gibbs free energy change (ΔG*) for the synthesized samples.32,33
This study comprehensively investigates the thermal behavior of NbSe2 NPs synthesized via the temperature-dependent sonochemical method synthesis. The findings highlight the critical role of synthesis temperature in determining the compositional, structural, and thermal properties of NbSe2 NPs. These results underscore the potential of optimizing synthesis conditions to tailor the properties of NbSe2 NPs for various advanced applications.
2. Results and discussion
2.1. Energy dispersive X-ray analysis (EDAX)
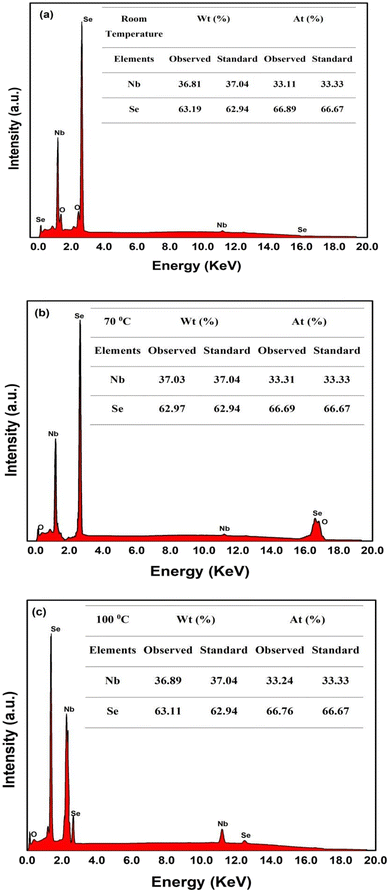
The EDAX results of NbSe2 NPs synthesized at R.T., 70 °C, and 100 °C using the sonochemical method revealed crucial insights into their elemental composition and purity. The observed and standard atomic percentages of Nb and Se are shown in Fig. 1, based on an average of five observations at different areas of the sample surfaces shown in Fig. 2. In Fig. 1 for all three samples, the spectra display prominent peaks corresponding to niobium (Nb) and selenium (Se), confirming the presence of these elements in the synthesized nanoparticles. The Nb and Se peaks were observed around 2–2.5 keV at the 100 °C sample. These peaks indicate a higher degree of Nb–Se interaction or alloying at this temperature, which is less pronounced in the R.T. and 70 °C samples due to differences in the synthesis conditions. | ||
| Fig. 2 Shows the microscopic image from EDAX for NbSe2 nanoparticles synthesized at (a) R.T., (b) 70 °C, (c) 100 °C respectively. | ||
The EDAX spectra for NbSe2 nanoparticles reveal a clear temperature-dependent variation in peak intensity. At R.T. and 70 °C, the primary peaks are lower, while at 100 °C, the primary peak is significantly higher. This can be attributed to increased crystallinity and improved particle morphology at higher synthesis temperatures. The enhanced atomic mobility at 100 °C promotes better crystallite growth, resulting in denser, more uniform particles that produce stronger X-ray interactions, reflected in the more intense EDAX peaks. In contrast, lower temperatures lead to less organized and potentially smaller crystallites, explaining the reduced peak intensities.
The observed weight percentages of Nb in samples R.T., 70 °C, and 100 °C are 36.81%, 37.03%, and 36.89%, respectively, close to the standard value of 37.04%. Similarly, the observed weight percentages of Se are 63.19%, 62.97%, and 63.11%, respectively, aligning closely with the standard value of 62.94%. The atomic percentages of Nb and Se also consistently match the standard values across all samples, with Nb around 33.11% to 33.24% and Se around 66.76% to 66.89%.
The microscopic images in Fig. 2 present the surface images of NbSe2 nanoparticles synthesized at three different temperatures: R.T., 70 °C, and 100 °C. These images are associated with the regions where EDAX data were collected to analyze the nanoparticles' elemental composition.
However, these findings suggest that increasing the synthesis temperature may lead to changes in the stoichiometric composition of the synthesized NPs. Also, the synthesis temperature significantly impacts the elemental composition of the synthesized NbSe2 NPs.
2.2. X-ray diffraction (XRD)
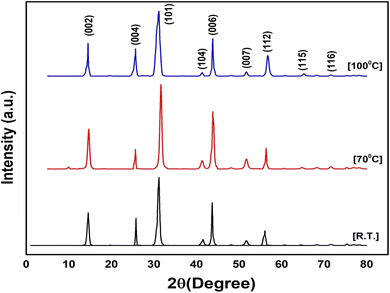
The XRD analysis of synthesized NbSe2 NPs provided valuable information regarding their crystal structure and phase purity. The XRD patterns exhibited distinct diffraction peaks corresponding to the (101) planes of hexagonal NbSe2, shown in Fig. 3. From the image revealed that the synthesis method employed in this study does not result in alterations to the structure and phase of NbSe2, even with varying temperatures. This is supported by the XRD data, well matched with standard JCPDS no. 018-0923 (ref. 34 and 35) which primarily show similar peak positions and patterns across all samples. The presence of very small intensities and unlabelled peaks in the XRD pattern might originate from instrumental noise. The other structural parameters such as crystallite size, dislocation density, and main internal strain of all the samples are tabulated in Table 1.| Sample | Crystallite size (D) (nm) | Dislocation density (δ) × 10−3 | Main internal strain (ε) |
|---|---|---|---|
| R.T. | 14.94 | 5.40 | 0.57 |
| 70 °C | 15.12 | 4.74 | 0.43 |
| 100 °C | 15.71 | 5.40 | 0.57 |
Based on the data obtained for the synthesized samples, the data presented in Table 1 is justified based on detailed experimental observations and analysis. The well-matched observed lattice constants with the standard for all samples are consistent at 3.44 Å for a = b and 12.56 Å for c, which confirms that the crystal structure remains stable across different synthesis temperatures. The crystallite size increases slightly with temperature, reaching 15.71 nm at 100 °C, signifying that higher temperatures promote larger crystal growth. The dislocation density decreases from 5.40 × 10⁻³ at R.T. to 4.74 × 10⁻³ at 70 °C and then returns to 5.40 × 10⁻³ at 100 °C, indicating fewer defects at 70 °C and a trend towards higher defect density at 100 °C. The main internal strain decreases from 0.57 at R.T. to 0.43 at 70 °C, and then increases again to 0.57 at 100 °C, reflecting the effect of temperature on internal stress. These observations are consistent with the known impact of synthesis temperature on crystallite growth, defect density, and internal strain, providing a comprehensive justification for the data presented in the table.
2.3. Thermal analysis
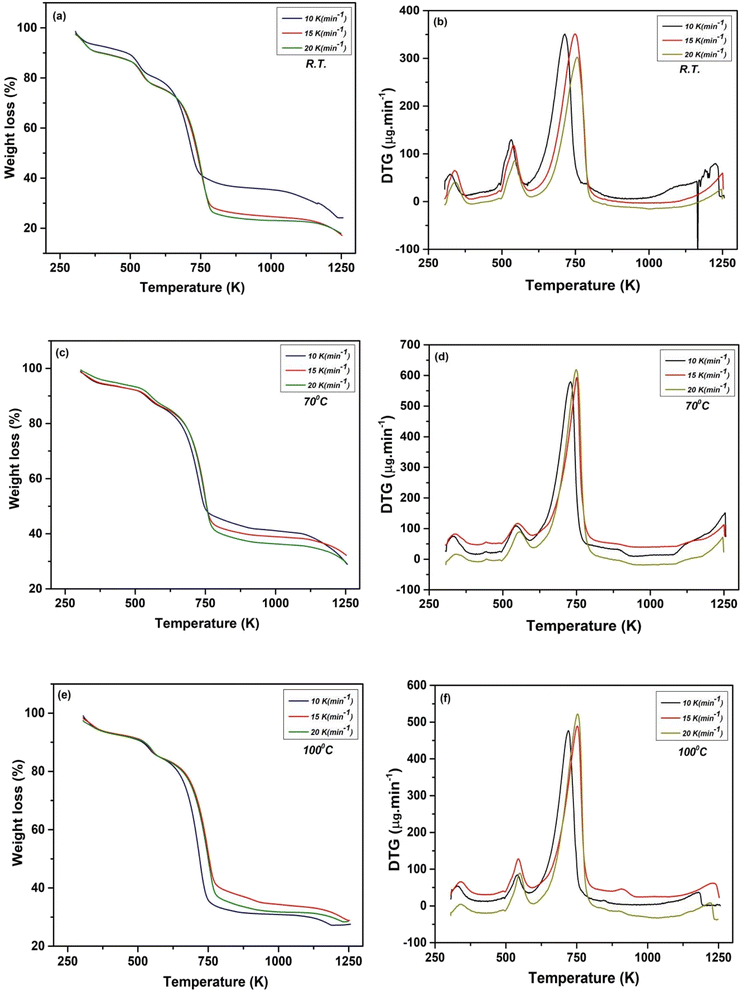 | ||
| Fig. 4 TG curves of NbSe2 NPs synthesized at (a) R.T., (c) 70 °C, (e) 100 °C and DTG curve of NbSe2 NPs synthesized at (b) R.T., (d) 70 °C and (f) 100 °C. | ||
| Sample | Heating rate | Mass loss (%) | Total weight loss (%) | |||
|---|---|---|---|---|---|---|
| Temperature range (K) | ||||||
| 305–498 | 499–604 | 605–1203 | 1204–1260 | 305–1260 | ||
| R.T. | 10 | 10.16 | 9.87 | 49.75 | 4.65 | 74.43 |
| 15 | 9.63 | 9.43 | 50.00 | 3.31 | 72.37 | |
| 20 | 9.89 | 9.56 | 49.94 | 2.42 | 71.81 | |
| 70 °C | 10 | 6.77 | 6.90 | 51.07 | 5.33 | 70.07 |
| 15 | 6.13 | 7.13 | 53.42 | 2.91 | 69.59 | |
| 20 | 6.56 | 6.55 | 50.33 | 3.13 | 66.57 | |
| 100 °C | 10 | 8.25 | 7.37 | 56.29 | 0.34 | 72.25 |
| 15 | 7.15 | 7.37 | 52.86 | 2.18 | 69.56 | |
| 20 | 6.50 | 7.34 | 54.24 | 0.92 | 69.00 | |
Based on the data obtained from the thermal analysis, revealed that the sample at 70 °C shows higher thermal stability and consistent mass loss behavior compared to R.T., and 100 °C. The total weight loss across the temperature range of 305–1260 K at 70 °C is the lowest, ranging from 70.07% to 66.57% indicating less decomposition and better thermal stability. This may be due to a more stable intermediate phase formed at this temperature, leading to reduced decomposition during thermal analysis. In contrast, R.T., and 100 °C showed higher total weight losses, up to 74.43% and 72.25%, respectively. The heating rate also affected mass loss, with higher rates slightly reducing total weight loss, but the trend remained that at 70 °C consistently lost the least total weight.36,37
2.3.2.1. Kissinger–Akahira–Sunose (KAS) method. The KAS method is a widely used approach for determining kinetic parameters, specifically the Ea and A from thermal analysis data. The integral KAS method originates from the Coats–Redfern (CR) estimation.22,38,39 The method is based on the eqn (1) as follows;40
 | (1) |
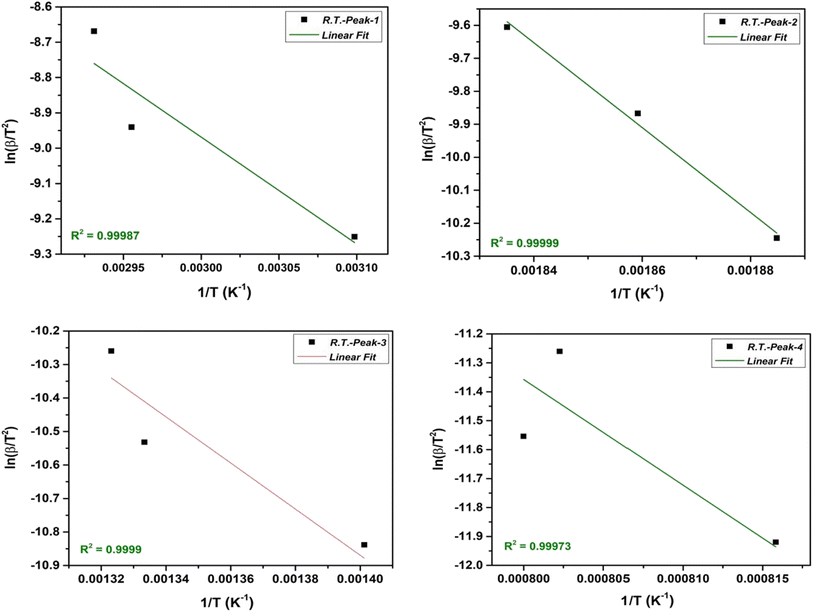
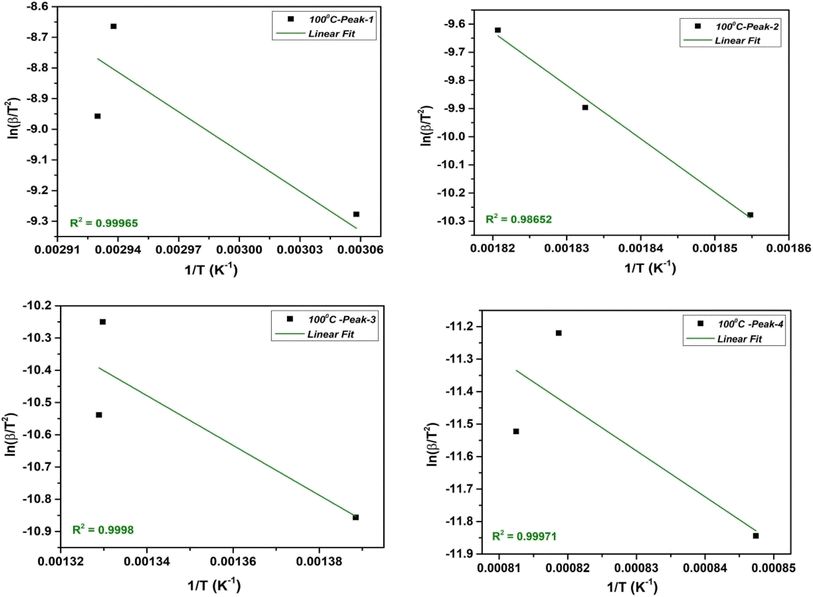
The KAS method involves taking advantage of the Arrhenius equation by plotting the natural logarithm of the heating rate  vs. 1/T at various conversion levels during thermal analysis experiments. The KAS plot of the four-step decomposition peaks for NbSe2 NPs at R.T., 70 °C, and 100 °C is shown in Fig. 5, 6, and 7 respectively.
The slope and intercept allow evaluation of the kinetic parameters such as activation energy and phonon frequency factor (A),
| Ea = −(slope × R) | (2) |
However, for both the non-isothermal and isothermal pyrolysis, the pre-exponential factor is calculated on the assumption of first-order reaction as follows eqn (3),
 | (3) |
2.3.2.2. Flynn–Wall–Ozawa (FWO) method. The FWO method uses the isoconversional approach, which involves analyzing heating rate experiments at a constant conversion level. It calculates Ea as a function of conversion. The FWO method is suitable when the reaction mechanism changes with temperature and provides Ea as a function of conversion. The integral FWO method is based on the eqn (4) as follows;41,42
 | (4) |
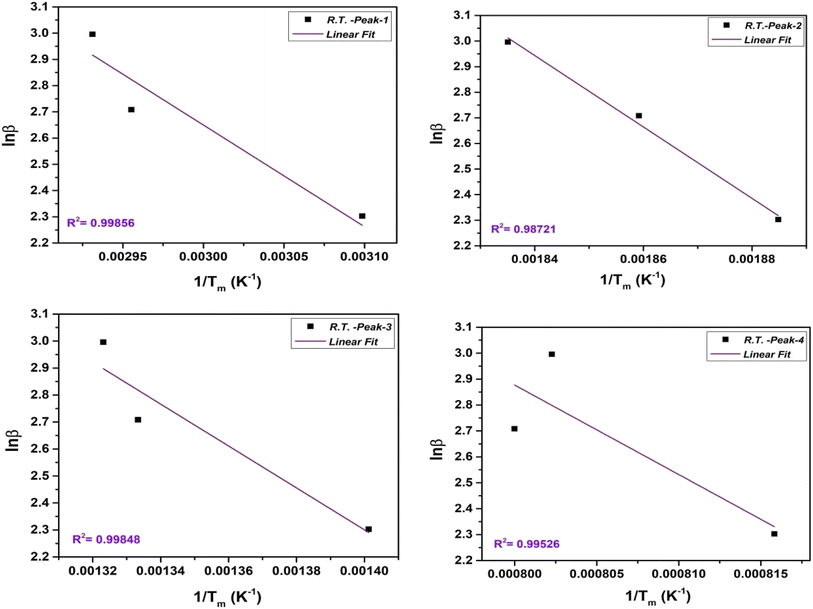
All the variables present in this equation hold similar meanings as discussed in the KAS method. For a constant value of α, a plot of ln![[thin space (1/6-em)]](https://www.rsc.org/images/entities/char_2009.gif) β vs. 1/T has been plotted, which provides a straight line. The slope and intercept allow evaluation of the kinetic parameters as activation energy (Ea), and phonon frequency factor (A),
β vs. 1/T has been plotted, which provides a straight line. The slope and intercept allow evaluation of the kinetic parameters as activation energy (Ea), and phonon frequency factor (A),
 | (5) |
 | (6) |
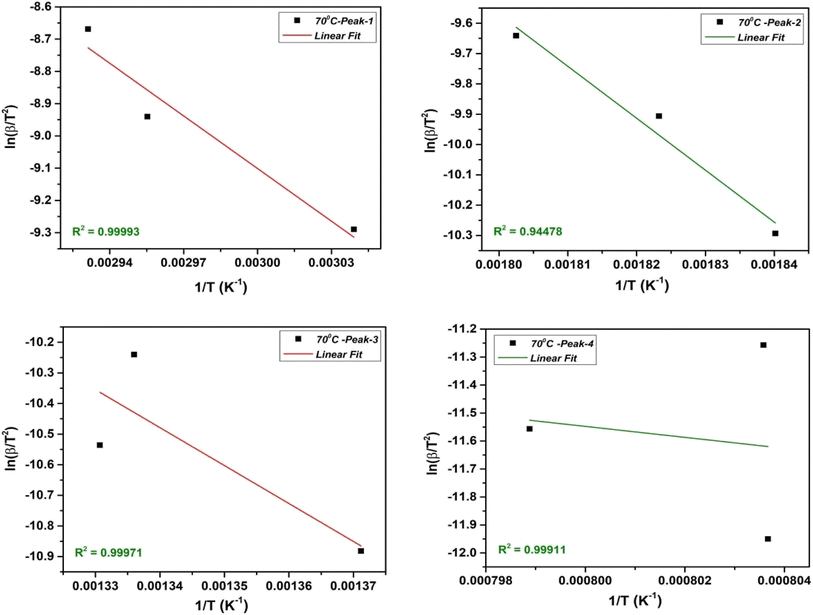
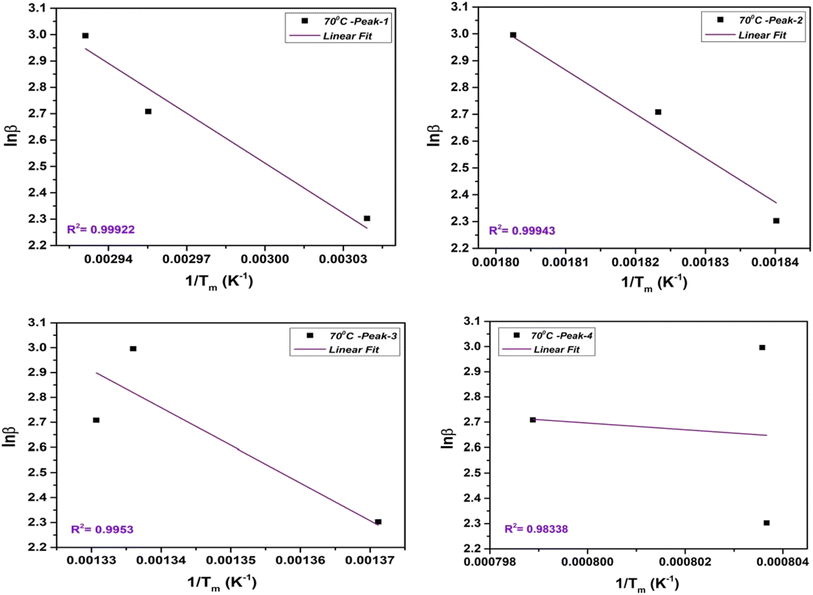
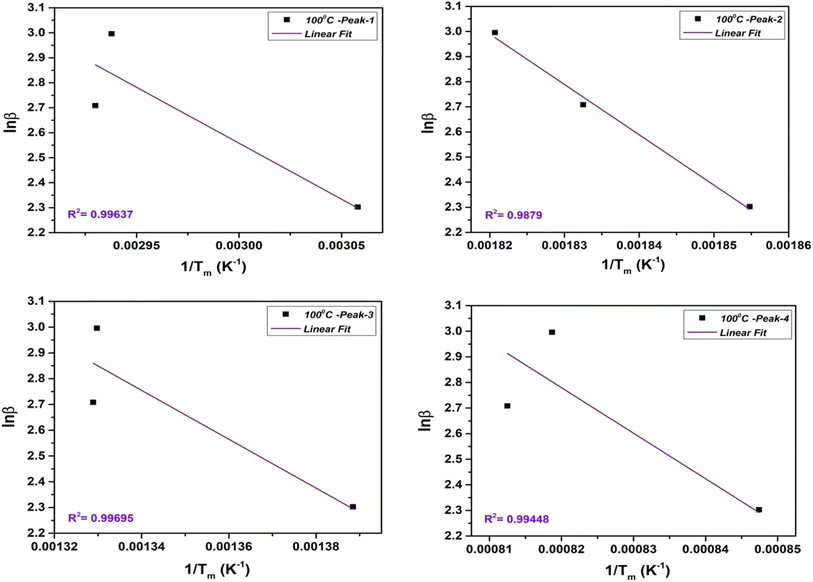
The FWO plot of the NbSe2 NPs four decomposition steps for samples at R.T., 70 °C, and 100 °C are shown in Fig. 8, 9, and 10 respectively. The peaks are obtained from the differentiation of the thermogravimetric data.
From the value of Ea and A estimated by KAS, and FWO methods. Further kinetic parameters such as a change in ΔH*, ΔS*, and ΔG* are estimated for NbSe2 NPs samples at R.T., 70 °C, and 100 °C using the following equations,31,43
| ΔH* = Ea − RT | (7) |
 | (8) |
| ΔG* = ΔH* − TΔS* | (9) |
The estimated values of Ea, A, ΔH*, ΔS*, and ΔG* for the NbSe2 NPs samples at R.T., 70 °C, and 100 °C are mentioned in Table 3. The results of different kinetic parameters determined by other methods are near-matched for all samples. This observation confirms the authenticity of the calculations using the above thermal relations.
| Sample | DTG step | Method | Ea (kJ mol−1) | A (S−1) | ΔH* (kJ mol−1) | ΔS* (J K−1 mol−1) | ΔG* (kJ mol−1) |
|---|---|---|---|---|---|---|---|
| R.T. | 1st | KAS | 25.16 | 3.39 × 10° | 22.38 | −82.55 | 50.13 |
| FWO | 30.62 | 5.80 × 10⁶ | 27.84 | −58.94 | 47.53 | ||
| 2nd | KAS | 107.00 | 1.44 × 101 | 102.53 | −170.20 | 194.06 | |
| FWO | 110.21 | 2.09 × 10⁷ | 105.74 | −52.25 | 123.20 | ||
| 3rd | KAS | 57.24 | 7.70 × 10° | 51.09 | −178.05 | 182.81 | |
| FWO | 61.35 | 1.16 × 10⁷ | 55.20 | −59.80 | 75.18 | ||
| 4th | KAS | 303.74 | 4.09 × 101 | 293.43 | −168.47 | 502.45 | |
| FWO | 272.78 | 5.17 × 10⁷ | 262.46 | −51.66 | 279.72 | ||
| 70 °C | 1st | KAS | 45.21 | 7.36 × 10³ | 42.41 | −114.44 | 80.89 |
| FWO | 49.83 | 1.20 × 10¹⁰ | 47.03 | 4.46 | 45.54 | ||
| 2nd | KAS | 142.39 | 2.32 × 10⁴ | 137.83 | −262.12 | 281.70 | |
| FWO | 129.74 | 3.13 × 10¹⁰ | 125.18 | 8.38 | 122.36 | ||
| 3rd | KAS | 103.02 | 1.68 × 10⁴ | 96.84 | −114.18 | 181.69 | |
| FWO | 118.90 | 2.87 × 10¹⁰ | 112.72 | 5.12 | 111.00 | ||
| 4th | KAS | 163.09 | 2.65 × 10⁴ | 152.72 | −114.68 | 295.70 | |
| FWO | 105.20 | 2.54 × 10¹⁰ | 94.84 | −0.179 | 94.90 | ||
| 100 °C | 1st | KAS | 35.89 | 2.07 × 10² | 33.09 | −144.13 | 81.56 |
| FWO | 35.39 | 3.75 × 10⁷ | 32.60 | −43.48 | 47.22 | ||
| 2nd | KAS | 157.60 | 9.09 × 10² | 153.07 | −135.84 | 227.06 | |
| FWO | 158.41 | 1.68 × 10⁸ | 153.88 | −35.02 | 172.95 | ||
| 3rd | KAS | 64.22 | 3.70 × 10² | 58.05 | −145.88 | 166.23 | |
| FWO | 74.95 | 7.93 × 10⁷ | 68.79 | −43.82 | 101.28 | ||
| 4th | KAS | 117.54 | 6.78 × 10² | 107.47 | −144.91 | 282.82 | |
| FWO | 140.57 | 1.49 × 10⁸ | 130.51 | −42.61 | 182.07 |
Based on the data from Table 3, the sample synthesized at 70 °C shows higher activation energies in the first and second steps (45.21 kJ mol−1 and 142.39 kJ mol−1, respectively) compared to those at R.T. and 100 °C, indicating that more energy is required for decomposition, which implies greater thermal stability. The pre-exponential factor (A) for the 70 °C sample is significantly higher, particularly when using the FWO method, suggesting a higher frequency of successful collisions leading to the reaction, thereby contributing to improved thermal stability and more uniform reaction kinetics.
Additionally, the sample at 70 °C shows lower ΔH* values for most steps compared to the 100 °C sample, indicating a reduced energy requirement for decomposition, which is consistent with its enhanced stability at this synthesis temperature. For instance, in the second step, the sample at 70 °C has a ΔH* of 137.83 kJ mol−1 compared to 153.07 kJ mol−1 at 100 °C. Moreover, the sample at 70 °C exhibits more negative ΔS* values, indicating a more ordered transition state compared to R.T. and 100 °C. This is particularly evident in the second step, where the sample at 70 °C has a ΔS* of −262.12 J K−1 mol−1 compared to R.T.'s −170.20 J K−1 mol−1 and the 100 °C sample is −135.84 J K−1 mol−1.
Furthermore, the ΔG* values at 70 °C are generally lower, with the second step showing ΔG* values of 281.70 kJ mol−1 (KAS) and 122.36 kJ mol−1 (FWO), lower than those at both R.T. and 100 °C. These findings collectively suggest that the 70 °C sample demonstrates superior thermal stability, making it the optimal temperature for synthesis.
3. Materials and method
3.1. Materials
All the chemicals used were analytical grade. Niobium pentachloride dihydrate (NbCl5·2H2O) [minimum assay 99%, Alfa Assar, United States], hydrochloric acid (HCl) [minimum assay 35%, HiMedia Laboratories Pvt. Ltd, Mumbai, India], tri-ethanol amine (TEA) [minimum assay 98%, Sisco Research Laboratories (SRL) Pvt. Ltd, India], sodium selenite (Na2SeO3) [minimum assay 98.5%, HiMedia Laboratories Pvt. Ltd, Mumbai, India] and hydrazine hydrate (N2H4) [Sigma-Aldrich Pvt. Ltd, India] are used for the synthesis.3.2. Synthesis of NbSe2 nanoparticles
The synthesis details of NbSe2 NPs utilizing precursor solutions of niobium (Nb) and selenium (Se) at R.T. via the sonochemical method are reported earlier.14 From considering synthesis parameters this synthesis of NbSe2 NPs at R.T., 70 °C and 100 °C, initially, solutions containing Nb and Se precursors were prepared separately. Specifically, niobium chloride pentahydrate (NbCl5·2H2O) was utilized as the source of Nb+, while sodium selenite (Na2SeO3) served as the Se− source. Additionally, TEA and hydrazine hydrate were introduced as complexing and reducing agents in precursor solution respectively. These precursor solutions were then subjected to ultrasonic waves under continuous stirring. The ultrasonic treatment facilitated the efficient mixing and reaction of the precursors, promoting nucleation and growth of NbSe2 NPs. After the filtration, synthesized nanoparticles dry at the synthesized temperature. Fig. 11 shows the schematic illustration of the synthesis process of NbSe2 nanoparticles synthesized at R.T., 70 °C, and 100 °C via the sonochemical method. The synthesized nanoparticles show that at R.T., the sample exhibits a brown color, which remains consistent up to 70 °C. However, above 70 °C, the color begins to change from light black to dark black, becoming more pronounced as the temperature increases, reaching up to 100 °C. These subsequent syntheses allowed for comparative analysis of the resulting NPs synthesized under different temperature conditions, enabling insights into the temperature-dependent effects on nanoparticle morphology, size, crystallinity, and thermal properties.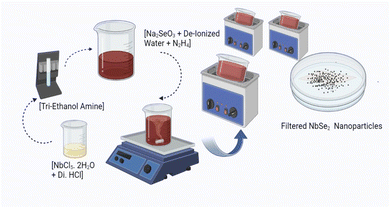 | ||
| Fig. 11 Shows the schematic illustration of the synthesis of NbSe2 nanoparticles synthesized at R.T., 70 °C, and 100 °C via the sonochemical method. | ||
3.3. Characterizations
The compositional analysis of synthesized nanoparticles was characterized using energy dispersive X-ray analysis with the ultra-high brightness Schottky emitter field emission gun with the energy of 0.0 to 20.0 keV attached with high-resolution Nova Nano SEM-450, FEI, Ltd scanning electron microscope (SICART, Vallabh Vidyanagar). The structural analysis of synthesized nanoparticles was identified through the Bruker D8 Advance X-ray diffraction technique with CuKα radiation in the 2θ range of 1° to 80° (SICART, Vallabh Vidyanagar). Here the thermocurves were recorded by Seiko SII-EXSTAR TG/DTA-7200 at three different heating rates of 10 K (min−1), 15 K (min−1), and 20 K (min−1) under an inert N2 atmosphere over the temperature gradually ramped up from R.T. (300 K) to a specified maximum temperature up to 1260 K in the case of all samples.4. Conclusion
In conclusion, the temperature-dependent sonochemical synthesis and subsequent thermal analysis of NbSe2 nanoparticles were studied, revealing significant impacts on their thermal stability, composition, and structural properties. XRD analysis confirmed that the synthesized nanoparticles belong to the P63/mmc space group with a hexagonal structure and standard lattice constants a = b = 3.44 Å and c = 12.56 Å. Among the samples, NbSe2 nanoparticles synthesized at 70 °C exhibited superior characteristics, including the crystallite size (15.12 nm), lowest dislocation density (4.74 × 10⁻³), and minimal internal strain (0.43). These properties suggest better crystallinity and fewer defects compared to samples synthesized at R.T. and 100 °C. From the TG, improved thermal properties of 70 °C were attributed to better crystallinity, fewer structural defects, and a composition closer to the desired stoichiometry, as confirmed by EDAX and XRD analysis. From the TG analysis, the sample synthesized at 70 °C had less weight loss% of 70.07, 69.59, and 66.57 at three different heating rates of 10, 15, and 20 K (min−1) compared to that synthesized at R.T. and 100 °C. From TG the observed kinetic parameter sample 70 °C also showed higher activation energies and lower enthalpy change, indicating superior thermal stability. The higher pre-exponential factors and more negative entropy changes for 70 °C suggest more uniform reaction kinetics and a more ordered transition state. These findings underscore the importance of synthesis temperature in tailoring the properties of NbSe2 nanoparticles. The study demonstrates that 70 °C is the optimal temperature for achieving high thermal stability and desired structural characteristics, making these nanoparticles suitable for potential applications in optoelectronic, energy storage, electronics, and catalysis. Future studies should explore the synthesis of NbSe2 nanoparticles at additional intermediate temperatures and under different sonochemical conditions to further refine the understanding of the relationship between synthesis parameters and nanoparticle properties. The limitation of this study is that the material remains thermally stable up to 600 K. The maximum weight loss occurs in the temperature range of 600 to 1200 K. This research provides valuable insights into the temperature-dependent synthesis and thermal behavior of NbSe2 nanoparticles, highlighting their potential in various advanced technological fields.Data availability
The datasets generated/analyzed during the current study are presented in the article.Author contributions
SRB contributed to the material preparation, data collection, analysis, and writing of the original draft. MSD acquired resources and assisted in project administration, reviewing, and editing of the manuscript, and supervision. SHC participated in the conceptualization, investigation, and review of the manuscript. TAL participated in the conceptualization, investigation, data analysis, and review.Conflicts of interest
There are no conflicts to disclose.Acknowledgements
The work was supported by the Education Department, Govt. of Gujarat, India for providing a research fellowship under SHODH (ScHeme of Developing High-quality Research) (reference no. 202010820001). The authors are very thankful to Dr A. Mahesh, Assistant Professor, C. L. Patel Institute of Studies and Research in Renewable Energy, Charutar Vidya Mandal University for providing lab facilities to conduct the experimental work.References
- N. R. Hemanth, T. Kim, B. Kim, A. H. Jadhav, K. Lee and N. K. Chaudhari, Mater. Chem. Front., 2021, 5, 3298–3321 RSC.
- Q. Fu, J. Han, X. Wang, P. Xu, T. Yao, J. Zhong, W. Zhong, S. Liu, T. Gao, Z. Zhang, L. Xu and B. Song, Adv. Mater., 2021, 33, 1–24 Search PubMed.
- R. Lv, J. A. Robinson, R. E. Schaak, D. Sun, Y. Sun, T. E. Mallouk and M. Terrones, Acc. Chem. Res., 2015, 48, 56–64 CrossRef CAS PubMed.
- N. Choudhary, M. A. Islam, J. H. Kim, T. J. Ko, A. Schropp, L. Hurtado, D. Weitzman, L. Zhai and Y. Jung, Nano Today, 2018, 19, 16–40 CrossRef CAS.
- T. Limbani and A. Mahesh, Nano-Struct. Nano-Objects, 2023, 35, 101010 CrossRef CAS.
- C. S. Oglesby, E. Bucher, C. Kloc and H. Hohl, J. Cryst. Growth, 1994, 137, 289–294 CrossRef CAS.
- F. Bischoff, W. Auwärter, J. V. Barth, A. Schiffrin, M. Fuhrer and B. Weber, Chem. Mater., 2017, 29, 9907–9914 CrossRef CAS.
- R. Contreras, D. Celentano, T. Luo, Z. Liu and J. O. Morales-Ferreiro, Nanomaterials, 2023, 13, 1–9 CrossRef PubMed.
- N. M. Toporova, E. M. Sherokalova, N. V. Selezneva, V. V. Ogloblichev and N. V. Baranov, J. Alloys Compd., 2020, 848, 156534 CrossRef CAS.
- J. Guo, Y. Shi, C. Zhu, L. Wang, N. Wang and T. Ma, J. Mater. Chem. A, 2013, 1, 11874–11879 RSC.
- C. Su, H. Yan, H. Li, J. Yan, L. Tong, X. Wang, W. Fan, Q. Wang and S. Yin, J. Colloid Interface Sci., 2024, 670, 28–40 CrossRef CAS PubMed.
- H.-H. Lien, eCommons, 2017 Search PubMed.
- C. Wu, J. Liu, B. Liu, S. He, G. Dai, B. Xu and W. Zhong, J. Mater. Chem. B, 2019, 7, 3134–3142 RSC.
- T. Takahashi, C. Ando, M. Saito, Y. Miyata, Y. Nakanishi, J. Pu and T. Takenobu, npj 2D Mater. Appl., 2021, 5, 1–8 CrossRef.
- R. He, J. Van Baren, J. A. Yan, X. Xi, Z. Ye, G. Ye, I. H. Lu, S. M. Leong and C. H. Lui, 2D Mater., 2016, 3, 1–7 Search PubMed.
- P. Sekar, E. C. Greyson, J. E. Barton and T. W. Odom, J. Am. Chem. Soc., 2005, 127, 2054–2055 CrossRef CAS PubMed.
- K. Iwaya, T. Hanaguri, A. Koizumi, K. Takaki, A. Maeda and K. Kitazawa, Phys. B, 2003, 329–333, 1598–1599 CrossRef CAS.
- Z. Miao, D. Huang, Y. Wang, W. J. Li, L. Fan, J. Wang, Y. Ma, Q. Zhao and Z. Zha, Adv. Funct. Mater., 2020, 30, 1–13 Search PubMed.
- T. Kolokoto, V. Mashindi, R. Kadzutu-Sithole, L. F. E. Machogo-Phao, Z. B. Ndala, N. P. Shumbula, S. S. Nkabinde, G. N. Ngubeni, S. S. Gqoba, K. P. Mubiayi and N. Moloto, RSC Adv., 2021, 11, 31159–31173 RSC.
- S. R. Bharucha, M. S. Dave, R. K. Giri, S. H. Chaki and T. A. Limbani, Adv. Nat. Sci.: Nanosci. Nanotechnol., 2024, 15, 1–9 Search PubMed.
- A. K. Worku, D. W. Ayele, N. G. Habtu, G. A. Melas, T. A. Yemata, N. Y. Mekonnen and M. A. Teshager, SN Appl. Sci., 2021, 3, 699 CrossRef CAS.
- M. Naffakh, Polymers, 2021, 13, 1–18 Search PubMed.
- H. Zhang, A. Rousuli, K. Zhang, L. Luo, C. Guo, X. Cong, Z. Lin, C. Bao, H. Zhang, S. Xu, R. Feng, S. Shen, K. Zhao, W. Yao, Y. Wu, S. Ji, X. Chen, P. Tan, Q.-K. Xue, Y. Xu, W. Duan, P. Yu and S. Zhou, Nat. Phys., 2022, 18, 1425–1430 Search PubMed.
- M. M. Ugeda, A. J. Bradley, Y. Zhang, S. Onishi, Y. Chen, W. Ruan, C. Ojeda-Aristizabal, H. Ryu, M. T. Edmonds, H. Z. Tsai, A. Riss, S. K. Mo, D. Lee, A. Zettl, Z. Hussain, Z. X. Shen and M. F. Crommie, Nat. Phys., 2016, 12, 92–97 Search PubMed.
- A. Gedanken, Ultrason. Sonochem., 2004, 11, 47–55 CrossRef CAS PubMed.
- H. Xu, B. W. Zeiger and K. S. Suslick, Chem. Soc. Rev., 2013, 42, 2555–2567 RSC.
- D. Ghanbari, M. Salavati-Niasari and M. Ghasemi-Kooch, J. Ind. Eng. Chem., 2014, 20, 3970–3974 CrossRef CAS.
- J. Zhu, Y. Koltypin and A. Gedanken, Chem. Mater., 2000, 12, 73–78 CrossRef CAS.
- S. R. Bharucha, M. S. Dave, R. K. Giri, S. H. Chaki and T. A. Limbani, Eng. Proc., 2023, 56, 1–7 Search PubMed.
- M. Koraiem Handawy, A. Yu Snegirev, V. V. Stepanov and V. A. Talalov, IOP Conf. Ser.: Mater. Sci. Eng., 2021, 1100, 012053 Search PubMed.
- S. H. Chaki, M. D. Chaudhary and M. P. Deshpande, J. Therm. Anal. Calorim., 2015, 120, 1261–1272 CrossRef CAS.
- M. Heydari, M. Rahman and R. Gupta, Int. J. Chem. Eng., 2015, 2015, 1–9 CrossRef.
- N. Kongkaew, W. Pruksakit and S. Patumsawad, Energy Procedia, 2015, 79, 663–670 CrossRef CAS.
- M. A. Ibrahem, W. C. Huang, T. W. Lan, K. M. Boopathi, Y. C. Hsiao, C. H. Chen, W. Budiawan, Y. Y. Chen, C. S. Chang, L. J. Li, C. H. Tsai and C. W. Chu, J. Mater. Chem. A, 2014, 2, 11382–11390 RSC.
- N. D. Boscher, C. J. Carmalt and I. P. Parkin, Eur. J. Inorg. Chem., 2006, 1255–1259 CrossRef CAS.
- J. Gao, S. Cheng, X. Zeng, X. Sun, Y. Bai, S. Hu, J. Yue, X. Yu, M. Zhang, X. Xu and M. Han, Ultrason. Sonochem., 2024, 108, 106978 CrossRef CAS PubMed.
- I. Milosavljevic and E. M. Suuberg, Ind. Eng. Chem. Res., 1995, 34, 1081–1091 CrossRef CAS.
- A. J. Khimani, S. H. Chaki, R. K. Giri, R. R. Meena, R. M. Kannaujiya and M. P. Deshpande, Chem. Thermodyn. Therm. Anal., 2023, 9, 100104 CrossRef.
- A. W. Coats and J. P. Redfern, Natu. Pub. Gr., 1964, 201, 68–69 CrossRef CAS.
- H. E. Kissinger, Anal. Chem., 1957, 29, 1702–1706 CrossRef CAS.
- T. Ozawa, Thermochim. Acta, 1992, 203, 159–165 CrossRef CAS.
- T. J. Malek, S. H. Chaki, J. P. Tailor and M. P. Deshpande, AIP Conf. Proc., 2016, 020390 CrossRef.
- S. H. Chaki, Front. Mater. Sci. China, 2008, 2, 322–325 CrossRef.
| This journal is © The Royal Society of Chemistry 2024 |

