DOI:
10.1039/D4RA04757E
(Paper)
RSC Adv., 2024,
14, 31825-31836
Enhancing the corrosion inhibition of copper sheets in oil-in-water (O/W) emulsions by combining two organic heterocyclic derivatives
Received
30th June 2024
, Accepted 24th September 2024
First published on 8th October 2024
Abstract
Copper sheets corrode easily when exposed to oil-in-water (O/W) emulsions during metal-forming processes. The quest for identifying novel, high-efficiency copper inhibitors and realizing the effective protection of copper surfaces from emulsion corrosion has gradually attracted considerable attention. In this study, two organic heterocyclic derivatives, N,N-bis(2-ethylhexyl)-4-methyl-1H-benzotriazol-1-methanamine (NBTAH) and 2,5-bis(octyldithio)-1,3,4-thiadiazole (BTDA), were introduced as copper inhibitors into O/W emulsions. Their corrosion inhibition performance was investigated in-depth using electrochemical measurements, surface characterization, adsorption isotherms and wetting techniques. The results indicated that both inhibitors generated anodic passive films on the copper surface, and thus enhanced the corrosion resistance. The maximum corrosion inhibition efficiency achieved was 94.0% with combination of 5 mM NBTAH and 8 mM BTDA. From the surface analysis, it was confirmed that the composite inhibitors could successfully adsorb onto the copper surface via the polar atoms of the benzene, azole, and thiazole rings. The adsorption formed multilayer inhibitor films comprised of Cu–NBTAH and Cu–BTDA chelates. In addition, these films significantly reduced the wettability of the O/W emulsions on the copper surface, thus isolating copper from the corrosive medium. The anti-corrosion mechanism for adsorption and shielding of the composite inhibitors on the copper surface is preliminarily proposed.
1 Introduction
Copper (Cu) is a preferred industrial material owing to its excellent thermal-electrical conductivity, machinability, workability, and relatively noble properties.1–3 However, Cu is extremely easily corroded when exposed to a humid environment, thus generating surface oxidation and discoloration during the Cu sheet rolling or cutting processes. This problem has been difficult to address for a long time and has attracted considerable attention from researchers.4,5 An oil-in-water (O/W) emulsion is one of the most representative water-based metalworking fluids used in Cu machine processes and is known to be corrosive to copper.6,7 The corrosion behavior of Cu is probably distinct from that of general corrosion because the components of the emulsions are extremely complex. They are typically mixtures containing water, base oil, oiliness agents, extreme pressure additives, emulsifiers, and other organic/inorganic additives.8 Each component can influence the surface quality of the Cu sheets and cause genetic corrosion issues such as incremental porosity, pigments, and emulsion spots. The formation of a Cu oxide film or other corrosive products degrades the appearance of the metal, interferes with the Cu contacts, and has a significant influence on the Cu surface, including roughening and coating.9–11 Therefore, it is essential to improve the corrosion protection of Cu sheets in O/W emulsions.
In response to this issue, one of the most practical, effective, and inexpensive methods of inhibiting Cu corrosion is the use of corrosion inhibitors.12,13 Organic heterocyclic molecules containing O, N, S, P, and polar functional groups have been extensively used as inhibitors because of their strong adsorption by plugging the active sites on the metal surface.14 The polar functional groups presented in inhibitors are considered the centre of the reaction for the adsorption of heterocyclic compounds.15–18 For decades, benzotriazole (BTA) has been used as a water-soluble copper corrosion inhibitor owing to its low cost and high efficiency.19 Even at low pH, and low inhibitor concentrations, BTA can effectively form a variety of [Cu+BTA−]n complex films on the Cu surface, which act as protective barriers that prevent the action of corrosive media. In addition, there is documentation in the literature on the effectiveness of thiadiazole (TDA) as a Cu passivator in different aggressive environments.12,20–22 Sherif et al.22 stated that pentaheterocycles on thiadiazole rings possessed nitrogen and sulfur atoms that could offer electrons and improve the inhibition process. Nevertheless, the corrosion inhibition effect of a single inhibitor is usually limited by its shortcomings in solution, that is, BTA could lose its corrosion inhibition efficiency owing to its poor solubility in neutral oil solutions or emulsions, and TDA provides a narrow passivation potential window. Appropriate modifications of these molecules, such as the addition of long peptide chains to BTA to modify its solubility to emulsions and broaden the passivation area of TDA, can effectively improve their performance in Cu corrosion protection. Moreover, combining these two types of inhibitors as composite inhibitors and leveraging their respective advantages would provide a new approach for Cu corrosion protection.
In this study, two organic heterocyclic derivatives, N,N-bis(2-ethylhexyl)-4-methyl-1H-benzotriazol-1-methanamine (NBTAH) and 2,5-bis(octyldithio)-1,3,4-thiadiazole (BTDA), were combined and used as Cu inhibitors in O/W emulsions. The electrochemical corrosion behavior of the Cu electrodes was investigated by open-circuit potential (OCP), electrochemical impedance spectroscopy (EIS), and potentiodynamic polarization experiments. Three-dimensional (3D) surface morphologies and scanning electron microscopy (SEM) micrographs were used to observe the Cu surface before and after corrosion inhibition. The anti-corrosion mechanism of the composite inhibitors on the Cu surface was further elucidated using X-ray photoelectron spectroscopy (XPS) analysis, adsorption isotherms and wetting techniques.
2 Experimental
2.1 Materials and solutions
The bulk (φ6 mm × 1.50 mm) of pure copper sheets (composition in wt%: 99.99 Cu, 0.0016 C, 0.0013 Cd, <0.001 Fe, <0.001 S, <0.001 P) served as working electrodes for the electrochemical measurements. Prior to each experiment, Cu electrodes were connected to a Cu wire, while leaving a 0.282 cm2 cross-sectional area exposed to the corrosive medium, and the rest of the surface was embedded in epoxy resin. All the samples were abraded consecutively with a series of silicon carbide papers (400–2000 grit), and further polished with aluminium slurries (0.5–1.5 μm) to obtain a mirror-like appearance. The electrodes were then washed ultrasonically with distilled water, degreased with ethanol, and finally dried under a stream N2 at room temperature.
O/W emulsions were prepared by mixing 95 wt% tap water and 5 wt% emulsified oils. The emulsified oils comprised base oil D130, vegetable oils, oleic acid, triethanolamine, and inhibitors. Two organic heterocyclic derivatives NBTAH and BTDA, the chemical structures of which are presented in Fig. 1, were provided by POUPC Beijing Co., Ltd. at 99 wt% purity, and were adopted as the studied inhibitors. In this investigation, the corrosive solutions for the test were O/W emulsions of various concentrations (1–8 mM) of the studied inhibitors, and a solution without any inhibitors was used as a blank for comparison, a more intensive electrochemical investigation was performed by combining 5 mM NBTAH with various concentrations of BTDA as a composite inhibitor in O/W emulsions. The compositions of the testing solutions are listed in Table 1. A freshly prepared O/W emulsion solution was used for each measurement.
 |
| | Fig. 1 Molecular structures of (a) NBTAH and (b) BTDA. | |
Table 1 Composition of the corrosive solutions for the test
| Test solutions |
NBTAH (mM) |
BTDA (mM) |
| Blank |
0 |
0 |
| O/W emulsion + single NBTAH |
1 |
0 |
| 3 |
0 |
| 5 |
0 |
| 8 |
0 |
| O/W emulsion + single BTDA |
0 |
1 |
| 0 |
3 |
| 0 |
5 |
| 0 |
8 |
| O/W emulsion + composite inhibitors |
5 |
1 |
| 5 |
3 |
| 5 |
5 |
| 5 |
8 |
2.2 Electrochemical measurements
The electrochemical measurements were performed using a multichannel potentiostatic system (VersaSTAT, AMETEK, US) equipped with a traditional three-electrode system. A 4 cm2 platinum sheet was used as the counter electrode, and a saturated calomel electrode (SCE) served as the reference electrode. First, Cu working electrodes were immersed in a 400 mL container equipped with various O/W emulsions for 60 min at OCPs to reach an almost steady state. Subsequently, EIS tests were conducted based on the OCP state in the frequency range of 0.01 Hz–100 kHz using an alternating current signal with an amplitude of 10 mV. The EIS data were analysed using the ZsimDemo 3.30d software and fitted to appropriate equivalent circuits. Potentiodynamic polarization measurements were then implemented in the potential range of ±1.5 V vs. OCPs at a scan rate of 1 mV s−1. All the measurements were performed at 313 K (close to the practical cold-rolling temperature). Each experiment repeated three times under the same experimental conditions to ensure satisfactory reproducibility.
2.3 Surface characterization
The Cu electrodes were rinsed using ethyl to remove residual emulsions from the surface and then dried with compressed air. An Olympus confocal laser scanning microscope (CLSM) was used to observe the surface profile and measure the roughness of the Cu electrodes. Surface micrographs of the corroded and inhibited Cu electrodes were also obtained using SEM. XPS experiments were conducted to analyse the compositions of the corrosion products and inhibitor films on the Cu surfaces.
2.4 Wetting techniques
A JC-2000C1 contact-angle-measuring device is typically utilized to investigate the wettability of aqueous liquids, which is based on ideal Young's model, as shown in the following equation:23| |
γlv![[thin space (1/6-em)]](https://www.rsc.org/images/entities/char_2009.gif) cos cos![[thin space (1/6-em)]](https://www.rsc.org/images/entities/char_2009.gif) θ = γsv − γsl θ = γsv − γsl
| (1) |
where θ is the contact angle, and γsv, γsl, and γlv represent the surface tension of solid–vapor, solid–liquid, and liquid–vapor surface tensions, respectively.
In this study, O/W emulsions without and with different inhibitors were used as the target liquids. They were dropped onto the same rolled Cu sheet using the sessile drop method, with the droplet volume precisely controlled at 1 mL. The equilibrium contact angle was obtained from the height and base diameter of the drop after 10 s of contact between the Cu surface and the target liquids. Each sample was measured five times, and the average value was obtained.
3 Results and discussion
3.1 Effect of single inhibitors on electrochemical behavior
Fig. 2 presents the OCP curves versus time for Cu electrodes immersed in O/W emulsions in the absence and presence of different concentrations of single inhibitors. It was observed that the presence of both types of inhibitors shifted the OCP values toward the positive direction, indicating that the inhibitor films formed on the Cu surface mainly affect the anodic polarization behavior of the electrodes. All the OCP values became more stable after 1 h of testing, indicating that the electrochemical system had entered a quasi-steady state.24 As shown in Fig. 2a, the OCPs increased when the addition of NBTAH was within a low concentration range (less than 5 mM), whereas they decreased in the range of 5–8 mM. For the O/W emulsions containing BTDA, as shown in Fig. 2b, the OCP values of the Cu electrodes increased with the addition of BTDA in all concentration ranges. The most positive potential reached +108 mV compared with that of the blank group. The precise categorization of a compound as an anodic or cathodic inhibitor requires an OCP displacement of up to 85 mV with respect to the blank corrodent.25 It is observed that NBTAH, which has a limited effect on the cathodic and anodic reactions, is a mixed-type inhibitor, while BTDA, which significantly affects anodic OCPs, is a typically anodic inhibitor.
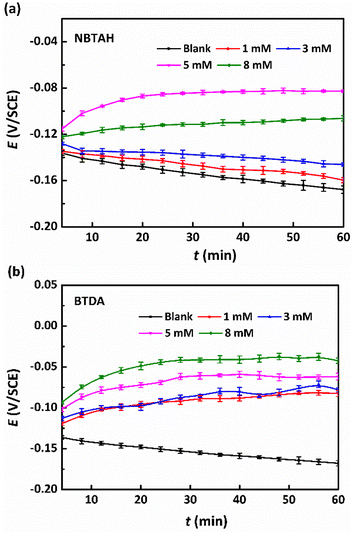 |
| | Fig. 2 OCP curves vs. time for Cu electrodes in O/W emulsions comprising different concentrations (0–8 mM) of single (a) NBTAH and (b) BTDA at 313 K for 1 h of testing. | |
Fig. 3a and b present the EIS Nyquist plots of Cu electrodes in O/W emulsions comprising different concentrations of single inhibitors. The diameter of various impedances reflects the corrosion resistance of Cu electrodes. As shown in the figures, both inhibitors increase the impedance diameter of Cu electrodes in O/W emulsions, suggesting that NBTAH/BTDA formed inhibitor films on the surface of the Cu electrodes, and the corrosion resistance of the metal was thus improved. As the concentration of NBTAH was increased, the impedance diameter of the Cu electrodes in O/W emulsion first increases and then begins to decline when the addition increases beyond 5 mM. A further increase in NBTAH results in a reduction in the diameter. The impedance diameter of the Cu electrodes in emulsions containing BTDA increases as the inhibitor concentration increases and reaches the largest value at the concentration of 8 mM. At this point, a large amount of BTDA molecules have been adsorbed onto the Cu surface, the inhibitor films become compact, and the protective effect has been enhanced. On comparing the impedance capabilities of the two inhibitors, it is found that NBTAH exhibits a larger impedance diameter than BTDA in the high-frequency region, thus indicating that NBTAH possesses a stronger corrosion inhibition ability.
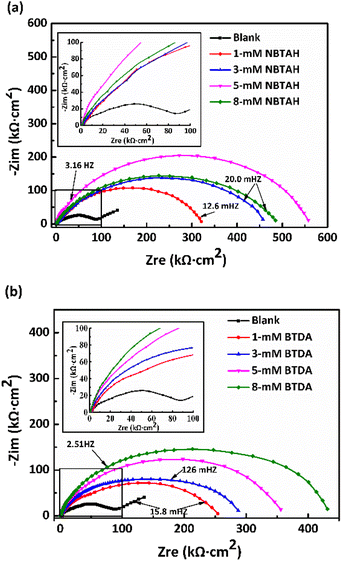 |
| | Fig. 3 EIS Nyquist plots of the Cu electrodes in O/W emulsions of various concentrations (0–8 mM) of single (a) NBTAH and (b) BTDA at 313 K. | |
Two corresponding electrochemical equivalent circuit (EEC) models were employed to fit the EIS data, and the results are presented in Fig. 4. The EEC for the blank group without any inhibitors can be determined as R(Q(R(Q(RW)))) model because of the existence of Warburg impedances. The R(QR(QR)) model is suitable for fitting the impedance data of the Cu electrodes in the O/W emulsions with the addition of NBTAH and BTDA. In this study, Rs represents the solution resistance in the O/W emulsion system; W is the Warburg impedance; Rf is the protective film resistance consisting of the Cu electrode surface, oxygen, and surfactants; and Rct is the charge transfer impedance. The inhibition efficiency (η) can be calculated from the polarization resistance as follows:26
| |
 | (2) |
where
Rp and
Rp,0 represent the polarization resistances of the unprotected and inhibited Cu electrodes, respectively. These values can be defined as the sum of
Rct and
Rf.
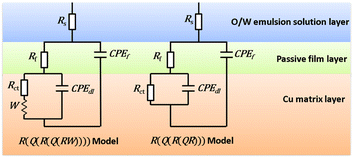 |
| | Fig. 4 Two EEC models for fitting the EIS data. | |
For Cu electrodes in the O/W emulsion system, as depicted in Fig. 4, it is found that all the EIS components were distributed in three layers: the O/W emulsion solution, passive film, and Cu matrix layer. The addition of the NBTAH/BTDA significantly enhances the solution impedance, and decreases the film capacitance (Cf) and double-layer capacitance (Cdl) in the electrochemical circuit. However, because the two inhibitors exhibit different corrosion inhibition effects on the Cu electrodes as well as different dispersion effects,27,28 the impedance spectra in the O/W emulsion could not form complete semicircles. Given the differences between pure capacitance and double-layer capacitance at the solid–liquid reflect the interface capacitance and assess the dispersion effect, which was attributed to the roughness and incongruous homogeneity of the electrode surface.29 In this case, Qf and Qd were used to fit the impedance behavior of Cf and Cdl, respectively. The impedance of a CPE is expressed as follows:30
| |
 | (3) |
where
Y0 is the proportionality factor,
j is the imaginary root (values equal to

),
ω is the angular frequency, and
n is deviation parameter associated with the pure capacitor. The values of
n are in the range of 0–1. Furthermore,
Cf and
Cdl can be deduced using the following equations:
31,32 | |
 | (4) |
| |
 | (5) |
where
S is the electrode area exposed to O/W emulsions,
F represents the Faraday constant,
ε0 is the permittivity of air,
ε represents the local dielectric constant of the film, and
d is the thickness of the electric double layers of the O/W emulsion system.
Table 2 lists the data of the EIS components for Cu electrodes in the O/W emulsions comprising different concentrations of single inhibitors. As revealed in the blank group, the impedance values of Rf, Rct, and Rp were relatively small because of the high ionic concentrations in the O/W emulsions. As the concentration of NBTAH/BTDA increased, the various impedance values increased accordingly. It can be observed that the Warburg impedance gradually disappeared at low-frequencies, meaning that the diffusion process of oxygen and CuCl− was significantly weakened by the addition of these two inhibitors.29 In this case, the electrodes in the O/W emulsions were mainly controlled by the charge transfer resistance. Compared with the blank group, this process generates passive films on the Cu electrodes and exposes a smaller electrode area to the solutions. The thicknesses of the electric double layer and passive films increase as more inhibitors are adsorbed onto the electrode surface. Moreover, the dielectric constant (ε) of the adsorbed inhibitors is obviously less than that of the water molecules. Therefore, the electric double-layer capacitance and the film capacitance values would be decreased.
Table 2 The data of the EIS components for Cu electrodes in O/W emulsions comprising different concentrations of single inhibitors at 313 K
| Single inhibitors |
Rf (kΩ cm2) |
Rct (kΩ cm2) |
Rp (kΩ cm2) |
Qf |
Qd |
η (%) |
| Y0 (μF cm−2) |
nf |
Y0 (μF cm−2) |
nd |
| Blank |
13.6 |
68.9 |
82.5 |
36.3 |
0.73 |
421.9 |
0.45 |
— |
| 1 mM NBTAH |
24.9 |
286.2 |
311.1 |
24.3 |
0.91 |
389.3 |
0.74 |
73.5 |
| 3 mM NBTAH |
27.2 |
356.3 |
383.5 |
21.2 |
0.90 |
325.6 |
0.79 |
78.5 |
| 5 mM NBTAH |
43.5 |
462.3 |
505.8 |
13.7 |
0.85 |
354.2 |
0.75 |
83.7 |
| 8 mM NBTAH |
33.8 |
366.6 |
400.4 |
16.3 |
0.82 |
348.1 |
0.75 |
79.4 |
| 1 mM BTDA |
15.8 |
157.4 |
173.2 |
21.1 |
0.92 |
79.6 |
0.81 |
52.3 |
| 3 mM BTDA |
17.6 |
180.5 |
198.1 |
20.8 |
0.92 |
68.5 |
0.82 |
58.6 |
| 5 mM BTDA |
18.2 |
220.1 |
238.3 |
16.6 |
0.93 |
66.3 |
0.88 |
65.4 |
| 8 mM BTDA |
29.5 |
298.9 |
328.4 |
12.3 |
0.95 |
48.5 |
0.83 |
74.9 |
Fig. 5 illustrates the potentiodynamic polarization curves for Cu electrodes after 1 h of immersion in O/W emulsions without and with various concentrations of single inhibitors. To understand the anti-corrosion performance of the two types of inhibitors, the corresponding polarization parameters including corrosion potentials (Ecorr), corrosion current density (icorr), anodic Tafel slope (βa), cathodic Tafel slope (βc), and breakdown potential (Eb) are measured using Tafel linear extrapolation methods. The fitted polarization data are listed in Table 3. The corrosion inhibition efficiency (η) at different concentrations of the inhibitors in the O/W emulsions is calculated using eqn (6):
| |
 | (6) |
where
icorr,0 and
icorr represent the corrosion current densities of the unprotected and inhibited Cu electrodes, respectively.
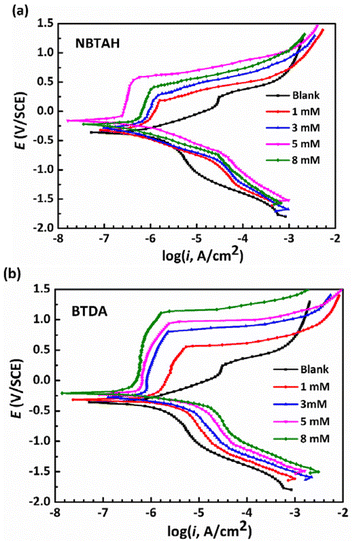 |
| | Fig. 5 Potentiodynamic polarization curves for Cu electrodes in O/W emulsions comprising various concentrations (0–8 mM) of single (a) NBTAH and (b) BTDA at 313 K. | |
Table 3 Tafel fitting polarization parameters for Cu electrodes after 1 h of immersion in O/W emulsions comprising various concentrations of NBTAH and BTDA at 313 K
| Single inhibitors |
Ecorr (mV) |
icorr (A cm−2) |
βa (mV dec−1) |
βc (mV dec−1) |
Eb (V) |
η (%) |
| Blank |
−350 |
7.58 × 10⁻⁷ |
319 |
−283 |
0.24 |
— |
| 1 mM NBTAH |
−314 |
2.23 × 10⁻⁷ |
207 |
−258 |
0.18 |
70.4 |
| 3 mM NBTAH |
−308 |
1.95 × 10⁻⁷ |
193 |
−267 |
0.27 |
74.3 |
| 5 mM NBTAH |
−269 |
1.08 × 10⁻⁷ |
198 |
−159 |
0.54 |
85.7 |
| 8 mM NBTAH |
−283 |
1.51 × 10⁻⁷ |
210 |
−186 |
0.41 |
80.1 |
| 1 mM BTDA |
−272 |
3.98 × 10⁻⁷ |
232 |
−291 |
0.52 |
47.5 |
| 3 mM BTDA |
−268 |
3.31 × 10⁻⁷ |
256 |
−144 |
0.80 |
56.3 |
| 5 mM BTDA |
−197 |
2.82 × 10⁻⁷ |
173 |
−141 |
0.91 |
62.7 |
| 8 mM BTDA |
−190 |
1.99 × 10⁻⁷ |
262 |
−105 |
1.11 |
73.7 |
As shown in Fig. 5 and Table 3, the corrosion current density (icorr) of the Cu electrode in the blank group was 7.58 × 10⁻⁷ A cm−2. It decreased significantly with the addition of NBTAH/BTDA, indicating that the corrosion process of Cu in the O/W emulsions was inhibited. As shown in Fig. 5a, the icorr of the Cu electrode first decreases within a low concentration range (≤5 mM) of NBTAH and then increases. Under these circumstances, NBTAH exhibited a good corrosion inhibition on Cu electrodes when its addition was around 5 mM, and had an antagonistic effect on the corrosion inhibition of the Cu electrodes once additional inhibitors were added, which is in good agreement with the former EIS results. In contrast, with increasing concentration of BTDA (Fig. 5b), the icorr of the Cu electrode in the O/W emulsions decreases continuously, which indicates that BTDA molecule possesses more adsorption onto the Cu surface than NBTAH. Both inhibitors have their corrosion potential (Ecorr) shifted positively. Moreover, it is worth noting that the corrosion inhibition efficiency (η) of the two inhibitors within all the concentration ranges follows the same order, that is, η (BTDA) < η (NBTAH), which indicates that the single inhibitor NBTAH exhibits better corrosion inhibition performance than BTDA. Comparing to other organic corrosion inhibitors, as Table 4 shows,33–36 both NBTAH and BTDA exhibits good corrosion inhibition on the Cu surface when it was used in water-soluble solution.
Table 4 Corrosion inhibition efficiency of different inhibitors
| Corrosion inhibitors |
Amount |
Corrosive medium |
Corrosion efficiency |
| Benzotriazole (BTAH)33,34 |
10 mM |
3% NaCl solution |
87.6% |
| 1-Hydroxybenzotriazole (BTAOH)33,34 |
10 mM |
3% NaCl solution |
38.1% |
| 3-Amino-1,2,4-triazole (ATA)34 |
10 mM |
3% NaCl solution |
61.8% |
| 3,4-Dimethoxy phenyl thiosemicarbazone (DMPTS)35 |
300 ppm |
1 M HCl solution |
74.0% |
| Pyrrolidinium ionic liquids (ILs)36 |
5 mM |
1 M HNO3 solution |
52.5% |
| NBTAH |
5 mM |
O/W emulsions |
79.4% |
| BTDA |
8 mM |
O/W emulsions |
74.9% |
The polarization results also indicate that both inhibitors generate anodic passive films on the Cu electrodes, in which Cu easily loses electrons and is transferred to Cu+ and Cu2+ according to eqn (7)–(9).24
| | |
CuClads− + Cl− → CuCl2,ads− + e−
| (8) |
| | |
CuCl2,ads− → Cusol2+ + 2Cl− + e−
| (9) |
Passivation films were formed on the Cu surface owing to the adsorption of these two inhibitors, which effectively prevented the corrosive medium of Cl−, H2O, CO2, and SO42− etc.6,7 in the O/W emulsion from reaching the Cu electrodes. The cathodic dissolved oxygen reduction reaction can be described as follows.37
| | |
O2 + 4e− + 2H2O → 4OH−
| (10) |
The breakdown potential (Eb) is commonly used to evaluate the passivation behavior of electrodes. The Eb variation with increasing concentration of the single inhibitors can be observed in Table 3 and Fig. 6. It is observed that the Cu electrode possesses an Eb of 0.24 V in the blank O/W emulsions. With the increase in the BTDA contents, the Eb value exhibits a linear increasing trend and reaches up to 1.12 V when 8 mM of BTDA was used. Therefore, the passivation region of the Cu electrodes was continuously broadened, and it can be inferred that the passive film formed by the BTDA on the Cu surface became compact and stable. However, the Eb values exhibited inconspicuous changes in O/W emulsions containing NBTAH. When the concentration of NBTAH were within a low range (≤5 mM), the NBTAH molecules generated almost no passivation effect on Cu surfaces. This illustrates that, although NBTAH possesses an effective corrosion inhibition performance, the narrower passivation region limits its inhibition role. The passive films formed by NBTAH are easily damaged during the electrochemical corrosion process, resulting in the formation of new pits on Cu surfaces.
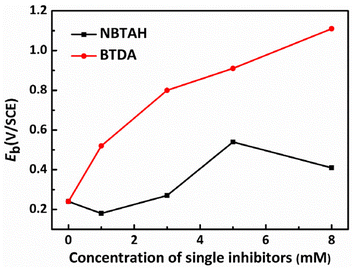 |
| | Fig. 6 Eb variation with the concentrations of the single inhibitors in O/W emulsions. | |
3.2 Effects of the composite inhibitors
The above research results indicate that both inhibitor molecules exhibit their respective strengths. (i) Compared with the BTDA molecules, NBTAH appears to possess better corrosion inhibition efficiency, which is manifested in the significantly reduced corrosion current density of the Cu electrodes and their improved corrosion resistance in the O/W emulsions. (ii) Despite this, BTDA helps increase the break down potential of the Cu electrodes, thus providing them with a wider passivation region in this corrosive medium. As a result, more stable passive films are formed on the Cu electrode surface. To synthesize the respective advantages of these two molecules and to further improve the corrosion inhibition performance of Cu electrodes, based on electrochemical tests, 5 mM NBTAH and various concentrations (1–8 mM) of BTDA were combined as composite copper inhibitors, and their anti-corrosion effect on the Cu surfaces is presented in this work.
Fig. 7 depict the Nyquist impedance plots for Cu electrodes immersed in O/W emulsions comprising different composite inhibitors after the EIS tests, and the corresponding EIS parameters are listed in Table 5. In the case wherein the Cu electrodes are protected with composite inhibitors, their corrosion resistance is significantly enhanced, and the maximum impedance can reach approximately 1360 kΩ cm2, which is significantly higher than that of each NBTAH/BTDA inhibitors used individually. It can be observed from Fig. 7 that, as the concentration of BTDA in the composite inhibitors was increased, from 1 mM to 8 mM, the high-frequency impedance diameters increased gradually, indicating that the anti-corrosion performance at the Cu surface improved.
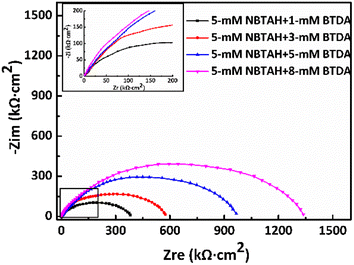 |
| | Fig. 7 Nyquist impedance plot for Cu electrodes immersed in O/W emulsions comprising different composite inhibitors after the EIS tests. | |
Table 5 The data of the EIS components for Cu electrodes immersed in O/W emulsions comprising different concentrations of composite inhibitors
| Composite inhibitors |
Rf (kΩ cm2) |
Rct (kΩ cm2) |
Rp (kΩ cm2) |
Qf |
Qd |
η (%) |
| Y0 (μF cm−2) |
nf |
Y0 (μF cm−2) |
nd |
| Blank |
13.6 |
68.9 |
82.5 |
36.3 |
0.73 |
421.9 |
0.45 |
— |
| 5 mM NBTAH + 1 mM BTDA |
48.8 |
363.6 |
412.4 |
15.28 |
0.93 |
388.3 |
0.68 |
79.9 |
| 5 mM NBTAH + 3 mM BTDA |
69.2 |
533.1 |
602.3 |
10.36 |
0.88 |
375.6 |
0.73 |
86.3 |
| 5 mM NBTAH + 5 mM BTDA |
82.7 |
885.9 |
968.6 |
13.73 |
0.82 |
346.2 |
0.65 |
91.5 |
| 5 mM NBTAH + 8 mM BTDA |
88.8 |
1343.6 |
1432.4 |
10.38 |
0.75 |
325.2 |
0.80 |
94.0 |
The EEC model for the EIS results still matched the R(QR(QR)) model because the impedance distribution variation appeared as a semi-circular resistance arc throughout the entire high-frequency range. In such cases, the diffusion mass transfer process is strongly blocked, and Cu corrosion is controlled by the charge transfer process.38,39 When 5 mM NBTAH and 8 mM BTDA were combined in the O/W emulsions, the Cu surface was well-protected, and the corrosion efficiency reached 94.0%, which was the highest value comparing to other combinations.
Fig. 8 presents the anodic polarization curves for Cu electrodes in O/W emulsions comprising different concentrations of the composite inhibitors. It is apparent that two passive zones appear in the anodic polarization curves of the Cu electrodes as composite inhibitors were applied in the O/W emulsions: passive zones (i) exhibited a slightly lower breakdown potential, and the Eb value ranged from 0.1 V to 0.28 V. This passive zone was much narrower than that observed when a single inhibitor was used. In contrast, passive zone (ii) exhibited a higher breakdown potential, the Eb value ranged from 0.68 V to 1.11 V, and the passivation region was larger. This indicates that a better protective effect in the passivation region/passive film formation can be achieved when these two inhibitors are combined. The Eb variation with increasing concentration of BTDA in the composite inhibitors is shown in Fig. 9. Eb in both the passive zones exhibited the same upward trend with increasing BTDA concentration.
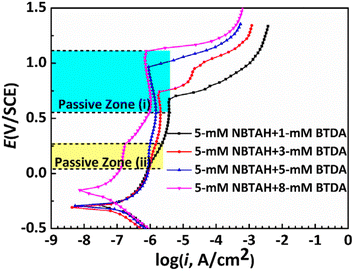 |
| | Fig. 8 Anodic polarization curves for Cu electrodes in O/W emulsions comprising different concentrations of composite inhibitors. | |
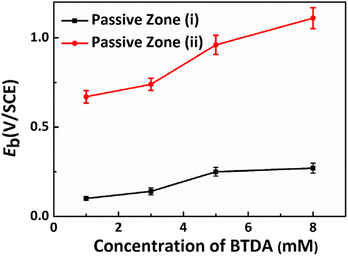 |
| | Fig. 9 Eb variation with increasing concentrations of BTDA in the composite inhibitor. | |
Table 6 lists the polarization parameters for the Cu electrodes after immersed in the O/W emulsions containing different composite inhibitors. The corrosion potential Ecorr of the Cu electrodes increased and the corrosion current density icorr decreased significantly as the concentration of BTDA increased. It can be observed that, with the increasing concentration of BTDA, the corrosion inhibition efficiency (η) of the Cu electrodes increased compared with the previous single inhibitors results. When 5 mM NBTAH and a lower concentration of BTDA were used in combination, the composite inhibitors exhibited an antagonistic effect on the Cu surface. Conversely, a better inhibition effect could be achieved when 5 mM NBTAH and higher concentrations (more than 5 mM BTDA) were used in combination in the O/W emulsions. Comparing to other combinations, 5 mM NBTAH and 8 mM BTDA possess the highest corrosion efficiency, reflecting the best anti-corrosion effect.
Table 6 Tafel fitting polarization parameters for Cu electrodes after immersion in O/W emulsions comprising different composite inhibitors at 313 K
| Composite inhibitors |
Ecorr (mV) |
icorr (A cm−2) |
βa (mV dec−1) |
βc (mV dec−1) |
Eb (V) |
| Blank |
−350 |
7.58 × 10⁻⁷ |
319 |
−283 |
— |
| 5 mM NBTAH + 1 mM BTDA |
−334 |
1.95 × 10⁻⁷ |
265 |
−275 |
74.3 |
| 5 mM NBTAH + 3 mM BTDA |
−327 |
1.12 × 10⁻⁷ |
256 |
−264 |
85.2 |
| 5 mM NBTAH + 5 mM BTDA |
−287 |
6.76 × 10⁻⁸ |
214 |
−261 |
91.1 |
| 5 mM NBTAH + 8 mM BTDA |
−155 |
4.75 × 10⁻⁸ |
265 |
−223 |
93.7 |
3.3 Surface analysis
The 3D topographies of CLSM results of Cu electrode surfaces after the electrochemical tests are presented in Fig. 10. In Fig. 10a, it can be observed that the O/W emulsion without inhibitors caused the severe corrosion of the Cu electrode, with a thick corrosion layer and high surface roughness. The corroded surface was significantly improved by the addition of 1 mM NBTAH (Fig. 10b). The corrosion type was localized corrosion, which mainly manifested with the morphological characteristics of pitting corrosion. As the concentration of NBTAH increased to 5 mM (Fig. 10c), the Cu surface exhibited less pitting corrosion, accompanied by the formation of a thin inhibitor film at most regions. In contrast, as depicted in Fig. 10d and e, even though the BTDA can also improve the surface quality of the Cu electrodes compared to the case without inhibitor treatment, when the addition concentration was low, the localized corrosion was still severe and was accompanied by some large pits. In addition, the average roughness (Ra) of the Cu surface with 1 mM NBTAH and 1 mM BTDA were calculated to be 0.287 μm and 0.369 μm, respectively. This also indicates that NBTAH has a better corrosion inhibition effect than BTDA, which is consistent with previous electrochemical findings. When the two inhibitors were used in combination, as shown in Fig. 10f and g, the localized corrosion and pits on the Cu surface disappeared, and were replaced by the inhibitor film covering the entire surface. Furthermore, when a combination of 5 mM NBTAH and 8 mM BTDA was used, the Cu electrode retained a relatively intact surface after the electrochemical experiments. The inhibitor film was thicker and Ra was reduced to 0.089 μm. These results reflect the inhibitory effects of the composite inhibitors. Comparing to 5 mM NBTAH + 1 mM BTDA, the combination of 5 mM NBTAH and 8 mM reflects better inhibitory effect.
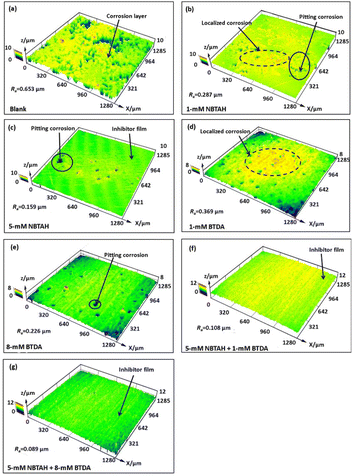 |
| | Fig. 10 CLSM images of Cu surfaces (a) blank, (b) 1 mM NBTAH, (c) 5 mM NBTAH, (d) 1 mM BTDA, (e) 5 mM BTDA, (f) 5 mM NBTAH + 1 mM BTDA, and (g) 5 mM NBTAH + 8 mM BTDA after the electrochemical tests. | |
Based on the above CLSM results, four typical Cu electrodes were selected for SEM observation after the carbon spray treatment. The SEM images of the Cu electrodes after immersion in the O/W emulsion comprising different inhibitors are presented in Fig. 11. It can be observed from Fig. 11a and b, that under the action of a single inhibitor, large corrosion pits appeared on the Cu surface. The pitting corrosion of the BTDA was more severe than that of the NBTAH. Although BTDA has a wide passivation zone, its corrosion inhibition efficiency is low, and its anti-corrosion effect on the pitting corrosion behavior of the Cu surface is still insignificant. As shown in Fig. 11c and d, the Cu surface was improved with the help of the composite inhibitors. Both the size and number of corrosion pits decreased. Comparing to 5 mM NBTAH + 1 mM BTDA, the smoother surface was observed when 5 mM NBTAH and 8 mM BTDA were used in combination.
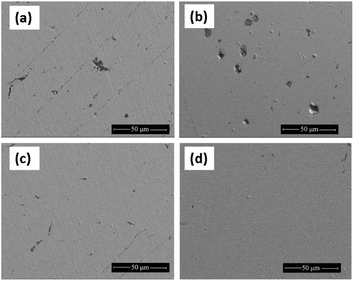 |
| | Fig. 11 SEM images of Cu electrode surfaces after immersion in O/W emulsions comprising (a) 5 mM NBTAH, (b) 8 mM BTDA, (c) 5 mM NBTAH + 1 mM BTDA, and (d) 5 mM NBTAH + 8 mM BTDA at 313 K. | |
We further investigated the anti-corrosion mechanism of the composite inhibitors and characterized the chemical compositions of the inhibitor film. The XPS analysis was performed after the electrochemical tests. The results are shown in Fig. 12, and the binding energies of some standard compounds of Cu, O, C, N, and S obtained from the NIST XPS database are listed in the plots.
 |
| | Fig. 12 XPS spectra of the Cu surface after immersion in the O/W emulsion comprising 5 mM NBTAH + 8 mM BTDA at 313 K: (a) Cu 2p, (b) O 1s, (c) C 1s, (d) N 1s, and (e) S 2p. | |
As shown in Fig. 12a, the Cu 2p3/2 peak at the binding energy of 932.6 eV can be fitted into three peaks, representing the Cu elemental, Cu2O, and monovalent copper compounds (Cu(I)), respectively. Because the adsorption peak of O2−, at this binding energy was weak, the peak was mainly composed of Cu and Cu(I). The Cu 2p1/2 peak is mainly comprised of two peaks at 934.7–935.3 eV with approximately a 9.25% peak area. These peaks represent bivalent copper compounds (Cu(II)) and Cu–BTAH.40 A high-intensity peak was observed in the O 1s spectrum (Fig. 12b) with a binding energy of 531.8 eV. This peak indicates the existence of hydroxyl (OH−), which is related to the oleic acid component in the O/W emulsions. As shown in the C 1s spectrum (Fig. 12c), three feature peaks at 284.6 eV, 286.4 eV, and 288.8 eV are indicative of saturated hydrocarbon chains or methyl (C–C/C–H), ether carbon or hydroxyl carbon (C–O), and carbon–nitrogen bond, respectively. This illustrates that the composite inhibitors interact with Cu2O and CuO and form Cu(I)–NBTAH and Cu(I)–BTDA chelates on the Cu surface. It was further observed from the N 1s spectrum (Fig. 12d) that the adsorption peak at 398.8 eV is indicative of an unsaturated bond –N![[double bond, length as m-dash]](https://www.rsc.org/images/entities/char_e001.gif) .41 This peak is indicative of the N–C bond, as determined in our previous research, and its intensity is slightly reduced.7 The –N
.41 This peak is indicative of the N–C bond, as determined in our previous research, and its intensity is slightly reduced.7 The –N![[double bond, length as m-dash]](https://www.rsc.org/images/entities/char_e001.gif) bond in NBTAH and –C
bond in NBTAH and –C![[double bond, length as m-dash]](https://www.rsc.org/images/entities/char_e001.gif) N in BTDA interacted with the Cu surface, thus resulting in the electron binding energy deviating toward the lower direction. Finally, as observed from the S 2p spectrum in Fig. 12e, the binding energy of the adsorption peak is located at 162.1 eV and 163.5 eV, representing the presence of a –S–S– bond or S2− ion.42 From the analysis, it is found that the area ratio of the two peaks is close to 4
N in BTDA interacted with the Cu surface, thus resulting in the electron binding energy deviating toward the lower direction. Finally, as observed from the S 2p spectrum in Fig. 12e, the binding energy of the adsorption peak is located at 162.1 eV and 163.5 eV, representing the presence of a –S–S– bond or S2− ion.42 From the analysis, it is found that the area ratio of the two peaks is close to 4![[thin space (1/6-em)]](https://www.rsc.org/images/entities/char_2009.gif) :
:![[thin space (1/6-em)]](https://www.rsc.org/images/entities/char_2009.gif) 1, thus indicating the existence of BTDA molecules. The peak intensity decreased owing to the chemical reaction between S2− and the copper oxides. The above XPS analysis results prove that the N, S, and other polar atoms of the benzene, azole, and thiazole rings of NBTAH and BTDA generate multi-layer passive films containing Cu–NBTAH and Cu–BTDA chelates on the Cu surface through charge transfer. This resulted in corrosion inhibition improvement on the Cu surface and realized good adsorption effects.
1, thus indicating the existence of BTDA molecules. The peak intensity decreased owing to the chemical reaction between S2− and the copper oxides. The above XPS analysis results prove that the N, S, and other polar atoms of the benzene, azole, and thiazole rings of NBTAH and BTDA generate multi-layer passive films containing Cu–NBTAH and Cu–BTDA chelates on the Cu surface through charge transfer. This resulted in corrosion inhibition improvement on the Cu surface and realized good adsorption effects.
3.4 Adsorption isotherm and wettability
The adsorption isotherm model is an important criterion for exploring the adsorption characteristics of inhibitor molecules on Cu surface. The adsorption mechanism is usually investigated using Langmuir, Frumkin, and Temkin isotherms according to the following equations,43 which are consistent with previous Tafel and EIS results.| |
 | (11) |
| |
 | (12) |
where θ represents the degree of the coverage that is always defined by η (%), C is the concentration of the inhibitors, Kads is the equilibrium constant of the adsorption process of the inhibitor, and a is the molecular interaction parameter.
The most suitable model for fitting the experimental results obeyed the Langmuir isotherm (Fig. 13), with all linear regression coefficients (R2) extremely close to 1. Moreover, this indicates that the adsorption process of NBTAH and BTDA onto the Cu surface is limited to one molecular layer.2 As shown in the figure, the adsorption relationship between C and C/θ presents approximately linear lines with the intercept of 1/Kads. The standard free energy of adsorption (ΔG0ads) is calculated as follows:44
| |
 | (14) |
where
R is the gas constant (8.314 J mol
−1 K
−1), 55.5 represents the molar concentration of water in the O/W emulsions (mol L
−1), and
T is the absolute temperature (K).
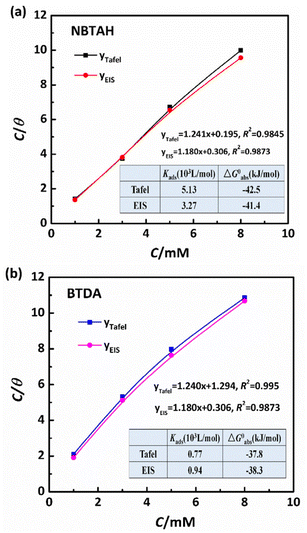 |
| | Fig. 13 Langmuir adsorption isotherms and corresponding thermodynamic parameters for (a) NBTAH and (b) BTDA in O/W emulsions at 313 K. | |
According to the adsorption laws, a low value of ΔG0adsand high value of Kads suggest that the inhibitors could be tightly adsorbed on the metal surface.45 The Tafel and EIS values of ΔG0adsand Kads follow the order: Kads (BTDA) < Kads (NBTAH), and ΔG0ads (NBTAH) < ΔG0ads (BTDA), which reveals that NBTAH has a stronger adsorption affinity at the Cu surface than BTDA and thus exhibits a better corrosion inhibition effect. In addition, the negative value of ΔG0ads implies that adsorption is a spontaneous process.46 As is well known, the value of ΔG0ads is higher than −20 kJ mol−1, which could be considered as physisorption. In this case, the inhibitor acts via electrostatic interactions between the charged metal and charged organic molecules.47 If ΔG0ads is approximately or lower than −40 kJ mol−1, the adsorption process is consistent with chemisorption owing to the covalent bond formed by charge transfer or sharing from the inhibitor molecules to the Cu surface. Therefore, it can be verified that the adsorption process of BTDA on the Cu surface involves a mixture of adsorption between physisorption and chemisorption, while stronger chemisorption could occur with NBTAH under the same conditions. Importantly, the regression coefficients of both the EIS fitted results were close to 1, illustrating that the Langmuir adsorption isotherm obtained from the EIS was more accurate.
Fig. 14 presents the effect of different inhibitors on the contact angle of the O/W emulsions on the Cu surface. The equilibrium contact angle (θ) was calculated by the mean value of the measurements of left contact angle (θ1) and right contact angle (θ2) (θ = 1/2(θ1 + θ2)). It is observed that the contact angle of the blank group was small (16°) owing to the rapid spread of the emulsifier oils onto the Cu surface. The contact angle increased gradually with the presence of inhibitors. NBTAH was found to have the effect of increasing the contact angle to a great degree than BTDA. When composite inhibitors were used, the contact angle of the O/W emulsions on the Cu surface increased to 32.5°–34.5°, significantly reducing the wettability of the O/W emulsions on the Cu surface. Comparing these two groups, it is found that the use of 5 mM NBTAH + 8 mM BTDA could form a larger contact angle. Furthermore, owing to the high-water content of O/W emulsions (generally 95–97 wt% water content), these wetting tests could be used to evaluate the effect of inhibitors on the hydrophilic/hydrophobic properties of the Cu surface. It is apparent that as the concentrations of inhibitors in the O/W emulsions were increased, the hydrophobicity of the Cu surface increased, making it more difficult for water molecules to spread onto the metal surface.48 The aforementioned comprehensive analysis of the molecular properties of the inhibitors indicates that the NBTAH and BTDA molecules can form stable adsorption films on the Cu surfaces. These films occupied a large number of adsorption sites and thus isolated the corrosion of the O/W emulsions on the Cu sheet surfaces, thus exhibiting a characteristic of shielding effect.
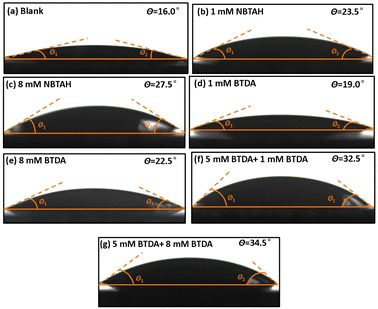 |
| | Fig. 14 Equilibrium contact angles of O/W emulsions: (a) without inhibitors, and with (b) 1 mM NBTAH, (c) 8 mM NBTAH, (d) 1 mM BTDA, (e) 8 mM BTDA, (f) 5 mM NBTAH + 1 mM BTDA, and (g) 5 mM NBTAH + 8 mM BTDA. | |
3.5 Discussion
Based on the above experimental results, the anti-corrosion mechanism of the composite inhibitors on Cu surfaces could be preliminarily proposed, as shown in Fig. 15. Composite inhibitors can successfully adsorb onto the Cu surface via chemisorption (charge transfer) or physisorption (electrostatic attraction) of the polar atoms of the benzene, azole, and thiazole rings to form multilayer inhibitor films that comprised of Cu–NBTAH and Cu–BTDA chelates. In addition, the composite inhibitors occupied the adsorption sites of the Cu surface. According to the Langmuir competitive adsorption theory, the adsorption of a molecule can be ascribed as a monolayer adsorption on the metal surface.49 The strong adsorption of the composite inhibitors results in other corrosive medium such as Cl−, H2O, CO2, and SO42− in the O/W emulsions that can hardly adsorb onto the Cu surface. The adsorption films isolated the spreading process, and reduced the wettability of the O/W emulsions onto the Cu surface, and increased the hydrophobicity of the Cu sheets. Therefore, the shielding effect of the composite inhibitors is demonstrated in the isolation of the corrosive medium from the Cu surface. Composite inhibitors have demonstrated their excellent anti-corrosion performance on Cu surfaces attributes to the combination of these two effects.
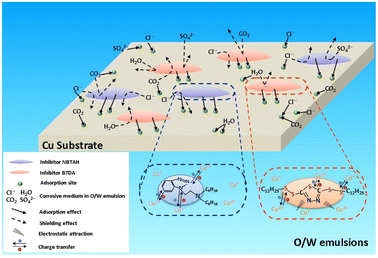 |
| | Fig. 15 Schematic of the anti-corrosion mechanism of adsorption and shielding of the composite inhibitors on Cu surfaces. | |
4 Conclusions
The In summary, two organic heterocyclic derivatives, N,N-bis(2-ethylhexyl)-4-methyl-1H-benzotriazol-1-methanamine (NBTAH) and 2,5-bis(octyldithio)-1,3,4-thiadiazole (BTDA), were combined and used as copper inhibitors in O/W emulsions. Their anti-corrosion performance on the Cu surface was investigated via electrochemical measurements, surface characterization, adsorption isotherms and wetting techniques. The main findings are as follows.
(1) NBTAH is a mixed-type inhibitor, while BTDA is a typically anodic inhibitor. The corrosion inhibition effect of the two single inhibitors was significantly influenced by inhibitor concentrations. As the concentration of NBTAH is increased, the corrosion inhibition efficiency first increased and then decreased at a concentration of 5 mM. In the case of BTDA, the corrosion inhibition performance continuously increased over all concentration ranges.
(2) Both inhibitors can generate anodic passive films on the Cu surface, thereby enhancing its corrosion resistance. NBTAH exhibited a higher corrosion inhibition efficiency than BTDA, while BTDA possessed broadened anodic passive zones.
(3) The maximum corrosion inhibition efficiency achieved was 94.0% with a combination of 5 mM NBTAH and 8 mM BTDA. The Cu electrodes in the O/W emulsions possessed a relatively high breakdown potential under the same conditions.
(4) An anti-corrosion mechanism for adsorption and shielding of the composite inhibitors on the Cu surface is preliminarily proposed. The adsorption effect of the composite inhibitors is reflected by the chemisorption (charge transfer) or physisorption (electrostatic attraction) of the polar atoms of the benzene, azole, and thiazole rings on the Cu surface to form multilayer passive films comprised of Cu–NBTAH and Cu–BTDA chelates. The shielding effect is demonstrated by the isolation of the corrosive medium (that is, Cl−, H2O, CO2, and SO42−) from Cu surfaces.
Data availability
Data will be made available on request.
Author contributions
Xudong Yan: conceptualization, methodology, data curation, writing – original draft, supervisor. Wenjing Liu: english language editing. Yang Xu: experiments, data curation, Sang Xiong: review and editing.
Conflicts of interest
There are no conflicts to declare.
Acknowledgements
The authors acknowledge the financial support from the Young Elite Scientists Sponsorship Program by CAST (No. 2022QNRC001).
Notes and references
- P. P. Samal, A. Dekshinamoorthy, S. Arunachalam, S. Vijayaraghavan and S. Krishnamurty, Colloids Surf., A, 2022, 648, 129138 CrossRef CAS.
- S. Xiong, J. Si, J. Sun, H. Wu, H. Dong and Z. Chao, Anti-Corros. Methods Mater., 2020, 67, 214–227 CrossRef CAS.
- S. Xiong, D. Liang, Z. Ba, Z. Zhang and S. Luo, Appl. Surf. Sci., 2019, 492, 399–406 CrossRef CAS.
- C. Dong, J. Sun, Z. Cheng and Y. Q. Hou, Ind. Lubr. Tribol., 2019, 71, 74–82 CrossRef.
- B. Tan, S. Zhang, Y. Qiang, W. Li and G. Zhang, J. Mol. Liq., 2020, 298, 111975 CrossRef CAS.
- X. Yan and J. Sun, Materials, 2021, 14, 7911 CrossRef CAS PubMed.
- X. Yan, J. Sun and Y. Meng, RSC Adv., 2018, 8, 9833–9840 RSC.
- G. Gutiérrez, A. Lobo, J. M. Benito, J. Coca and C. Pazos, J. Hazard. Mater., 2011, 185, 1569–1574 CrossRef PubMed.
- C. L. Chuang and J. N. Aoh, J. Electron. Mater., 2006, 35, 1693–1700 CrossRef CAS.
- J. P. Byers, Metalworking Fluids, Society of Tribologists and Lubrication Engineers, CRC, Taylor & Francis, 2nd edn, 2006, pp. 176–181 Search PubMed.
- S. Hymes, K. S. Kumar, S. P. Murarka, W. Wang and W. A. Lanford, J. Vac. Sci. Technol. B, 1998, 16, 1107–1109 CrossRef CAS.
- Z. Khiati, A. A. Othman, M. Sanchez-Moreno, M. C. Bernard, S. Joiret, E. M. M. Sutter and V. Vivier, Corros. Sci., 2011, 53, 3092–3099 CrossRef.
- K. F. Khaled and N. Hackerman, Electrochim. Acta, 2004, 49, 485–495 CrossRef.
- M. A. Deyab, J. Power Sources, 2015, 292, 66–71 CrossRef.
- M. Uerdingen, C. Treber, M. Balser, G. Schmitt and C. Werner, Green Chem., 2005, 7, 321–325 RSC.
- A. Biswas, S. Pal and G. Udayabhanu, Appl. Surf. Sci., 2015, 353, 173–183 CrossRef.
- E. Salehi, R. Naderi and B. Ramezanzadeh, Appl. Surf. Sci., 2017, 396, 1499–1514 CrossRef.
- S. Kaul, R. Saxena, A. Kumar, M. Negi, A. Bhatnagar and H. Goyal, Fuel Process. Technol., 2007, 88, 303–307 CrossRef.
- J. B. Cotton and I. R. Scholes, Br. Corros. J., 1967, 2(1), 1–5 CrossRef.
- B. Warren, G. J. Hunt, M. Bryant, A. Neville, A. Morina and M. Gahagan, Lubr. Sci., 2018, 30, 301–315 CrossRef.
- M. A. Milan, M. M. Snežana and B. P. Marija, Corros. Sci., 2009, 51, 1228–1237 CrossRef.
- E. M. Sherif and S. M. Park, Electrochim. Acta, 2006, 51, 6556–6562 CrossRef.
- T. Young, Philos. Trans. R. Soc., B, 1805, 94, 65–87 CrossRef.
- J. Shen, D. Yang, L. Ma, Z. Gao, A. Yan and Q. Liao, Colloids Surf., A, 2022, 636, 128058 CrossRef.
- E. E. Oguzie, Y. Li and F. H. Wang, Electrochim. Acta, 2007, 53, 909–914 CrossRef.
- Y. Z. Yu, D. Yang, D. Q. Zhang, Y. Z. Wang and L. X. Gao, Appl. Surf. Sci., 2017, 392, 768–776 CrossRef.
- F. Mansfeld, Corrosion, 1981, 37, 301–307 CrossRef.
- K. Juttner, Electrochim. Acta, 1990, 35, 1501–1508 CrossRef.
- H. Cen, C. Wu and Z. Chen, Colloids Surf., A, 2021, 630, 127528 CrossRef.
- G. Sığırcık, D. Yildirim and T. Tüken, Corros. Sci., 2017, 120, 184–193 CrossRef.
- I. Ahamad, R. Prasad and M. A. Quraishi, Corros. Sci., 2010, 52, 1472–1481 CrossRef.
- H. Tian, W. Li and K. Cao, Corros. Sci., 2013, 73, 281–291 CrossRef.
- M. Finsgar, A. Lasar, A. Kokalj and I. Milosev, Electrochim. Acta, 2008, 53, 8287–8297 CrossRef.
- A. Kokalj, S. Peljhan, M. Finsgar and I. Milosev, J. Am. Chem. Soc., 2010, 136, 16299–16726 Search PubMed.
- N. Benachour, A. Delimi and H. Allal, et al., RSC Adv., 2024, 14, 12533 RSC.
- E. El-Katori and A. S. Abousalem, RSC Adv., 2019, 9, 20760 RSC.
- D. S. Chauhan, M. A. Quraishi, C. Carri`ere, A. Seyeux, P. Marcus and A. Singh, J. Mol. Liq., 2019, 289, 111113 CrossRef.
- T. Kosec, Z. Qin, J. Chen, A. Legat and D. W. Shoesmith, Corros. Sci., 2015, 90, 248–258 CrossRef.
- Y. Qiang, S. Zhang, S. Xu and W. li, J. Colloid Interface Sci., 2016, 472, 52–59 CrossRef.
- D. Gelman, D. Starosvetsky and Y. Ein-Eli, Corros. Sci., 2014, 82, 271–279 CrossRef.
- P. Kalimuthu and S. A. John, Electrochem. Commun., 2009, 11, 367–370 CrossRef.
- R. Tamilarasan and A. Sreekanth, RSC Adv., 2013, 3, 23681–23691 RSC.
- Y. Qiang, S. Zhang, S. Xu, L. Guo, N. Chen and I. B. Obot, Int. J. Electrochem. Sci., 2016, 11, 3147–3163 CrossRef.
- R. Solmaz, E. A. Sahin, A. Döner and G. Kardas, Corros. Sci., 2011, 53, 3231–3240 CrossRef CAS.
- D. Wang, B. Xiang, Y. Liang, S. Song and C. Liu, Corros. Sci., 2014, 85, 77–86 CrossRef CAS.
- L. J. Li, X. P. Zhang, J. L. Lei, J. X. He, S. T. Zhang and F. S. Pan, Corros. Sci., 2012, 63, 82–90 CrossRef CAS.
- Z. Tao, S. Zhang, W. Li and B. Hou, Corros. Sci., 2009, 51, 2588–2595 CrossRef CAS.
- J. Lawrence, Appl. Surf. Sci., 2000, 154–155, 664–669 CrossRef CAS.
- X. Song, Y. Zhang, C. Yan, W. Jiang and C. Chang, J. Colloid Interface Sci., 2013, 389, 213–219 CrossRef CAS PubMed.
|
| This journal is © The Royal Society of Chemistry 2024 |
Click here to see how this site uses Cookies. View our privacy policy here.  Open Access Article
 *a,
Wenjing Liub,
Yang Xuc and
Sang Xiong
 d
d
![[thin space (1/6-em)]](https://www.rsc.org/images/entities/char_2009.gif) cos
cos![[thin space (1/6-em)]](https://www.rsc.org/images/entities/char_2009.gif) θ = γsv − γsl
θ = γsv − γsl


 ), ω is the angular frequency, and n is deviation parameter associated with the pure capacitor. The values of n are in the range of 0–1. Furthermore, Cf and Cdl can be deduced using the following equations:31,32


![[double bond, length as m-dash]](https://www.rsc.org/images/entities/char_e001.gif) .41 This peak is indicative of the N–C bond, as determined in our previous research, and its intensity is slightly reduced.7 The –N
.41 This peak is indicative of the N–C bond, as determined in our previous research, and its intensity is slightly reduced.7 The –N![[double bond, length as m-dash]](https://www.rsc.org/images/entities/char_e001.gif) bond in NBTAH and –C
bond in NBTAH and –C![[double bond, length as m-dash]](https://www.rsc.org/images/entities/char_e001.gif) N in BTDA interacted with the Cu surface, thus resulting in the electron binding energy deviating toward the lower direction. Finally, as observed from the S 2p spectrum in Fig. 12e, the binding energy of the adsorption peak is located at 162.1 eV and 163.5 eV, representing the presence of a –S–S– bond or S2− ion.42 From the analysis, it is found that the area ratio of the two peaks is close to 4
N in BTDA interacted with the Cu surface, thus resulting in the electron binding energy deviating toward the lower direction. Finally, as observed from the S 2p spectrum in Fig. 12e, the binding energy of the adsorption peak is located at 162.1 eV and 163.5 eV, representing the presence of a –S–S– bond or S2− ion.42 From the analysis, it is found that the area ratio of the two peaks is close to 4![[thin space (1/6-em)]](https://www.rsc.org/images/entities/char_2009.gif) :
:![[thin space (1/6-em)]](https://www.rsc.org/images/entities/char_2009.gif) 1, thus indicating the existence of BTDA molecules. The peak intensity decreased owing to the chemical reaction between S2− and the copper oxides. The above XPS analysis results prove that the N, S, and other polar atoms of the benzene, azole, and thiazole rings of NBTAH and BTDA generate multi-layer passive films containing Cu–NBTAH and Cu–BTDA chelates on the Cu surface through charge transfer. This resulted in corrosion inhibition improvement on the Cu surface and realized good adsorption effects.
1, thus indicating the existence of BTDA molecules. The peak intensity decreased owing to the chemical reaction between S2− and the copper oxides. The above XPS analysis results prove that the N, S, and other polar atoms of the benzene, azole, and thiazole rings of NBTAH and BTDA generate multi-layer passive films containing Cu–NBTAH and Cu–BTDA chelates on the Cu surface through charge transfer. This resulted in corrosion inhibition improvement on the Cu surface and realized good adsorption effects.


